行政院國家科學委員會專題研究計畫 成果報告
金屬改質製備高活性二氧化鈦光觸媒粉體與薄膜之研究 研究成果報告(精簡版)
計 畫 類 別 : 個別型
計 畫 編 號 : NSC 98-2221-E-011-074-
執 行 期 間 : 98 年 08 月 01 日至 99 年 07 月 31 日 執 行 單 位 : 國立臺灣科技大學化學工程系
計 畫 主 持 人 : 曾堯宣
計畫參與人員: 碩士班研究生-兼任助理人員:郭建生 碩士班研究生-兼任助理人員:張義國
報 告 附 件 : 出席國際會議研究心得報告及發表論文
處 理 方 式 : 本計畫涉及專利或其他智慧財產權,2 年後可公開查詢
中 華 民 國 99 年 08 月 30 日
行政院國家科學委員會補助專題研究計畫 ■ 成 果 報 告
□期中進度報告 金屬改質製備高活性二氧化鈦光觸媒粉體與薄膜之研究
計畫類別:■ 個別型計畫 □ 整合型計畫
計畫編號:NSC 98 - 2221 - E - 011 - 074
執行期間: 98 年 08 月 01 日至 99 年 07 月 31 日
計畫主持人:曾堯宣
計畫參與人員: 曾堯宣、郭建宏、張義國
成果報告類型(依經費核定清單規定繳交):■精簡報告 □完整報告
本成果報告包括以下應繳交之附件:
□赴國外出差或研習心得報告一份
□赴大陸地區出差或研習心得報告一份
■出席國際學術會議心得報告及發表之論文各一份
□國際合作研究計畫國外研究報告書一份
處理方式:除產學合作研究計畫、提升產業技術及人才培育研究計畫、
列管計畫及下列情形者外,得立即公開查詢
■涉及專利或其他智慧財產權,□一年□二年後可公開查詢
執行單位:國立臺灣科技大學 化學工程系
中 華 民 國 九 十 九 年 八 月 三十 日
附件一
一、 研究方法
(一)、Au/TiO2光觸媒 1.1 Au/TiO2光觸媒材料製備
1.1.1 以光沉積法製備不同金含量的 Au/TiO2光觸媒
首先先配製不同濃度的氯金酸水溶液,再利用氫氧化鈉將 pH 值調至 7 左右,再加入 TiO2(P25)粉末及乙醇(做為電洞的補捉者,增加光沉積的效果),持續攪拌 30 分鐘後,將 其置於沉積效果較好的紫外光源-UVC 下來進行光沉積,再利用離心過濾的方法取得沉澱物 後,置於高溫爐內 100℃乾燥。在此將摻金之二氧化鈦以 PD-X% Au/TiO2代號表示(PD = photodeposition,X 表示含金的莫耳百分比)。
1.1.2 不同煅燒溫度的 PD-1% Au/TiO2光觸媒
步驟同1.1.1,差異在於 TiO2粉未是採用ST-01,以及最後將其於不同溫度下分批煅燒 三小時。在此將摻金之二氧化鈦以PD-1% Au/TiO2-T 代號表示(T 表示熱處理的溫度)。
1.2 光觸媒材料反應活性測試 1.2.2 光催化降解甲基橙脫色實驗 1.2.2.1 實驗條件
光催化降解甲基橙水溶液皆於室溫下進行。實驗光源條件分為單光源(UV-A)及雙光源 (UV-A / GLED),光源波長範圍如圖 1.所示,其實驗架置的方式相同,差別在於光源開關是 有打開,如圖2 所示。實驗光源如下:
(a)UV-A 燈源(黑燈管):架置於光源箱的頂部,光源由上向下照射,其光源波長主要為 357nm、光照度為 1.7 mW/cm2。
(b)綠色 LED 燈(GLED):架置於攪拌器與燒杯之間,光源由下向上照射,其光源波長主 要為524 ± 40nm、光照度為 1.2 mW/cm2。
1.2.2.2 實驗步驟
於200 mL 之 10 ppm 的甲基橙倒入裝含有 0.2 g 觸媒的燒杯內。將懸浮液以超音波震盪 10 分鐘後,置於暗箱內持續攪拌,於固定間隔時間以針筒吸取後,再以 0.22μm 的粒子過 濾器過濾掉觸媒顆粒後注入比色槽內。
待達到吸附平衡後開啟UVA 紫外光燈源,並於固定間隔時間取得經照射後的甲基橙水 溶液。將取得的所有甲基橙水溶液以紫外-可見光光譜儀測量波長465nm 的吸收度以觀察 脫色情形。
1.3 材料物性分析
穿透式電子顯微鏡(TEM)檢測其粒徑尺寸、UV-Vis DRS 測定其對光線之吸收,X 光單晶 繞射分析(X-ray Diffraction)檢測結晶型態與化學分析電子儀(XPS)做光觸媒材料表面元素分 析。
(二)Pd/TiO2光觸媒薄膜製備 2.1 Pd/TiO2光觸媒薄膜製備
2.1.1 含浸法製備含鈀之光觸媒溶膠
將利用化學共沉澱膠溶法製備光觸媒溶膠約250mL,此光觸媒溶膠可於長時間下均勻 分散,並加入一定量tetraamminepalladium(II) chloride 於此光觸媒中,鈀和光觸媒之含量比 分別為0%、0.25% 和 1%。
2.1.2 薄膜製備
本實驗所使用之基材為100mm x 150mm x 2 mm 的玻璃片。玻璃基材清洗部份,利用 氫氧化納與超音波震盪器清洗之。而後利用拉伸(4.3 mm/s)方式,將改質之光觸媒塗佈 於玻璃基材上,於300oC 之空氣環境下鍛燒一個小時。
2.2 光觸媒材料反應活性測試
2.2.1 光催化降解氮氧化合物測試方法
可見光活性的測試系統為仿照使用日本工業標準方法(JIS R 1701-1)作為驗證光觸媒粉 體空氣效能之標準方法。測試系統裝置包含有,測試氣體供應系統、光觸媒反應器、氮氧 化物分析儀。測試光源則使用紫外燈,其主波長分別為365nm 的光來作為激發光源。活性 測試係在連續流動式反應器中進行。
本實驗使用1ppm 之 NO,其以 1 L/min 流速通過反應器,相對濕度為 4.8 ml/min。
2.2.2 光催化降解甲基橙脫色實驗
此實驗是將製備完成的光觸媒薄膜放置於1 ppm 之甲基橙水溶液中,再將水溶液置於 暗處攪拌,待其達吸附-脫附平衡後開燈(光源強度=2.5 mW/cm2),於固定的間隔時間吸取照 光後之水溶液以紫外-可見光吸收的測定其在 465 nm 的吸收值,藉觀察甲基橙隨時間脫色 的效果。
2.3. 材料物性分析
本實驗利用 X 光單晶繞射分析(X-ray Diffraction)檢測結晶型態、Photoluminescence spectroscopy (PL)檢測光觸媒之電子-電洞再結合能力、場發射掃描式電子顯微鏡(SEM)觀測 光觸媒試片之橫切面與化學分析電子儀(XPS)做光觸媒材料表面元素分析。
(三)、Ni/TiO2光觸媒 3.1 Ni/TiO2光觸媒製備 3.1.1 含浸法
首先,先取固定量的二氧化鈦粉體(P25)與水混合後均勻攪拌約 15 分鐘,再取與二 氧化鈦不同莫耳比之硝酸鎳溶於水中。將上述兩溶液混合並加熱攪拌直到乾燥。
將上述製備之試樣放入 100oC 的烘箱中烘乾 2 小時,以確保其完全乾燥,而後將乾燥 之固體試樣以研缽磨成粉末。
3.1.2 光沉積法
取固定量的二氧化鈦粉體(P25)與水混合後均勻攪拌約 15 分鐘,再取與二氧化鈦不 同莫耳比之硝酸鎳溶於水中。
將上述兩溶液混合並加入乙醇後置於光源箱內持續攪拌並以UVC 光源(強度為 0.6-0.7 mW/cm2)照射攪拌中的懸浮液1-2 小時。而後以離心過濾的方式將水及沉澱物分離,將沉 澱固體以超純水水洗後再重複離心 2-3 次。過濾後取得的沉澱物以 100oC 乾燥約 6-8 小 時,再將乾燥過後的固體樣品以研缽磨成粉末。
※樣品代號
a.由含浸法製備的樣品代號以 IM_x%Ni/TiO2 (IM = impregnation,x%表示 Ni/Ti 比例) b.由光沉積法法製備的樣品代號以 PD_x%Ni/TiO2 (PD = photodeposition)
3.2 光觸媒材料反應活性測試 3.2.1 甲基橙降解脫色實驗
此步驟與1.2.2.2 步驟相同。
3.2.2 氮氧化物光催化降解實驗
此反應器如圖1 所示。本實驗使用 0.3 g 觸媒粉體,1ppm 之 NO,其以 1 L/min 流速通
過反應器,紫外光強度1mW/cm2,相對濕度為65%。
3.2. 材料物性分析
此實驗利用X 光單晶繞射分析(X-ray Diffraction)檢測結晶型態、Photoluminescence spectroscopy (PL)檢測光觸媒之電子-電洞再結合能力、場發射掃描式電子顯微鏡(SEM)及掃 描穿透式電子顯微鏡(TEM)觀測光觸媒粉體粒徑大小及外觀形態、化學分析電子儀(XPS)做 光觸媒材料表面元素分析、濁度計(turbidimeter)以測量光觸媒粉體分散於水中後的濁度 與反射式紫外-可見光光譜儀(DRS)檢測光線反射後之光強度轉換成相對吸收度測量粉體 之吸收峰。
二、 結果與討論
(一)、Au/TiO2光觸媒
1.1 以光沉積法製備不同金含量的 Au/TiO2光觸媒 XRD:
圖1 為 PD-X% Au/TiO2的XRD 圖,由圖可知金含量並未影響到樣品(P25)的結晶性質,
樣品仍為70%之 anatase 與 30%之 rutile 晶相,兩晶相之比例未有所改變,由 Debye-Scherrer 公式可算得二氧化鈦之anatase 結晶尺寸大約都在 18 nm 左右。
可發現到當金含量低於2%,並未觀察到金的波峰(2θ = 38.18°、44.39°、64.58°、77.55°),
推測可能因是金的含量太少,所以較難測得,隨著含量增加到2%才有出現很微弱的峰 (2θ
= 38.18°、44.39°),但 2θ = 38.18°的與二氧化鈦 anatase 相的峰重疊不易區分,這也就表示 經光沉積法所沉積到二氧化鈦上的金為金屬狀態。
20 25 30 35 40 45 50 55 60 65 70 75 80
TiO2(P25) PD-0.3%Au/TiO2 PD-0.1%Au/TiO2
Au Au Au Au
PD-0.5%Au/TiO2 PD-1%Au/TiO2
R R
R AA
A
A A A
A A A
Relative intensity
2 Theta (deg)
A
R
A:Anatase R:Rotile
PD-2%Au/TiO2
圖 1. PD-X%之 XRD 圖 圖 2. PD-X% Au/TiO2之TEM 圖: (a) 0.1% (b) 0.3% (c) 0.5% (d) 1% (e) 2%
TEM:
圖2 為 PD-X% Au/TiO2的TEM 圖,由圖可觀察到二氧化鈦的尺寸與 XRD 所算得的 結晶尺寸相近,可知其結構仍為單晶的結構,且二氧化鈦的粒徑受金含量的影響不大。在 圖4. 中之黑點經由 EDX 的確認,的確為金粒子,其外觀大致呈現圓形,而各個樣品的金 粒子平均粒徑在 16~24 nm。
UV-VIS (DRS):
圖3 為經由 UV-VIS (DRS)量測到樣品的 reflectance 再運用 Kubelka-Munk 理論所估算 出固體樣品的吸收強度。由圖3 可觀察到在經由金改質後,在波長 550 nm(對應波長為綠光 範圍)左右會出現明顯之吸收峰,其是因金粒子存在而產生表面電漿共振(surface plasmon resonance,SPR)現象所引起,所謂的表面電漿共振是指在可見光的照射下,由於金屬奈米 粒子會吸收某一個波長光的能量,使得粒子內部的自由電子,受到電場極化方向的影響而 生成不均勻的分佈,並且會有集體式的偶極震盪,稱之為表面電漿共振。由此也可證明 PD-X%系列樣品裡的金已皆被還原成零價狀態。且由圖可觀察到由表面電漿共振吸收峰其 強度會隨著金含量增加而增加。
PL:
圖4 為 PD-X%的 PL 圖,由圖可觀察到在經由金改質後,其 PL 的強度會明顯降低很 多,這因為二氧化鈦與金粒子之間會產生蕭特基能障,能有效降低電子電洞對再結合率,
進而使PL 的訊號強度變弱。由圖可知當金含量增加則其 PL 強度愈低,是因為當金粒子大 小差不多時,金含量增加金粒子數也隨之增加,則其與二氧化鈦之間所形成的蕭特基能障 數量也愈多,因此電子電洞對再結合率也愈低。但是亦有可能為過多的金粒子會覆蓋到二 氧化鈦的表面,減少了其光線吸收而減少二氧化鈦電子電洞的產生量,而導致PL 強度降低。
200 250 300 350 400 450 500 550 600 650 700 750 800
F(R)
Wavelength (nm)
PD-2%Au/TiO2 PD-1%Au/TiO2 PD-0.5%Au/TiO2 PD-0.3%Au/TiO2 PD-0.1%Au/TiO2 TiO2(P25)
350 400 450 500 550 600
Intensity(a.u.)
Wavelength (nm) TiO2(P25) PD-0.1%Au/TiO2 PD-0.3%Au/TiO2 PD-0.5%Au/TiO2 PD-1%Au/TiO2 PD-2%Au/TiO2
圖3. PD-X% Au/TiO2之UV-VIS (DRS)圖 圖 4. PD-X% Au/TiO2之PL
圖
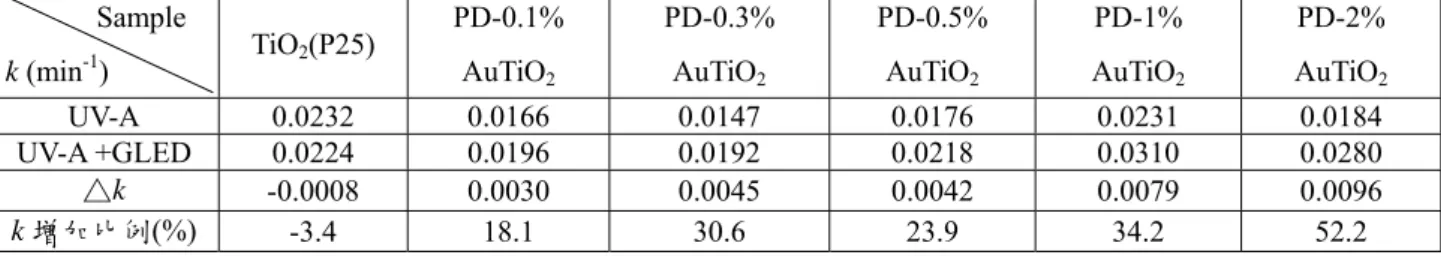
光催化活性測試:光觸媒光催化降解甲基橙水溶液是屬於擬一級的反應,經由動力學計算可算得反應的 速率常數 k,實驗結果如圖 5 及表 1 所示。
(a) UV-A 單光源照射:
雖然從其PL 圖(圖 4)可知隨著金含量增加能有效分離光觸媒電子電洞對分離的效果,
但由圖5 及表 1 可觀察到當二氧化鈦加入金改質時,在 UV-A 光照射下樣品的光催化活性 會因金粒子會佔據二氧化鈦表面的活性位置而變差。所以在兩個效應相互竸爭下,直到金 含量為1%時,兩效應持平,但當金含量增加到 2%又是活性點被佔據的效應佔優勢,所以 光催化活性又開始下降。另一面在金含量愈多時,金粒子數量愈多,電場之間則易相互重 疊到而使電場的效應變弱,進而使光催化活性降低。
(b) UV-A/GLED 雙光源照射:
由圖5 及表 1 可觀察到當 UV-A 光下多加 GLED 光源時,Au/TiO2樣品會因金粒子產 生表面電漿共振使金與二氧化鈦之產強「電場」而使光催化活性增加。且由表1. 速率常數 增加百分比的趨勢與其UV-VIS(DRS)圖(圖 7.)中表面電漿共振吸收峰的強度成正比,亦即 表示吸收的綠光愈多,產生的表面電漿共振效應更多,使得在雙光源下其光催化活性更好。
圖5. PD -X% Au/TiO2之光催化降解甲基橙水溶液效率圖 表1. PD -X% Au/TiO2之光催化降解甲基橙水溶液速率常數表
Sample
k (min-1) TiO2(P25) PD-0.1%
AuTiO2
PD-0.3%
AuTiO2
PD-0.5%
AuTiO2
PD-1%
AuTiO2
PD-2%
AuTiO2
UV-A 0.0232 0.0166 0.0147 0.0176 0.0231 0.0184
UV-A +GLED 0.0224 0.0196 0.0192 0.0218 0.0310 0.0280
△k -0.0008 0.0030 0.0045 0.0042 0.0079 0.0096
k 增加比例(%) -3.4 18.1 30.6 23.9 34.2 52.2
(二)Pd/TiO2光觸媒薄膜 2.1 物性分析
XRD:
圖6 為光觸媒之 X 光繞射圖譜。藉由圖譜結果中之(101)、(004)、(200)、(105)、(211)
和(204)晶相得知 TiO2光觸媒皆屬於Anatase 晶相。於 0.25% 和 1% 波峰上未能明顯觀 察 鈀 之 波 峰 , 推 測 鈀 和 氧 化 鈀 結 晶 尺 寸 很 小 且 均 勻 分 散 於 TiO2 溶 膠 中 或 是 tetraamminepalladium(II) chloride 所摻入的量較少,進而不易觀察之。此外,本時驗藉由 Scherrer’s equation 和主要波峰之半高寬(2θ = 25.3°)計算出 TiO2之結晶大小約分部於13 nm。因摻入之鈀鹽含量較少,故 TiO2之結晶大小較無變化。
Morphology:
藉由圖7 之橫切面圖片中得知膜厚約為 110 nm,且膜厚隨著鈀鹽之增加而未明顯改變。
圖7 之圖片的 TiO2顆粒大小(40-50 nm)較 XRD 計算之晶粒大,其原因為 TiO2薄膜經過 鍛燒後發生聚集現象而造成此現象。
Chemical states:
利用XPS可以測得TiO2 薄膜之化學組成與元素狀態。圖8(a)中,於0.25% Pd/TiO2 薄 膜未明顯看見Pd的波峰,此現象係因為鈀鹽含量較低。1% Pd/TiO2 薄膜有334.1和 337.8 eV 兩波峰,此為Pd(0)和Pd(II) 兩種元素態。PdO 為Pd(NH3)4Cl2 分解或藉由金屬鈀的高溫氧 化而得。圖8(b)中,pristine TiO2 薄膜之Ti(2p3/2,1/2)為 4+之元素態。當鈀鹽含量提高 時,發現Ti成一不對稱波峰,藉由分峰可得此波峰包含Ti4+(peak at 458.2 eV)和Ti3+(peak at 457.2 eV)。Ti3+係於高溫時TiO2提供一氧原子於金屬鈀進而形成PdO。
25 30 35 40 45 50 55 60 65
Intensity ( A.U. )
1% Pd/TiO
2
0.25% Pd/TiO
2
Pristine TiO2
AA A
A A
2 theta (degree) A
圖6. XRD patterns of prepared TiO2 films 圖 7. Cross-section and surface photographs of 1% Pd/TiO2 film
圖8. (a) XPS spectra over Pd 3d (b) Ti 2p of prepared samples PL characteristics:
於光觸媒方面,PL用於檢測光觸媒支電子與電洞分離之程度。本實驗之激發光源波長 為325nm,由圖18.中可以得知於350nm至450nm範圍內具有較強之PL訊號且Pd/TiO2 薄膜未 因摻入Pd離子而於PL光譜中產生另一特性波峰。
由電子與電洞之分離程度方面做探討,TiO2 薄膜隨著Pd含量之增加而抑制電子與電洞 之再結合能力,此現象係因為於TiO2 薄膜表面之Pd2+ 為捕捉TiO2 傳導帶所生成之電子的 抑制點,抑制光生成之電子與電洞再結合。
比較先前文獻,本實驗之PL強度隨著Pd 含量增加而PL下降程度較先前文獻來得小,
其原因為:(1)TiO2 之表面氧空缺隨著鈀鹽含量增加而些微增加。藉由XPS結果可以應證 之。文獻可以得知,半導體之激發性PL回隨著氧空缺含量增加而增加。(2)圖17. (a).顯示,
鈀元素中含有Pd(0),其捕捉電子能力較Pd(II)小。
圖9. Photoluminescence spectra of TiO2 films 2.2 光催化活性分析
(a)甲基橙脫色實驗
本實驗藉由甲基橙脫色實驗觀察TiO2 和 Pd-TiO2薄膜之光催化活性。本實驗係以擬一 級反應作為探討,1% Pd/TiO2 薄膜具有較佳之活性,其反應速率較 TiO2薄膜大1.73 倍。
此現象可由方面做為探討:(1)摻入鈀鹽後,TiO2的電子與電洞再結合能力下降(PL 可證 實之)。(2)Pd(II)會吸引甲基橙的結構中帶負電之 sulfonyl 基,進而提高其光催化活性。
0 20 40 60 80 100 120 0.0
0.2 0.4 0.6 0.8 1.0 1.2
k =0.0095 min-1
k =0.0056 min-1
-Ln ( 1-X )
Irradiation time (min) 1.00% Pd/TiO2
0.25% Pd/TiO
2
Pristine TiO2
k =0.0055 min-1 (b)
圖10. Decolourization curves of MO with various samples (b) 光催化降解氮氧化合物
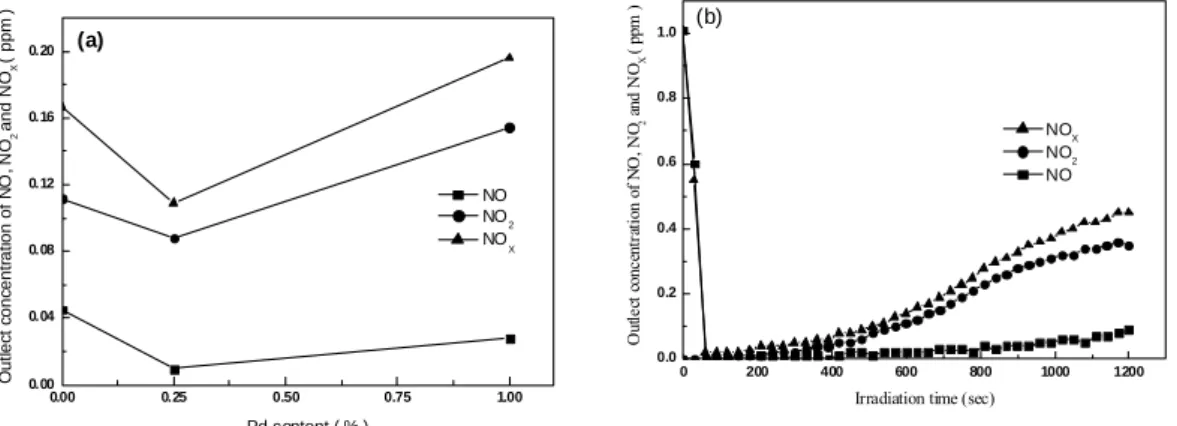
許多研究中,利用NO 氧化測定 TiO2的光催化活性]。NOX之反應機制為NO 被氧化物 質氧化成硝酸或亞硝酸(•OH 和 O2-)。圖11(a).為不同鈀比例之 TiO2薄膜於UV 光照射 下,NOX的光催化情形(NOX為NO 和 NO2的總和)。當Pd 含量增加時,NOX移除速率增 加。當Pd 含量增加至 1%時,NOX的移除速率下降,其主要原因為NO2的氧化速率下降。
1% Pd/TiO2 薄膜之第一階氧化反應(NO 至 NO2)隨著Pd 含量增加而增加,但第二階 氧化反應(NO2至 HNO3)隨著 Pd 含量增加而下降。此現象除了因過多之 Pd 進而蓋覆蓋 TiO2之活性點外,也因 TiO2表面之 Pd 離子與 TiO2之光激發電子於表面結合成 Pd(0)。因 此1% Pd/TiO2於紫外光照射下所生成之Pd(0)叫 0.25% Pd/TiO2多。
NO2 + •OH → HNO3 (1) NO + O2- → NO3- (2) NO3- + H+ → HNO3 (3)
Ohko 等人發現 HNO3於TiO2表面也可能發生光還原現象產生NO2。此機制表示:
NO3- + h+ → NO3 (4) NO3 + NO → 2NO2 (5)
NO2於1% Pd/TiO2 薄膜生成情形標示於圖 11(b)。金屬 Pd 可捕捉電洞,進而增加 HNO3於TiO2表面之還原反應。故過量之Pd 會增加 HNO3還原至NO2,使得NOX降解效 果下降。
0.00 0.25 0.50 0.75 1.00 0.00
0.04 0.08 0.12 0.16 0.20
Outlect concentration of NO, NO2 and NOX ( ppm )
Pd content ( % )
NO NO2 NOX (a)
0 200 400 600 800 1000 1200
0.0 0.2 0.4 0.6 0.8 1.0
Outlect concentration of NO, NO2 and NOX ( ppm )
Irradiation time (sec) NOX NO2 NO (b)
圖11. Degradation of NO over various TiO2 films. (a) effect of Pd content on the reaction rate (b) reaction profiles of NO over 1% Pd/TiO2
(三)Ni/TiO2光觸媒 3.1 物性分析
PL:
圖12(a)為光沉積法製備掺入不同濃度鎳的二氧化鈦之光激發螢光圖譜。由此實驗結 果可以分為兩部份做討論, 第一個部份是 PD_0.1%Ni/TiO2 及 PD_0.5%Ni/TiO2, 此二樣 品之光強度皆大於P25,此現象有兩種可能性,其一為鎳的存在時,增加電子電洞結合速 率,其二為鎳存在時可以誘導二氧化鈦產生更多的電子電洞對,進而增加光激發螢光強度。
而由後續光催化活性實驗發現此兩種樣品的活性比P25 更佳,此說明了鎳掺入後產生更多 的電子電洞對進而使得電子電洞再結合的數目提升,因此,放出的光強度增加。在此,我 們推測鎳掺入後產生了新的能階,縮短了二氧化鈦的能隙,換句話說,鎳具有光敏化的效 果,能增進光觸媒吸收光的能力。
觀察鎳濃度與光強度之間的關係可以發現, 光強度會隨著鎳濃度的增加而下降, 並 且PD_1%Ni/TiO2 到 PD_10%Ni/TiO2 的光強度都比 P25 要來的低,而光強度的降低代表:
(1)電子電洞再結合率降低(2)二氧化鈦表面活性點減少。電子電洞再結合降低是因為,
鎳掺入後會抓電子,造成電子電洞分離較好,進而抑制了再結合的情形發生;另一方面,
過量的鎳覆蓋了二氧化鈦本身的活性位置,而隨著鎳濃度的提升,覆蓋率也相對的增加,
減少表面二氧化鈦受光照射的面積,此一原因也會造成強度降低,此部分可以由後續XPS 分析結果可以驗證。
圖12.(b)是用溶膠凝膠法所製備含鎳之二氧化鈦光激發螢光圖譜。觀察實驗結果可 發現,SOL_0.1%Ni/TiO2 之光強度高於純二氧化鈦,而繼續增加鎳的濃度之後,光強度就 隨著濃度增加而降低,且除了SOL_0.1%Ni/TiO2 之外,SOL_2%Ni/TiO2 與 OL_4%Ni/TiO2
光強度皆低於純二氧化鈦,此實驗結果與PD_x%Ni/TiO2 系列之樣品相同。
圖12(a)PD_x%Ni/TiO2之光激發螢光圖譜 XPS:
圖13(a)為 PD_x%Ni/TiO2 Ni 2p 的 XPS 圖譜。鎳的各理論位置分別為:Ni0 852.7 eV,
Ni2+ 854.4 eV,Ni3+ 856.0 eV,在經過光沉積法將鎳掺入後,PD_10%Ni/TiO2 含有較多的 Ni0,而Ni2+的含量大於Ni3+,而在Ni/Ti 比例為 49.8%,代表大部分的鎳都分布於二氧化 鈦的表面,才會造成XPS 所分析表面之鎳比例遠高於添加的理論值 10% 。
PD_0.1%Ni/TiO2、PD_1%Ni/TiO2、PD_4%Ni/TiO2 的 Ni0訊號則相當微弱,大多數都 是以Ni2+、Ni3+的狀態存在,而其Ni/Ti 的比例也高於掺入的濃度,說明光沉積法所製備的 樣品,大多數的鎳都分布在二氧化鈦的表面上。而低濃度時,表面的鎳為氧化態,高濃度 時,才可以發現元素態鎳的存在,這是因為在製備過程中經由光沈積反應,水溶液中的鎳 陽離子被二氧化鈦的電子所吸引,進而以小顆粒的形式還原沈積於二氧化鈦表面,但是在 經過乾燥固定後,化學活性高的小顆粒的鎳會氧化成二價或三價的氧化鎳,但是若鎳濃度 增加時,表面的鎳顆粒變大且數量增多,因此可以保留經過光沈積還原的金屬鎳。此處的 實驗結果也說明,太大量的鎳若覆蓋於二氧化鈦的表面,減少表面二氧化鈦受光照射的面 積,而造成光激發螢光強度降低。
圖13(b)為 PD_x%Ni/TiO2 Ti 2p 的 XPS 圖譜。Ti 2p3/2 的各理論位置分別為:Ti0 454.0 eV,Ti3+ (Ti2O3) 457.8eV,Ti4+ 458.7 eV,可以發現 P25 與低鎳含量的材料中,其表面為四 價的氧化鈦,而隨鎳含量增加時,鈦的氧化價數會逐漸轉為三價,並且強度減少,其與上 述鎳的XPS 分析結果比對,可以推論為材料表面沈積的鎳量增加時,鈦含量相對減少,因 此,波峰強度減弱,而愈大量的鎳存在時,愈多鎳氧化反應發生,而會將電子傳遞至鈦上,
使其被還成Ti2O3的形式,形成三價鈦。
870 865 860 855 850 845 840 8000
9000
10000 10% Ni
4% Ni 1% Ni 0.1% Ni
Ni2+
Ni3+
Ni0+
CPS
B.E.(eV)
470 468 466 464 462 460 458 456 454
Ti3+(Ti2O3) 457.8 Ti4+
458.7
B.E. (eV) P25
0.1% Ni 1% Ni 4% Ni 10% Ni
圖13(a)PD_x%Ni/TiO2 Ni 2p(b)PD_x%Ni/TiO2 Ti 2p 的 XPS 圖譜 3.2 光催化活性分析
光催化降解氮氧化物
UVC 光沉積法製備含鎳二氧化鈦的樣品中,PD_0.1%Ni/TiO2 比起P25 或其他的 PD_x%Ni/TiO2 都有更好的NOx 去除率,移除了將近三成的NOx,有效的提升了光催化能 力。而在生成毒性較高的中間產物NO2 方面,PD_0.1%Ni/TiO2 只產生了約0.1 ppm,相較 於P25 的生成量0.27 ppm,可說是在去除氮氧化物的過程中,也有效的降低了有毒中間產 物生成。
由於所有掺鎳之樣品中,以PD_0.1%Ni/TiO2 的去除率最佳,其次是PD_0.5%Ni/TiO2, 先前的PL 實驗結果推論出,微量的Ni 掺入二氧化鈦有助於光敏化,生成較多的電子電洞 對,這些條件有利於降解氮氧化物。而為確認在本研究中具有最佳降解能力的鎳含量為 PD_0.1%,進一步取接近此濃度點之二濃度(PD_0.05%Ni/TiO2,PD_0.2%Ni/TiO2)作相同 實驗,試圖找出是否有更佳的鎳摻雜濃度,實驗結果如圖27.(c)所示。PD_0.1%Ni/TiO2 不 論是的NOx 總去除率或是在NO2 的生成量,都比其他兩個樣品要來的低。就氮氧化物的降 解氣相反應中,PD_0.1%Ni/TiO2 具有最佳的反應活性。
0 2 4 6 8 10
0.1 0.2 0.3 0.4 0.5 0.6 0.7 0.8 0.9
NO2 NO
NOx
a NO -IM
b NO2-IM c NOx-IM
d NO -PD
e NO2-PD
f NOx-PD
a
b
f
d
e c
con. (ppm)
con. of Ni doped TiO2 (mole%)
0.05 0.10 0.15 0.20
0.1 0.2 0.3 0.4 0.5 0.6 0.7
NO
NO2 NOx
con. of NO,NO2,NOx(ppm)
con. of Ni doped TiO2(mole%)
圖14.(b)以含浸法(a, b, c)及光沉積法(c, d, e)製備之樣品掺鎳濃度與氮氧化物濃度 之關係圖 (c)以光沉積法製備掺鎳濃度 0.05、0.1、0.2%之二氧化鈦降解氮氧化物圖
國科會補助專題研究計畫成果報告自評表
請就研究內容與原計畫相符程度、達成預期目標情況、研究成果之學術或應用價 值(簡要敘述成果所代表之意義、價值、影響或進一步發展之可能性) 、是否適 合在學術期刊發表或申請專利、主要發現或其他有關價值等,作一綜合評估。
1. 請就研究內容與原計畫相符程度、達成預期目標情況作一綜合評估
達成目標
□ 未達成目標(請說明,以 100 字為限)
□ 實驗失敗
□ 因故實驗中斷
□ 其他原因 說明:
2. 研究成果在學術期刊發表或申請專利等情形:
論文:□已發表 □未發表之文稿 撰寫中 □無 專利:□已獲得 □申請中 無
技轉:□已技轉 □洽談中 無 其他:(以 100 字為限)
3. 請依學術成就、技術創新、社會影響等方面,評估研究成果之學術或應用價 值
(1)本研究是以含浸法與光沉積法二種方式將金沉積在二氧化鈦光觸媒表面,利用金奈米粒子本身之特性及 可以補捉二氧化鈦被光激發電子的能力,有效減少電子電洞再結合速率,達成以簡易方式製備-高活性的光 觸媒之目的。探討不同金含量、金粒徑、二氧化鈦粒徑及製備方式對於二氧化鈦光催化效率之影響,進一步 研究金的表面電漿共振(surface plasmon resonance,SPR)現象與光催化效率之關連性。(2)本研究利用光 沉積法、含浸法、溶膠凝膠法,製備不同鎳含量之二氧化鈦光觸媒,並改變不同製備的條件,期望以簡易經 濟的方式製備出高活性的光觸媒材料。藉由調整實驗製程之參數來改變光觸媒材料的反應活性,藉此找出最 適的鎳摻雜量。
附件二
國科會補助專題研究計畫項下出席國際學術會議心 得報告
出席 2010 環境科學與發展國際研討會(2010 International Conference on Environmental Science
and Development) 會議報告
計畫編號:NSC 98 - 2221 - E - 011 - 074
出國人:服務機構 國立臺灣科技大學化學工程系 職 稱 助理教授
姓 名 曾堯宣 出國地點:新加坡
出國時間:99 年 02 月 26 日至 03 月 01 日 報告日期:99 年 03 月
附件四
出席 2010 環境科學與發展國際研討會 會議報告
一、參加會議經過 報告主題:
Preparation of Highly Active TiO
2/MWNTs Nanocomposite for Degradation of NO
x製備高活性二氧化鈦/多壁奈米碳管複合奈米材料及其降解NO
x之探 討
論文所屬領域:
Environmental Science and Development 參加會議:
2010 International Conference on Environmental Science and Development
主辦單位:
International Association of Computer Science and Information Technology
會議地點:
新加坡 時間:
Feb 26 – Feb 28, 2010
本次會議-2010 國際奈米電子會議-- 2010 環境科學與發展國際研
討會自 2010 年 2 月 26 日至 2010 年 2 月 28 日於新加坡舉行。會議主 辦單位為 International Association of Computer Science and Information Technology(IACSIT)。此會議每年年舉行 2 次,2010 年在新加坡與日 本,本次會議地點在新加坡的 Quality hotel,下一屆會議地點將會在 日本京都舉辦。
針對本會議而言,此次投稿之論文近百篇,如同一般研討會本次 會議進行時為多軌同時舉行,主要領域涵蓋了以下種類:
1. Environmental Science and Development
2. Forestry Applications and Development 3. Earth Engineering and Science
關於會議的排程,每天有四個時段,而每個時段同時有約 3 個議 程同時在進行。故雖然此次發表的論文篇數高達約一百篇,但會議進 行的很順利,在預定的時間閉幕。
二、 與會心得
本次發表論文場次:
Sunday, February 28, 2010
15:30 –Environmental Science and Development, Oral Session Room: Grand ballroom
發表論文為:
Yao-Hsuan Tseng,*, Chuan-Yu Yen, Chen-Chi M. Ma,"
Preparation of highly active TiO2/MWNTs nanocomposite for degradation of NOx "
參與國際會議發表會,自準備、報告與參與均獲益良多!不但增 進國際視野,也觀摩他人之長處與優點。在會場中遇到來自世界各國 的學者專家,在討論及分析問題上各有不同的思維模式。透過這次的 機會得以多多瞭解增廣見聞。
奈米科技的領域正在不斷急速的發展與擴張,除了基本的材料、
化學科學理論之外,在應用層面上,更是結合生物科技、醫學、環境 應用的領域。在極度膨脹的同時,應如何修正及規劃下一步,是未來 發展與科技統籌的指標。
以下為會場及報告當日圖片:
抵達會場報到
開幕式當日
報告當日演講
三、 攜回資料與內容
此次大會提供最重要的資料內容為會議議程書,包括發表研討會 的場次、時間、地點、主講人、講題內容等。以及論文光碟一片,為 電子格式的論文資料。
四、 其他
參加此次會議,與各國學者專家交換心得與經驗,相信對我在研
究方法、過程與成果乃至未來研究領域的擴展,助益良多,並能提升
研究之品質。另外,以個人而言,參與本次研討會其中以準備報告以
及實際發表收穫最多,不但是一種良好的訓練,也是增加經驗的最佳 方式。
另外,在參加此研討會時,亦加入成為 IACSIT 的 Senior
Member,並且受邀成為下屆研討會(2010 International Conference on Environmental and Agriculture Engineering ICEAE 2010)之論文審查委 員,增加與國際會議事務的聯繫與合作。
五、 致謝
承蒙國科會(NSC 98-2221-E-011-074)補助開會所需的費用,僅此
致謝。
2010 環境科學與發展國際研討會發表之論文
Preparation of highly active TiO
2/MWNTs nanocomposite for degradation of NO
xYao-Hsuan Tseng 1+, Chuan-Yu Yen 2 and Chen-Chi M. Ma 2
1 Department of Chemical Engineering, National Taiwan University of Science and Technology, Taipei, 106 Taiwan
2Department of Chemical Engineering, National Tsing Hua University, Hsin-Chu, 300 Taiwan
Abstract. This study investigates the effects of the acid pretreatment for multi-walled carbon nanotubes (MWNTs) on the photocatalytc activity of TiO2/MWNTs nanocomposites, obtained by sol-gel processes. The synthesized nanocomposite materials were characterized by X-ray diffraction, Brunauer-Emmett-Teller adsorption analysis, photoluminescence spectroscopy, and transmittance electron microscopy. The photocatalytic capacities of the nanocomposites were performed upon the oxidation of NO over photocatalyst under UV light. Results indicate the efficiency of NOx photodegradation for the nanocomposite is greatly enhanced, as the acid pretreatment time increases from 0 to 4 hrs. This depicts the acid pretreated time plays an important factor on physicochemical properties of materials, consequently influence the photocatalytic capacity of the TiO2/MWNTs nanocomposite.
Keywords: nanocomposite photocatalyst, titanium dioxide, multi-walled carbon nanotubes, acid pretreatment
1. Introduction
Titanium dioxide has been extensively employed as photocatalytic materials in the use of heterogeneous prolonged-photocatalytic oxidation for organic pollutants treatment. However, the TiO2 photocatalyst often retains a small reaction area, i.e., large primary and secondary particle size, due to the growth of crystalline grain and agglomeration in the calcination. Hence, the decrease of sintering effect in the preparation procedure of photocatalyst is a key point in increasing photocatalytic activity.
Carbon nanotubes (CNTs) have attracted considerable attention due to their 1D structure and special physicochemical properties. Composites containing CNTs have been studies, which exhibit cooperative or synergetic effects between the metal oxides and carbon phases [1,2]. In this study, the TiO2/MWNTs nanocomposite was prepared by the sol-gel procedure, and the effects of multi-walled carbon nanotubes with different extents of acid pretreatment on the photocatalytic capacity for the TiO2/MWNTs nanocomposite were investigated. The physicochemical properties and photocatalytic characteristics of the nanocomposite photocatalyst were investigated in detail. The photoactivities of the synthesized nanocomposites were evaluated upon the oxidation of NO under UV illumination. The characteristics of synthesized nanocomposites were also investigated for satisfactory explanations of the different photocatalytic capacities.
2. Experimental part
TiO2/MWNTs nanocomposite catalysts with the same MWNTs loading and TiO2 content were prepared by sol-gel method. MWNTs (trade name: Ctube 100, CNT CO. LTD., Korea) were pretreated acid for different durations (0.5, 4, and 10 hrs) before the preparation of the TiO2/MWNTs nanocomposites [1]. The acid treatment of MWNTs was achieved according to a nitric acid washing procedure; 2 g of raw MWNTs were submerged in 100 mL of 65 wt % nitric acid for different durations to obtain oxygenated functionalities on the MWNTs surface. Then, the MWNTs were dried at 105 ◦C for 12 hrs. The preparation of TiO2/MWNTs was performed at room temperature as following: 0.17 g MWNTs were added in 50 mL anhydrate ethanol. Then 50 mmol of tetrabutyl orthotitanate was introduced into the MWNTs ethanol
ISBN 978-1-84626-xxx-x Proceedings of 2010 International Conference on Environmental Science and Development Singapore, 26-28 February, 2010, pp. xxx-xxx
solution. Subsequently, the solution was stirred magnetically for 30 min, and then 4 mL of nitric acid (65 wt
%) and 20 mL of deionized water were added into the system. Finally, the mixture was loosely covered and kept stirring in air for 2 days, and then the xerogel was crushed into fine powder. The powder was dried at 80
oC for 10 hrs, and then calcined at 350 oC for 5 hrs in air to obtain TiO2/MWNTs nanocomposite catalysts.
The nanocomposites are assigned as CT-X, where X (0, 0.5, 4, and 10) corresponds to the acid pretreatment time (hrs) of MWNTs. The neat TiO2 was also obtained via the same sol-gel procedure without addition of MWNTs.
The crystal phase and specific surface area of nanocomposites were characterized by using X-ray diffraction (Shimadzu XD-5) and BET adsorption analysis (ASAP 2000 apparatus), respectively. The
morphology was observed by a transmittance electron microscopy (PHILIPS M100). The photoluminescence spectroscopy (PL) were obtained on a luminescence spectrometer (Hitachi F-7000) under excitation of 325 nm irradiation. The photocatalytic capacity of TiO2/MWNTs nanocomposites were measured by the degradation of NO under UV illumination performed in a continuous flow system [2].
3. Results and discussion
The results of XRD and BET analysis for the nanocomposites with MWNTs pretreated under different extent acid pretreatment are presented in Table 1. The XRD results reveal that only TiO2 in anatase phase (2θ
= 25.4◦, {101}) can be identified for neat TiO2 and nanocomposites. Clearly these nanocomposites yield no peak at 2θ positions of 26.0◦ and 43.4◦, which would be characteristic of carbon nanotubes [3]. It was proposed that the main peak of MWNTs at 26.0◦ might be overlapped with the main peak of anatase TiO2
crystallite at 25.4, since they are so close [1]. Meanwhile, it is obvious that the specific surface area (SSA) of the sample is increased as theacid pretreated time of MWNTs is increased. Although the crystallite size of TiO2 is decreased with the increase of acid pretreated time of MWNTs, the difference of specific surface area among these samples is not principally caused by this size of TiO2. Theoretically, the nonporous 7.3nm-TiO2 particle is only 1.07 times the specific surface area of 7.8nm-TiO2[4]. The ratio of SSACT-4/ SSACT-0 is 1.45 from the estimation of Table 1. Thus, such changes of the surface area could be explained by the contribution of the inner cavities of the MWNTs resulting from the acid pretreatment and calcination in air [1]. As the MWNTs are oxidized by the acid activation and additional thermal treatment, the tips of nanotubes might be broken and the inner cavities become accessible to adsorption. On the other hand, longer acid pretreatment for MWNTs may induce the inner cavities of MWNTs to be emerged easily after calcinations in air, leading the enhancement of surface area of the materials. With a smaller crystalline or particle size of TiO2, the number of active surface sites increase generally. The number of active sites was also the important factors for the photoatalytic capacity of the material. As shown in Table 1, the neat TiO2 of 9.2 nm size is observed, while those of nanocomposite catalysts decrease from 7.8 to 6.8 nm for CT-0.5 to CT-10. This phenomenon might be due to the interaction between the hydrolyzed titania precursor and the chemical groups (e.g. –OH and –COOH) on the defects of MWNTs from acid treatment. In this case, the defects of MWNTs might be considered as the sites of grain growth for TiO2 crystallite in the TiO2/MWNTs nanocomposite systems. As the quantity of MWNTs defect resulted from acid pretreatment is increased, the TiO2 domain on MWNTs
resulting in the decrease of TiO2 crystalline size and secondary particle size. Thus, it is suggested that the titanium precursor could interact with the defect sites on the MWNTs surface by adsorptions. It could cause the TiO2 to be the fleck-like microstructure and well dispersed on the MWNTs surface in the calcination as shown in figure 1(a). The morphology of pristine TiO2 as shown in figure 1(b) indicated the obvious agglomeration phenomenon in the calcination step, resulting the secondary particle size of pristine TiO2 is much larger than that on TiO2/MWNTs. In general, the photoactivity of TiO2 was strongly dependent on the degree of aggregation [4].
The surface area and crystal phase were not the only factors that affect the photoactivity of MWNTs /TiO2 nanocomposite catalysts. The rate of recombination of e-/h+ pairs is also a key factor [6]. The MWNTs bound to TiO2 can conduct electrons easily [5], while the electrons generated from TiO2 by UV irradiation.
Accordingly, the efficiency of recombination of e-/h+ pairs in the nanocomposite may decrease [4]. The PL emission spectra (figure 2) were detected to elucidate the fate of e-/h+ recombination in the photocatalysts.
For the purpose of comparison, the commercially available photocatalyst (P25; Degussa AG, Frankfurt) was used as reference under the same condition. There are two interesting phenomena in the PL spectra. First, the PL intensity of the pristine TiO2 is larger than that of P25 due to the particle size of prepared TiO2 is smaller than P25. The excitonic PL intensity of semiconductors increases as the particle size decreases, which is ascribed to the increase in the content of surface oxygen vacancy and defect with decreasing particle size [6]. However, the amount of active site on TiO2 increases with the decrease of particle size. Second, it can be seen that the pristine TiO2 and TiO2/MWNTs exhibit the similarly excitonic PL emission band [6], demonstrating that MWNTs do not give rise to new PL phenomena. The peak intensity of PL spectra of the nanocomposite catalysts was smaller than that of pristine TiO2, indicating that the electron-hole recombination rate of self-trapped excitations in TiO2 is reduced by the introduction of MWNTs [1]. Furthermore, the PL intensity of TiO2/MWNTs samples decrease as the increase of acid pretreatment time, probably because of the homogeneous distribution of TiO2 on the MWNTs surface in the sol-gel system. The defects on MWNTs are considered as the sites of grain growth for TiO2. Thus, the increase in amount of defect on MWNTs under the longer acid pretreatment time gives the smaller TiO2 crystallite size and better distribution on the MWNTs surface. The less agglomeration of TiO2 on MWNTs causes the efficient migration of electrons from TiO2 to MWNTs, and greatly reducing the probability of e-/h+ recombination [1].
Many researchers use NO oxidation to determine photocatalytic reactivity in various TiO2
photocatalytic applications [2]. The electron-hole pair generated upon light excitation is trapped at the TiO2 surface as spatially separated redox active sites. Some studies report the formation of reactive oxygen species, such as superoxide ion (O2•-), atomic oxygen (O), O-, OH and HO2 radicals on the surface of TiO2 irradiated with UV light [7,8]. The nitric monoxide is oxidized to nitric acid or nitrous acid by active oxygen species.
Based on the gas-phase chemistry of NOx [2], NO is converted to HNO3 as a consecutive photooxidation via a NO2 intermediate.
The CT-4 was applied to illustrate the reaction behavior of NO photocatalytic oxidation as shown in figure 3. At first, a 1 ppm NO gas stream was introduced into the reactor under dark conditions. The NO
saturated on the TiO2, and the NO concentration was returned to 1 ppm. The steady state of this reaction was achieved as soon as the CT-4 was illuminated. The NO concentration decreased from 1 ppm to 0.60 ppm, and the NO2 concentration increased to 0.06 ppm. The NOx concentration, which includes NO and NO2
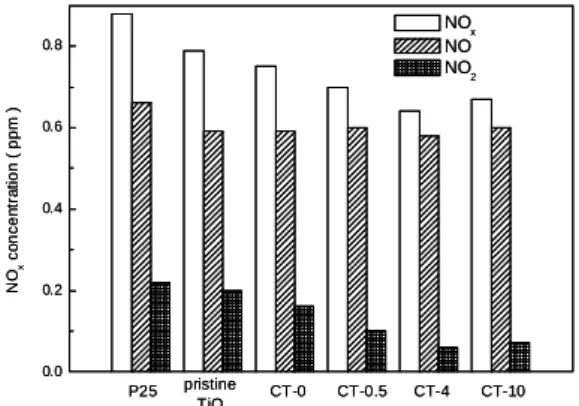
concentrations, was maintained at 0.66 ppm for 30 minutes under UV illumination. Figure 4 shows the average concentration profiles of NO, NO2, and NOx during the reaction period depending on the catalysts.
The results indicate the values of NOx conversion for all prepared TiO2 samples were higher than that of P25.
The better photoactivity of the pristine TiO2 than P25 is attributed to its large surface area and pure anatase crystal phase (SSAP25 = 53 m2/g, Rutile/Anatase = 1/3 [4]). Furthermore, when MWNTs are introduced into the nanocomposites, the NOx conversion is enhanced greatly. The figure shows that the NO and NOx concentration gradually decreases with the increase of acid pretreatment time until 4 h. The results of
nanocomposites are consistent with PL spectra as shown in figure 2. Thus, the photoactivity of TiO2 material will be enhanced with the presence of proper amount of MWNTs due to the suppression of e-/h+
recombination. Meanwhile, the concentration of NO2 remains at a quite small value, indicating that the presence of MWNTs will suppress the generation of oxidation intermediate, NO2. It might be due to the retention time of NO2 on TiO2 and the reactivity of TiO2 are increased in the presence of MWNTs. It is a worthy property for NO-removal photocatalysis due to NO2 is an undesired intermediate in the consecutive oxidation of NO. However, it is interesting to notice that the photocatalytic activity of the sample CT-10 is slightly less than that of the sample CT-4 even though the surface area of CT-10 is larger than CT-04. The phenomenon may be due to the longer acid treatment time. Several papers indicate the character of MWNTs (graphite structure) could increase the adsorption capacity of catalyst for pollutants [1]. The longer acid pretreated process may cause the graphite structure of MWNTs to be oxidized seriously, and thus inhibit the photocatalytic capacity of the material. Thus, the optimal acid pretreatment time of MWNTs is 4 hrs for the best photocatalytic nanocomposite in this procedure.
4. Conclusion
In conclusion, the effects of acid pretreatment on the photocatalytic efficiency for TiO2/MWNTs nanocomposites were investigated in this study. Results depicted TiO2 crystalline size and the inner cavities of MWNTs were the important factors for controlling the surface area and number of active surface sites for the materials. These factors could be tailored by the acid pretreatment of MWNTs for the improvement of photocatalytic capacity of TiO2/MWNTs nanocomposites due to suppression of electron-hole recombination rate and agglomeration of TiO2 particle.
5. Acknowledgments
The financial support of this work, by the National Science Council of the Republic of China under contract no. NSC NSC-97-2218-E-011-005, is gratefully acknowledged.
6. References
[1] Y. Yu , J.C. Yu, C.Y. Chan, Y.K. Che, J.C. Zhao. Enhancement of adsorption and photocatalytic activity of TiO2
by using carbon nanotubes for the treatment of azo dye. Appl Catal B 2005, 61: 1-11.
[2] C.S. Kuo, Y.H. Tseng, H.Y. Lin, C.H. Huang, C.Y. Shen, Y.Y. Li, S.I. Shah, C.P. Huang. Synthesis of a CNT- grafted TiO2 nanocatalyst and its activity triggered by a DC voltage. Nanotechnology 2007, 18: 465607.
[3] S.W Lee, and W.M. Sigmund. Formation of anatase TiO2 nanoparticles on carbon nanotubes. Chem. Commun.
2003, 6: 780-1.
[4] Y.H. Tseng, H.Y. Lin, C.S. Kuo, Y.Y. Li, C.P. Huang. Thermostability of nano-TiO2 and its photocatalytic activity.
React. Kinet. Catal. Lett. 2006, 89: 63-9.
[5] J.C. Charlier. Defects in carbon nanotubes. Acc. Chem. Res. 2002, 35: 1063-9.
[6] L. Jing, Y. Qu, B. Wang, S. Li, B. Jiang, L. Yang, W. Fu, H. Fu, J. Sun. Review of photoluminescence
performance of nano-sized semiconductor materials and its relationships with photocatalytic activity. Sol. Energ.
Mater. Sol. Cell. 2006, 90: 1773-87.
[7] A. Walker, M. Formenti, P. Meriaudeau, S.J. Teichner. Hetrogeneous photocatalysis: photooxidation of methylbutanols. J. Catal. 1977, 50: 237-43.
[8] T. Hirakawa, and Y. Nosaka. Properties of O2•- and OH• formed in TiO2 Aqueous suspensions by photocatalytic reaction and the Influence of H2O2 and some ions. Langmuir 2002, 18: 3247-54.
Table 1 The physicochemical properties of the TiO2/MWNTs nanocomposites.
Sample Crystallite SBET (m2/g) dTiO2a (nm) Pristine TiO2 anatase 146.2 8.8 ± 0.1
CNT - 297.2 -
CT-0 anatase 179.3 7.8 ± 0.1
CT-0.5 anatase 201.1 7.6 ± 0.1
CT-4 anatase 260.8 7.3 ± 0.1
CT-10 anatase 288.6 6.9 ± 0.1
420 440 460 480 500 520 540 560 580 600 620 640 660 680
Intensity ( a. u. )
W avelength ( nm )
Pristine TiO2 P25 CT-0 CT-10 CT-4
50 nm 50 nm
(a) (b)
50 nm 50 nm
(a) (b)
420 440 460 480 500 520 540 560 580 600 620 640 660 680
Intensity ( a. u. )
W avelength ( nm )
Pristine TiO2 P25 CT-0 CT-10 CT-4
50 nm 50 nm
(a) (b)
50 nm 50 nm
(a) (b)
Figure 1. TEM morphology of (a) CT-4 and (b) pristine TiO2. Figure 2. The photoluminescence spectra of variant catalysts
0.0 0.2 0.4 0.6 0.8
CT-0 CT-0.5 CT-4 CT-10 pristine
TiO2 P25 NOx concentration ( ppm )
NOx
NO NO2
0 10 20 30 40 50 60
0.0 0.2 0.4 0.6 0.8 1.0
NO
NOX Light off
Light on
[ NOx] ( ppm )
Illumination time ( min ) NO2
0.0 0.2 0.4 0.6 0.8
CT-0 CT-0.5 CT-4 CT-10 pristine
TiO2 P25 NOx concentration ( ppm )
NOx
NO NO2
0 10 20 30 40 50 60
0.0 0.2 0.4 0.6 0.8 1.0
NO
NOX Light off
Light on
[ NOx] ( ppm )
Illumination time ( min ) NO2
Figure 3. Reaction profile of NO over the CT-4 photocatalyst during 30 mins on stream: catalyst loading, 0.1 g; intensity of UV irradiation, 1 mW cm-2; relative humidity, 55%; inlet
Figure 4. Concentrations of NO, NO2, and NOx under UV illumination during the degradation of NO over different catalysts.
A01;A02;A03;A04;A05;A06;A07;A08;A09;A10;A11;A12;A13;A14;A15;A16;A17;
A18;A19;A20;A21;A22;A23;A24;A25;A26;A27;A28;A29;A30
"";"普通件";"普通";"";"";"";"";"";"綜合處";"";"產學合作計畫編號 98-2622-E-228 -001 -CC3(黃景東) 980701 至 990630";"C3504-0001";"10";"";"工程處";"會計室
";"";"";"一、產學合作計畫經費報銷案(經費支出憑證請學術處審核支用項目是否 符合原核定項目)
二、請惠示卓見 此致 工程處、會計室
";"";"*099C0A26365*";"099C0A26365";"(02)27377571";"蔣真
";"(02)27377924";"[email protected]";"";"";"";""