Research Express@NCKU - Articles Digest
Research Express@NCKU Volume 19 Issue 2 - July 1, 2011
[ http://research.ncku.edu.tw/re/articles/e/20110701/3.html ]
Application of Formosat-2 high-spatiotemporal
imagery on monitoring the dynamic changes of glaciers
and ice shelve
Cheng-Chien Liu
Earth Dynamic System Research Center, National Cheng-Kung University [email protected]
T
his four-year project aims at monitoring the dynamic changes of glaciers and iceshelves using Formosat-2 high-spatiotemporal imagery. A total of 19 SCI papers were published from 2006 to 2010, with four published in 5% and three published in 10% high-impact journals. During this project, National Space Organization (NSPO) demonstrates that Formosat-2 is able to acquire both high-spatial- and high-temporal-resolution optical imagery for the entire Polar Regions (Liu et al., 2008). We demonstrate its applications with regard to observing the sea ice condition, monitoring the daily changes in ice
shelves, and tracking floating ice with sizes of tens of meters for ten consecutive days from 3/24/2006 to 4/2/2006 in the vicinity of Alert, Canada (Fig. 1) (Liu et al., 2009). We also present the first high-spatial-resolution (2m) and multi-spectral image of Amundsen-Scott South Pole Station, which is ideal for monitoring the environment around the station, particularly when the outdoor activities are restricted by severe weather conditions (Fig. 2) (Liu et al., 2008). The retreat of glacier would accelerate its movement, mass balance, and sea level rising (Fig. 3). Using the digital elevation model (DEM) generated from Formosat-2 2m panchromatic imagery will give us more accurate information of mass balance. During the Wilkins Ice Shelf break-up event in March 2008, we collaborated with the Chief scientist Dr. Ted Scambos in National Snow and Ice Data Center and British Antarctic Survey and had a joint press release to report this astonishing event (Fig. 4). Our paper was also published in the high-ranking journal a few months later (Scambos et al., 2009). In addition, during the Ward-Hunt Ice Shelf break-up event in March 2008, NSPO took a total of 17 images and six of them provides the information of sea ice, ice shelf, crevasses, and melting ponds (Fig. 5). Together with the topographic features reveled by the
high-spatial-resolution imagery,we are able to retrieve the thickness of Ward Hunt Ice Shelf (Fig. 6). This provides the crucial information of sea ice retreat, current distribution, hydro-fracture and spatiotemporal variation of ice shelf.
Research Express@NCKU - Articles Digest
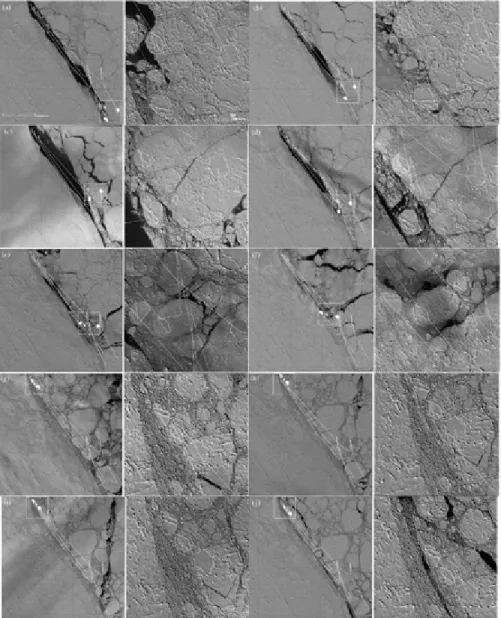
Fig. 1. Shown above is a series of time-sequential Formosat-2 imagery on the marginal ice zone (MIZ) in Alert, Ellesmere Island, the Canadian high Arctic (Liu et al., 2009): (a) 2006/3/24; (b) 2006/3/25; (c) 2006/3/26; (d)
2006/3/27; (e) 2006/3/28; (f) 2006/3/29; (g) 2008/3/30; (h) 2008/3/31; (i) 2006/4/1 (j) 2006/4/2. This set of imagery proves that Formosat-2 is capable of monitoring site with fast variation (Liu et al., 2009).
Fig. 2. It is the first optical, true color, 2-meter satellite imagery of the South Pole and the Amundsen-Scott Antarctic Station, acquired by Formosat-2 fully controlled by NSPO, Taiwan (2006/12/16). The “P” circles the approximated location of the South Pole, while the “E” squares the main building of the Amundsen-Scott Station
Research Express@NCKU - Articles Digest
(Liu et al., 2008).
Fig. 3. Given is the 3D view of the Helheim Glacier in Greenland by Formosat-2, with the elevation three times exaggerated. It shows that the calving bay was filled with calved ice bergs and ice floes. Ice loss could be derived
from the change of elevation and the boundary of the calving boundary with a remarkably high resolution according to Formosat-2, for the spatial resolution is around 2 meters and the DEM resolution is around 15 meters.
(Both of the extracted digital elevation model (DEM) and the texture were extracted from Formosat-2 iamgery pair.)
Fig. 4. The calving event of Wilkins Ice Shelf. While MODIS imagery, in the left, only reveals the event, Formosat-2 captured two detail evidences: the shadow behind the ice berg represents the height of the ice berg; while the bluish color directly suggests that it was from the bottom of the ice berg and proves the mechanism of toppling. These two evidences suggest that water pressure bends the ice shelf and contributes to this calving event
(Scambos et al., 2009).
Research Express@NCKU - Articles Digest
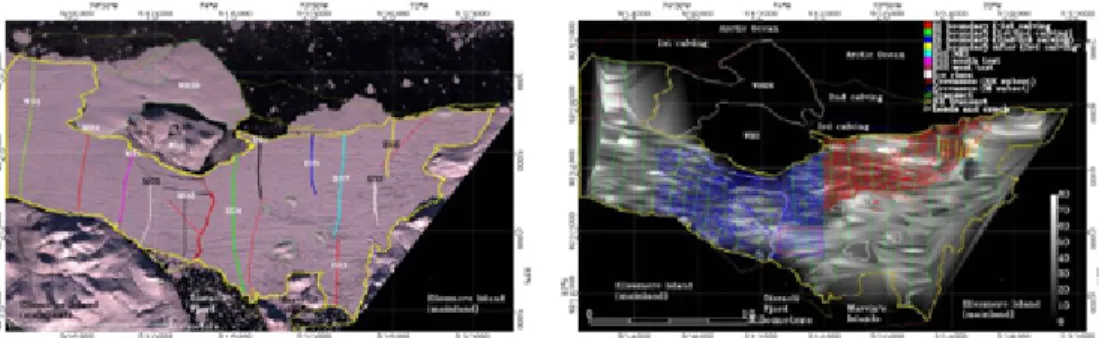
Fig. 5. Spatio-temporal formosat-2 imagery of the variation of ice boundary in Ward Hunt Ice Shelf, the Canadian High Arctic ( 2008-07-17 ~ 2008-08-18, the seceond calving of the year). This set of imagery suggests close relationship of melt water, fractures and calving events. In the area of the red square in 20080722, and the imagees
of the following dates, crevasses extended while the melt ponds drained. And in 20080726, the ice shelf calved a significant part. In addition, although sea ice floes was shown to retreat westwardly and north, as in red arrows, a small group of floes moved eastwardly (20080727), indicated by yellow arrows. It suggest that local ocan current
may play some roles in calving events.
Fig. 6. The distance of the rolling ground features was long being suggested to be related to the thickness of ice shelf in this area. The derivation of the “pseudo-thickness“ suggest that certain areas are thinner than others, which is correspondent to the suggested ablation zones of bottom ocean current and the pressure zones, aligning with past
researches .