投資人之交易偏好分析
The Analysis of Trading Preferences among Various Types of Investors
林岳喬
國立中正大學會計與資訊科技研究所副教授 蔡志豐
國立中正大學會計與資訊科技研究所助理教授 王依婷
國立中正大學會計與資訊科技研究所研究生
Abstract
This thesis investigates whether there are specific trading preferences for stock characteristics among various types of investors in Taiwan stock markets. By examining the stock trading, we apply the methods of statistical regression and data mining to investigate whether the investors in different dimensions, such gender, wealth levels, and trading frequency show any preferences for stock characteristics, such as EPS, dividend yield, market-to-book, and prices. The results show that in general, investors in Taiwan show trading preferences for stocks with shorter listed periods, higher beta, lower dividend yield, greater EPS, lower prices, lower P/E ratios, and larger sizes.
However, male investors, less-wealthy investors, investors living in the North region, investors with less trading frequency, and less experienced investors are more likely to make risky trading, and tend to be more adventurous and overconfident than other investors.
Key Words: Trading Preferences, Investors, Stock Characteristics
Index
Introduction...1
1. Research Background...1
2. Research Objectives...4
Literature Review...6
1. Investor Preferences for Stock Characteristics...6
(2) Domestic Institutional Investors...6
(2) Foreign Institutional Investors...7
(3) Comparison of Individual vs. Institutional Investors...8
2. Analysis of Investor Characteristics Affecting Security Portfolio Preference10 (2) Gender...10
(2) Wealth...10
(3) Local Preference...11
(4) Experience...12
3. Data Mining...12
(2) Data Mining: A brief explanation...12
(2) Models of Data Mining...13
(3) Methods of Clustering...14
①. The Hierarchical Clustering...14
②. The Nonhierarchical Clustering...15
(4) Self Organizing Map...15
(5) The Decision Tree...17
4. Related Work...17
(2) Application in Forecasting Stock Market Returns...18
(2) Application in Knowledge Discovery in Financial Investments...18
5. Summary...19
Research Methodology...20
1. Data...20
2. The Measure of Trading Preferences...21
3. Stock Characteristics...22
4. Investor Characteristics...24
(2) Gender...24
(2) Wealth...25
(3) Region...26
(4) Trading Frequency...26
(5) Trading Experience...27
5. Regression Model...27
6. Data Mining...28
(1) Self Organizing Map...28
(2) The Decision Tree...28
7. The Diagram of Process...29
Empirical Results and Analysis from Statistical Regressions...30
1. Trading Volume vs. Investor Characteristics...30
2. Trading Volume vs. Stock Characteristics...31
3. Stock Preferences of Various Investors...31
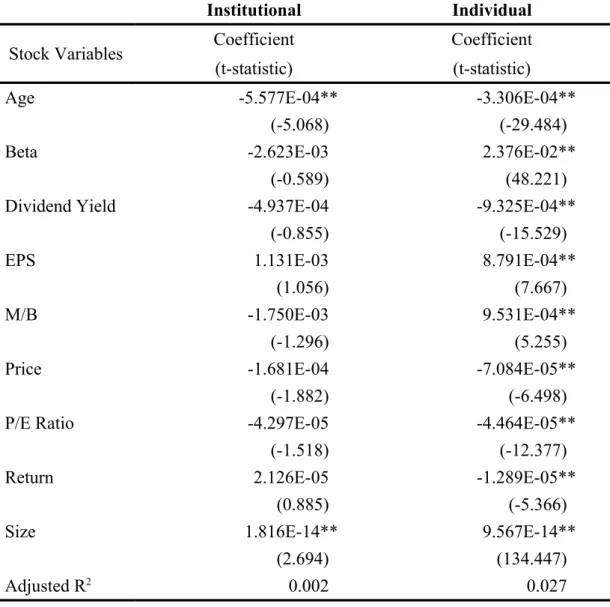
(1) Institutional Investors vs. Individual Investors...32
(2) Gender...33
(3) Wealth Level...34
(4) Region...35
(5) Trading Frequency...35
(6) Trading Experience...36
4. Summary...36
Empirical Results and Analysis from Data Mining...38
1. Self Organizing Map...38
2. Decision Tree...38
3. Summary...39
Conclusions and Future Work...41
1. Trading Volumes vs. Investor Characteristics...41
2. Trading Volume vs. Stock Characteristics...42
3. Trading Preferences for Stock Characteristics among Various Investors: Results from Statistical Regression...42
4. Trading Preferences for Stock Characteristics among Various Investors: Results from Data Mining...44
5. Comparison of Regression and Data Mining...46
6. Future Work...46
Appendix...48
Reference...64
List of Figures
Figure 1: Illustration of a Hierarchical Clustering Algorithm (Vijaya et al., 2006) ...15 Figure 2: Illustration of the Network of 4×4 Kohonen’s Self Organizing Map (Kuo
et al., 2002)...16
List of Tables
Table I: Number of Accounts Opened at Securities Companies...1
Table II: Summary Data of Stock Market...2
Table III: Financial, Economic, and Marketing Applications of SOM...16
Table IV: Trade Records of Investors...48
Table V: Descriptive Statistics for Stock Characteristics...48
Table VI: Data of Male Investors and Female Investors...49
Table VII: Data of Wealth Groups for Individual Investors...49
Table VIII: Data of Region Groups for Individual and Institutional Investors. .49 Table IX: Data of Frequency Groups for Individual and Institutional Investors50 Table X: Data of Trading Experience Groups for Individual and Institutional Investors...50
Table XI: Descriptive Statistics for Average Annual Value of Total Trading Amount Per Account and Total Annual Trading Amount Divided by Wealth Per Account...51
Table XII: Descriptive Statistics for Average Annual Value of Total Trading Amount Per Stock and Total Annual Trading Amount Divided by Size Per Stock...52
Table XIII: Investors’ Preferences for Stocks...53
Table XIV: Stock Preferences of Institutional and Individual Investors...54
Table XV: Stock Preferences of Male and Female investors...70
Table XVI: Stock Preferences of Individual Investors with Different Wealth Levels ...56
Table XVII: Stock Preferences of Investors from Different Regions in Taiwan. 57 Table XVIII: Stock Preferences of Investors with Different Trading Frequencies58 Table XIX: Stock Preferences of Investors with Different Trading Experiences 59 Table XX: Summary for the Stock Preferences of Investors from the Result of Regression...60
Table XXI: Clustering Distribution of SOM 3×3...61
Table XXII: Clustering Distribution of SOM 4×4...61
Table XXIII: Summary for the Result of SOM for Stock Characteristics...62
Table XXIV: Summary for the Primary Rules of C5.0...62
Table XXV: Summary for the Primary Rules of CART...62
Table XXVI: Summary for the Primary Rules of the Decision Tree...63
Introduction
1. Research Background
The trading activities of stock have been very popular in many countries including Taiwan. In recent years, Central Banks in many countries have kept the interest rates at very low levels. Consequently, investors in Taiwan tend to invest their money in stocks because the stock investment creates the opportunities for investors to earn significant rate of return in a very short period. As a result, the investor accounts are increasing steadily in recent years. The stock account growth can be seen in Table I.
Table I
Number of Accounts Opened at Securities Companies
Year Accumulated Investor Accounts
(Unit: Accounts)
1996 6,143,767
1997 7,746,543
1998 9,587,855
1999 10,916,426
2000 12,359,893
2001 12,910,531
2002 12,869,344
2003 13,053,178
2004 13,720,461
2005 14,002,106
data source: Taiwan Stock Exchange Corporation
Nevertheless, the stock market is usually in the volatile condition, and
the risk of stock investments is far above that of savings accounts or bond
investments. Thus, in order to gain returns on the stock, investors have to
understand the news development of listed firms, the effects of economic
environment, and the investing behavior of other investors. Hence, to be
the winners in the stock market, investors must have the ability to gather,
interpret, and analyze the information relevant to the stock markets.
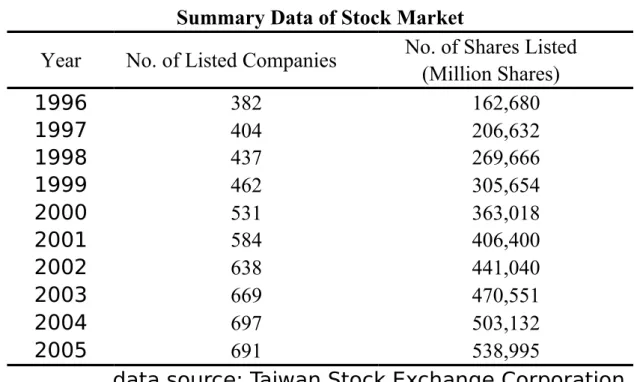
Table II
Summary Data of Stock Market
Year No. of Listed Companies No. of Shares Listed (Million Shares)
1996 382 162,680
1997 404 206,632
1998 437 269,666
1999 462 305,654
2000 531 363,018
2001 584 406,400
2002 638 441,040
2003 669 470,551
2004 697 503,132
2005 691 538,995
data source: Taiwan Stock Exchange Corporation There are a lot of stocks in the stock market. Taking Taiwan Stock Exchange as an example, there are 691 listed firms with 539 billions of outstanding shares in 2005 (see Table II). The numbers are increasing every year. Therefore, it is impossible for investors to invest in every single stock. In general, most investors only study a small subset of the available securities and these subsets usually differ across investors (Merton, 1987).
Thus, investors choose stocks based on the information which they have most easy access to and also based on their own constraints related to their own backgrounds. Investors with various backgrounds will have different preferences over the stocks they trade. It is interesting to investigate their preference structure.
There are a number of studies that examine the institutions’ holding preferences for certain stock characteristics when choosing security portfolio. However, very few studies investigate the stock trading preferences of individual investors. To the best of our knowledge, none of the existing research about Taiwan stock market has examined whether investors with different characteristics will have different preferences of trading over stocks with various characteristics.
The number of individual investors is growing and accounts for a high
proportion of stock trading in Taiwan Stock Exchange. Therefore, it is essential for both academics and practitioners to understand their trading preferences. Such research can provide many useful results with policy implications. First, it can provide firms with crucial information regarding the characteristics of stocks that investors with certain backgrounds are most interested in. Hence, firms wishing to attract trading activities and liquidities can reinforce the performance about these aspects and provide such information to the public. Second, by understanding the stock preferences of various investors, security brokerage firms will be able to form a strategic plan to deal with various types of investors in order to promote trading. Third, such analysis can provide essential information to the stock exchanges for the establishment of a better standard for listed companies. The stock exchange can tailor the standard of listing to accommodate investors’ trading preference such that the liquidity of stock markets can be greatly improved.
2. Research Objectives
Investors, whether they are institutions or individuals, all exhibit various specific preferences when deciding their own equity portfolio. For example, institutional investors may prefer stocks with international visibility, large market capitalization, or high volatility. On the other hand, individual investors may tend to invest in stocks with low market prices, small market capitalization, or high liquidity. Therefore, the objective of this thesis is to examine whether the trading activities of various investors in Taiwan equity market show any preferences for certain stock characteristics. Namely, we want to know which elements of firms will induce investors to trade and what are the possible reasons for them to do so.
We classify the factors which affect the portfolio choices of investors
into two parts. One is “stock characteristics”, and the other is “investor
features.” Stock characteristics refer to the firm-specific characteristics
such as EPS, dividend yield, and market-to-book. Investor features are the
characteristics of investors such as gender, wealth levels, and trading
frequency. Besides, the two sets of characteristics may have interaction
effects on the stock trading preferences of investors. For example,
individual and institutional investors may have different preferences for
stock characteristics. Thus, this thesis tries to investigate whether various types of investors in Taiwan stock market shows different stock preferences.
The existing studies which investigate the investors’ stock preference- related studies mostly almost use the regression analysis as the method to identify key preference drivers. However, with the development of computerized techniques, data mining is another commonly used technique to classify investors with various trading preferences. Moreover, it has been proved that data mining applications are highly effective in addressing many important business problems (Apte et al., 2002). To the best of our knowledge, none of the existing studies uses data mining techniques as the methods to examine trading preferences of stock investors. In our thesis, we use both statistical regression and data mining methods to find whether investors show specific preferences for certain stock characteristics. We will compare the results of these two different methods in this study.
The remainder of this thesis is organized as follows. The next chapter
provides a brief review of related studies in the existing literature. Chapter
3 contains a detailed description of the data set and the variables we
employed. Besides, we also present the construction of methods used to do
the empirical analysis. Chapter 4 reports the empirical results and related
analyses. The final chapter summarizes the thesis and provides directions
for future work.
Literature Review
1. Investor Preferences for Stock Characteristics
For stock investors, there are too many stocks to invest in every single stock. Thus, they have to choose which stock can make them profitable.
However, the information investors can obtain is usually incomplete (Merton, 1987). Therefore, on the basis of their background, knowledge, and limitation, investors have different trading preferences. There have been a multitude of studies examining the trading preferences of stock investors. From these studies, we can gain some information about different preferences of investors in various countries.
(2) Domestic Institutional Investors
Falkenstein (1996) documents for the first time several specific U.S.
stock characteristics that mutual funds prefer. By using a comprehensive data set on open-end mutual fund portfolio holdings for the years 1991 and 1992, he finds that the share price level, volatility, liquidity, news, age, size, and idiosyncratic volatility are all important determinants of mutual fund holdings. Among the determinants, the mutual funds have a significant preference for stocks with high visibility, and low transaction costs, and are averse to those with low idiosyncratic volatility.
Gompers and Metrick (2001) analyze the institutional investors’
demand for stock characteristics. In their study, they focus on the institutional investors that have at least $100 million under management.
By using the quarterly data from 1980 to 1996 drawn from the filings of the SEC, they find that large institutions prefer to invest in stocks with large size, high liquidity, and low past returns. Over the sample period, the institutional investors tend to increase demand for the stock of large companies and decrease demand for that of small companies.
Using data on Latin American mutual funds during the Asian and
Russian currency crises, Elkinawy (2005) examines whether the mutual
fund portfolio holdings of a firm’s stock are influenced by specific firm
characteristics associated with incomplete information, financial health,
competition, and governance. The result suggests that during crises, fund
managers increase their holdings of cross-listed firms and ADRs, and reduce the holdings of firms competing with Russian’s main exports.
Besides, liquidity, trade links and governance concerns are important determinants of stock choices of mutual fund managers during crises.
(2) Foreign Institutional Investors
By using a data set on equity ownership, which enables them to compare and contrast foreign ownership with other domestic investor categories, Dahlquist and Robertsson (2001) examine the trading preferences of foreign investors in Swedish. They find that foreign investors show a preference for large firms, firms that pay low dividends, and firms with large cash positions on their balance sheet. Further, they analyze why the foreign investors prefer large firms. Then, the result shows that market liquidity appears to be the main driving force for this tendency.
The evidence indicates that foreign ownership relates to the firm’s visibility in the international markets, either through export sales or listings on other exchanges. Moreover, foreign investors seem to have the tendency toward firms with a widespread ownership. These characteristics are most likely to be reached by large firms. The origin focus of the study of Dahlquist and Robertsson is the foreign institutional investors. However, in order to investigate whether the preference for large firms is a pure foreigner bias to that of domestic institutional investors, they do the research with regard to domestic investors. Interestingly, they find that the trading preference for large firms is common to all institutional investors.
Using a unique data set of mutual fund holdings, Covrig et al. (2006)
identify several similarities and differences in the stock preferences of
domestic and foreign mutual fund managers from eleven developed
countries. They find that domestic managers prefer firms with high market-
to-book ratio, large dividend yield, and high turnover ratio. Foreign
managers tend to invest in firms with large market capitalization, and high
turnover. Besides, foreign funds have a strong preference for stocks with
great investor recognition and worldwide visibility. In particular, the study
shows that foreign mutual funds are positively associated with wider
analyst coverage, larger experts, and firms that are listed in other
exchanges. However, there are also some similarities between domestic and
foreign funds. The result indicates that both groups of mutual fund
managers prefer stocks with high return-on-equity, large turnover, and low return variability. Finally, they document that in general, the differential stock preferences of domestic versus foreign fund managers are driven by their different investment mandates.
Aggarwal et al. (2005) examine the investment choices of actively managed U.S. mutual funds in emerging market equities after the market crises in the 1990s. By using the mutual fund sample which allows them to isolate the role of countries’ and firms’ governance policies on foreign investment decisions, they analyze the country-level and firm-level disclosure and institutional policies that affect mutual funds’ investment choices in thirty emerging markets. The result shows that regarding the country-level policies, the U.S. mutual fund investment is positively associated to better accounting disclosures, greater shareholder rights, and stronger legal framework. As for firm-level policies, the U.S. mutual fund investment has the tendency toward firms with the issuance of ADRs and greater accounting transparency, such as better accounting and disclosure policies. The finding highlights the importance of high quality of accounting disclosures in attracting foreign institutional investment in U.S.
Kang and Stulz (1997) use the data of foreign stock ownership in Japan from 1975 to 1991 and investigate the determinants of security holdings.
They find that foreign investors in Japan have the tendency to invest in firms with large size, low undiversified risk, low leverage, good accounting performance, and firms in the manufacturing sectors. By considering different firm sizes, the result suggests that small firms that export more will gain greater foreign ownership, and that there is no evidence that foreign ownership is associated with expected returns of the stock.
(3) Comparison of Individual vs. Institutional Investors
Barber and Odean (2004) propose a model of decision making in
which investors faced with many choices of stocks consider primarily those
that have attention attracting qualities, and they test the model in the
context of common stock purchases. They test for attention-based buying
behavior by sorting stocks on events that have the possibility to catch
investors’ attention. Thus, they sort the stocks based on the following
methods: (1) sorting on abnormal trading volume, because heavily traded
stocks surely attract investors’ attention. (2) sorting on extreme one-day returns since these stocks are likely to coincide with attention-grabbing events. (3) sorting on whether or not the firm is in the news. The result indicates that individual investors display attention-based buying behavior;
namely, they have the preferences for stocks with high visibility. However, the investment choices of institutional investors in their sample do not show this preference.
Grinblatt and Keloharju (2001) employ Logit regressions to identify the determinants of buying and selling stock transactions by using a unique data set that allows them to monitor the trading of individual and institutional investors in the Finnish stock market. With a variety of tests, the result shows that the trading behavior of investors is affected by the firm’s past returns, the size of the holding period capital gain or loss, and the firm’s historical price patterns, such as being at a monthly high or low.
Besides, the investors have the tendency to engage in tax-loss selling activity. Among the factor of the firm’s past returns, it is much more significant for positive past market-adjusted returns than for negative past market-adjusted returns. Moreover, in small extent, the life-cycle considerations also account for some of the trading. Investors tend to sell stocks early in life, buy stocks in the prime earning years of middle age, and then sell them in old age.
In the research of investors’ preferences, Ng and Wu (2006) employ a
data set that contains detailed trading records made by individual and
institutional investors during April 2001 to April 2002, and they partition
the individual investors into five groups based on their wealth levels. They
find that investors with different wealth levels display different stock
preferences. The wealthier investors tend to invest in the stocks with high
liquidity, high volatility, low book-to-market, greater state-ownership, and
better past performance. On the other hand, the less wealthier investors
prefer to choose the stocks with high betas, low price, low earnings-per-
share, high liquidity, smaller market capitalization, and poorer past
performance. As for institutional investors, the study finds that they invest
more in firms with high idiosyncratic risk, high earnings per share, large
price, large market capitalization, and shorter listing periods.
2. Analysis of Investor Characteristics Affecting Security Portfolio Preference
There are also some existing studies investigating the features of investors that make them show tendencies for some specific trading behavior. In the following, we present some studies with regard to the features of investors applied in our study.
(2) Gender
Psychological research indicates that men are more overconfident than women in some areas such as finance. Therefore, the theory predicts that men will trade more excessively and perform worse than women, because they overestimate the precision and reliability of their information and thereby the expected gains of trading. Barber and Odean (2001) test the theory by partitioning investors on gender. They investigate the common stock investments of men and women from February 1991 through January 1997 by using account data from a large discount brokerage. Then, they document that men are more overconfident than women in accord with the behavioral finance model; namely, men tend to trade more than women.
Dwyer et al. (2002) investigate gender differences in revealed risk taking. They examine whether the gender of investors is related to risk taking as revealed in mutual fund investment decisions by using data from a national survey of mutual fund investors. The result indicates that women are more conservative than men in their recent, largest and riskiest mutual fund investment choices. By using U.S. sample data, Jianakoplos and Bernasek (1998) investigate household holdings of risky assets to determine whether the gender differences will affect the financial risk taking. They find that women exhibit more risk aversion in financial decision making than men. The relative risk aversion declines less for women than men. In addition, they also confirm previous studies which document that relative risk aversion decreases as household wealth increases; however, it reduces by a smaller amount for women than for men.
(2) Wealth
People with different levels of wealth may have different choices of their stock investment and trading volumes. For example, when the wealth increases, investors may commit a higher proportion of their total savings to risky assets, such as stocks to gain greater returns (Cohn et al., 1975).
The study of Ng and Wu (2006) which has been mentioned before analyzes the trading preferences of individual and institutional investors. In the analysis of individual investors, they partition the investors on the basis of their wealth, and the result suggests that the stock preference varies with different levels of wealth. Peress (2004) investigates the differences in households’ portfolios by differences in private information that stem from different wealth levels. Based on the assumption that absolute risk aversion decreases with wealth, but does not take a stand on relative risk aversion, he finds that the demand for information increases with wealth, and investors with greater wealth invest more in stocks. The study shows that the availability of costly information about the stock’s payoff exacerbates wealth inequality. Because more information results in greater returns, wealthier investors acquire more information and make more investments.
(3) Local Preference
People living at different locations may make different choices of securities portfolio because of private information about the firms in the nearby areas or various culture developed by some specific regions. For example, investors living near a firm can visit the firm’s operations, talk to the employees, assess the local market conditions of the firm, and they may have more opportunities to gain private information about that firm.
Besides, investors may feel more familiar with the firms at the same regions at which they are located. Thus, because of these factors investors may have the tendency to invest in the firms at the nearby locations.
Coval and Moskowitz (2001) analyze the geographic link between mutual fund investment and performance by examining the equity holdings of a large sample of actively managed mutual funds. The result indicates that fund managers appear to be able to exploit informational advantages and earn substantial abnormal returns in their investments of nearby stocks.
They document that this information may be the result of improved
monitoring capabilities or access to private information of geographically
proximate firms. Ivković and Weisbenner (2005) examine the impact of geography on individual investors’ common stock investments. By using data of the investments through a discount broker from 1991 to 1996, they find that households exhibit a strong preference for local investments.
Then, they test whether the locality bias stems from asymmetric information or from simple familiarity. The result shows that information asymmetries play the most pronounced role and that individual investors seem to have the ability to process and exploit locally available information to earn excess returns.
In the research of Huberman (2001), he finds that shareholders of a Regional Bell Operating Company (RBOC) tend to live in the area which it serves, and that the customers of RBOC prefer to hold its shares. After analyzing the behavior of shareholders of RBOC, Huberman documents that the geographic distribution of shareholders of RBOC demonstrates the propensity to invest in the familiar. The study suggests that people tend to invest with the firm they know and concentrate their portfolios on the stock they are familiar with, such as stocks of their own company, stocks of firms that are visible in their lives or stocks discussed favorably in the media.
(4) Experience
Chen et al. (2004) examine how the accumulated investing experience affects investors’ trading behavior by using the brokerage account data from China. They find that more experienced investors are more likely to make trading mistakes (i.e., the stocks they sell outperform the stocks they purchase. Besides, investors with more experience tend to exhibit the disposition effect, and suffer from representativeness bias (buying stocks that are recent short-term winners).
3. Data Mining
(2) Data Mining: A brief explanation
There are many complicated systems bearing huge amount of data and
parameters. Besides, they usually have non-predictable and chaotic
behavior. To reveal interrelations among the data and parameters, a number
of new methods of computer analysis have been developed. One useful tool
for discovering the relationships among parameters is data mining.
Data mining has been defined in various ways. In summary, data mining can be explained as follows (Jones, 2001, pp.665):
“The search for relationships and global patterns that exist in large databases but are ‘hidden’ among the vast amounts of data.”
“The semi-automated process of extracting previously unknown, potentially useful and interesting knowledge from large and often disparate, historical data sources.”
The objective of data mining is to find valuable information from the vast amounts of data. Thus, it can help the managers to make more useful and precise decisions. The main difference between statistical analysis and data mining is that the former is based on hypothesis and verification.
Statistical analysis tries to find the relationships on comparatively less data or to analyze different targets on statistics. On the other hand, the basis of data mining is discovery, and it focuses on pattern identification.
(2) Models of Data Mining
The models of data mining are mainly composed of four types: data classification, data association, data clustering, and sequential pattern mining. Data classification is supervised learning, and its function is to analyze the attributes of data, and then to classify and define the data to establish classes. One example of data classification is the analysis of disease causes. The objective of data association is investigating the relationships between data items, and finding the items which have high correlation. Data association is useful on market basket analyses. It aids in understanding the consumption behavior of consumers. As for data clustering, it is unsupervised learning. Data clustering automatically divides the database into several clusters bearing similar features. The objective of it is to figure out the differences between clusters, and it also can find the similarities of the members in one cluster. The differences between clustering and classification is that in clustering, we do not know in advance how many clusters the database will be divided or what features it is based on to partition the data. Therefore, it is essential that we need to interpret the meanings of the divided clusters as the clustering result.
However, data classification maps data into predefined groups or classes.
Hence, it is the prediction of the data pattern. Concerning sequential pattern
mining, it is to analyze changing of the sequence, and try to predict the future condition from the related sequence. For example, from the present quantities of notebooks customers buy, we can estimate the sales of flash drives in order to prepare enough inventories. In our thesis, we use data clustering as the tool to analyze the potential preferences of various investors.
(3) Methods of Clustering
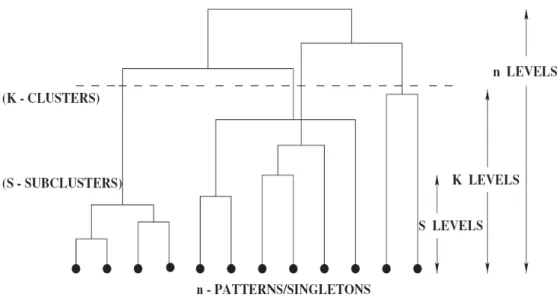
1. The Hierarchical Clustering
The agglomerative hierarchical algorithms are largely used as an explanatory statistical technique to determine the number of clusters of data sets (Anderberg, 1972). Generally speaking, they work in the following way. First, each of the n objects to be clustered is regarded as a unique cluster. Next, the objects are compared among themselves by using a measure of distance, and then the two clusters with the smallest distance are combined. The same process is repeated over and over again until the desirable number of clusters is obtained. In each stage, only two clusters can be combined, and they can not be separated after they are joined. Some popular hierarchical clustering algorithms include single linkage, complete linage, average linkage, Ward’s minimum variance method and so on. The main advantage of hierarchical clustering is that the decision maker can choose the appropriate number of clusters by himself based on his need.
However, although the hierarchical methods work well for data sets with
compact, isolated clusters, they fail to accurately define clusters with messy
data which is depart from the ideal condition (Mangiameli et al., 1995). In
addition, it also has been shown that the performance of any single
hierarchical clustering is dependent on the data conditions, and that no
single method is robust over a wide range of data conditions (Mangiameli
et al., 1995). Furthermore, the objective of cluster analysis is to define
districts in the multidimensional variables rather than compact and isolated
clusters (Helsen and Green., 1991). Because of these problems, we do not
consider hierarchical clustering as the method of data mining in our thesis.
Figure 1: Illustration of a Hierarchical Clustering Algorithm (Vijaya et al., 2006)
2. The Nonhierarchical Clustering
Contrary to hierarchical clustering, the desired number of clusters k has to be defined in advance when using the nonhierarchical clustering.
Then, the nonhierarchical clustering algorithms cluster the n objects into k clusters. In such way, the data in the same cluster own similar characteristics, and the members of different clusters are heterogeneous.
Because the data set in this thesis is messy and large, and some existing studies has shown that the performance of some nonhierarchical clustering methods are better than hierarchical clustering methods. For example, Mangiameli et al. (1995) compare the cluster membership accuracy of self organizing map (SOM) network with the accuracy of seven popular hierarchical clustering algorithms. The result shows that self organizing map neural network clustering methodology is superior to the hierarchical clustering methods. Therefore, we use nonhierarchical clustering to analyze the trading preferences of various investors. Among the methods of nonhierarchical clustering algorithms, we choose self organizing map which is the most widely applied unsupervised learning algorithm of artificial neural network in this thesis.
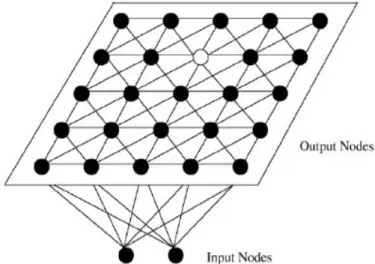
(4) Self Organizing Map
Self organizing map (SOM) proposed by Kohonen (1987) is one
important artificial neural network. The SOM network is trained by an unsupervised competitive learning algorithm, a process of self organization (Mangiameli et al., 1996). It usually consists of an input layer and the Kohonen layer which is designed as two-dimensional arrangement of neurons that maps n dimensional input to two dimensions. Kohonen’s SOM associates each of the input vectors to a representative output. The network finds the node closest to each training case and moves the winning node, which is the closest neuron (i.e., the neuron with minimum distance) to the training case.
Figure 2: Illustration of the Network of 4×4 Kohonen’s Self Organizing Map (Kuo et al., 2002).
Chen et al. (1995) investigates the ability of specific neural network architectures utilizing unsupervised learning to recover cluster structure from multivariate data sets with various levels of relative cluster dispersion.
Their result indicates that the SOM network is the superior cluster technique and that the relative advantage of SOM over conventional techniques such as single linkage, Ward’s minimum variance method and so on increases with higher levels of relative cluster dispersion in the data.
Eklund et al. (2002) evaluate the performance of SOM for analyzing
financial performance of pulp and paper companies. They collect the
financial information and choose several financial ratios of the 77
companies in the pulp and paper industry. Then, they use Kohonen’s SOM
to perform a financial competitor benchmarking of these companies. In
order to verify whether the companies are properly clustered, they confirm
the discovered patterns by reading the annual reports. The result of their
study suggests that SOM is a feasible and effective tool for analyzing huge
amount of financial data.
(5) The Decision Tree
The decision tree is a common data mining technique for knowledge discovery. It organizes and analyzes the data to extract valuable rules and make predictions to provide a basis for model constructions (Dale et al., 2007). The decision tree takes the form of top-down tree structure, which splits the data to create “leaves.” Under the structure, one target class is dominant, and each record flows through the tree along a path determined by a series of tests until it reaches a terminal node (Lee et al., 2007).
Because the decision tree can extract rules of the variables, we use it to further analyze the result of SOM in order to obtain more reliable conclusions. There are various decision tree algorithms, such as CART, C5.0, and CHAID. The differences between these algorithms are as follows: how many splits are allowed at each level, how the splits are chosen when the tree is built, and how the tree growth is limited to prevent over-fitting (Berry and Linoff, 2000). In our thesis, we apply both CART and C5.0 to find the rules.
4. Related Work
Data mining techniques have been applied in many business areas.
Wong and Selvi (1998) review the literature from 1990 to 1996, which applies neural networks in finance, they find that stock performance and selection prediction is one of the most commonly applied areas. Deboect (1998) documents a list of financial, economic, and marketing applications of SOM (see Table III). The following are some existing studies which apply data mining methods in the stock market research.
Table III
Financial, Economic, and Marketing Applications of SOM.
Financial Initial financial analysis
Analysis of financial statements Financial forecasting
Prediction of failures
Rating of financial instruments
Analysis of investment opportunities Selection of investment managers Commercial credit risk analysis Country credit risk analysis Construction of benchmarks Strategic portfolio allocations
Monitoring of financial performance Economic Analysis of economic trends
Forecasting of macro-economic indicators Mapping socio-economic development Knowledge management in economics Marketing Customer profiling and scoring
Analysis of customer preferences Prediction of customer behavior Segmentations of markets
Direct support to strategic marketing (2) Application in Forecasting Stock Market Returns
Enke and Thawornwong (2005) apply data mining to forecast the stock market returns. They propose an information gain technique in machine learning to evaluate the predictive relationships of financial and economic variables. The result indicates that the trading strategies guided by the neural network models produce higher profits under the same risk exposure than those generated by the buy-and-hold strategy. Chen et al.
(2003) use neural networks to model and predict the direction of return in Taiwan stock market. The performance of the forecasts by using neural networks is compared with that guided by the buy-and-hold strategy as well as the investment strategy forecasted by the random walk model and the parametric generalized methods of moments. The results show that the investment strategies based on neural networks obtain better returns than other investment strategies examined.
(2) Application in Knowledge Discovery in Financial Investments
Kuo et al. (2004) apply SOM networks to identify the movement
trends of stocks in Taiwan stock market in order to improve the accuracy of
uncovering trading signals and maximize the trading profits. They provide the decision model to help investors make profitable decisions. Li and Kuo (2006) propose a decision support model to provide the stock investors with systematic trading strategies. The knowledge discovery process they use is composed of feature representation by K-chart technical analysis, feature extraction by discrete wavelet transform, and modeling by SOM networks. Then, they verify the forecasting accuracy by performing experiments using Taiwan Weighted Stock Index from 1991 to 2002. They find that SOM is capable of producing good forecasting accuracies and gain rates.
5. Summary
There are a large number of studies that investigate the trading preferences of stock investors. Most of the existing studies focus on the stock preferences of institutional investors as revealed by the holdings of their security portfolio. However, research on the preferences for stock characteristics of individual investors is relatively lacking. One possible reason is the difficulty of obtaining related data on individual investors (Ng and Wu, 2006). Besides, a lot of studies have examined the stock characteristics that may have significant effects on investors. Nevertheless, only a few of existing studies investigate the features of investors that differentiate the choices of their securities portfolio. More importantly, in Taiwan, to the best of our knowledge, no study has explored the trading preferences of the investors in the stock market and the stock characteristics and investors’ features that impact their choices. Therefore, this thesis aims to figure out the relationships between stock characteristics and stock investors in different dimensions in Taiwan.
Almost every existing study that examines the stock preferences of investors applies the statistical regression analysis to do the research.
Nevertheless, with the progress of computer techniques, a number of new
methods of computer analysis have been developed, and data mining is one
example. Clustering is a useful tool of data mining to partition the data and
assign the members to the groups with closest patterns. Among the
methods of clustering, Kohonen’s self organizing map is widely applied
and recommended by existing studies. Therefore, we apply SOM to do the
research, and compare it with the result of regression analysis to find
whether there are any similarities or differences.
Research Methodology
1. Data
The data set used in this thesis comes from two sources. One is the data of investors’ trading records which are provided by a security firm in Taiwan. This data set contains the basic background information about each investor, such as gender, region, and wealth. The data set also contains the trade records of the investors including trade shares, prices, amount, and dates, time, etc. With the trade records, we can examine the trading behavior of the investors. The other source is the financial dataset provided by Taiwan Economics Journal (TEJ). The main data we use in the TEJ data base are the TEJ Company DB, which includes all financial information contained in the firm’s annual financial statement, and TEJ Equity DB, which records the market-related summary figures of each listed firms, such as P/E ratio, market-to-book, etc.
In our trading dataset, there are 203,092 trading accounts with 18,481,001 trading records between 2004/1/1 and 2004/12/31. We apply the following criteria for data screening:
For investor accounts that exhibit the following features are deleted (93,377 accounts are left for this study):
1. Accounts with null value or errors.
2. Accounts with less than five trading records during our sample period (2004/1/1 ~ 2004/12/31).
Because this thesis aims to investigate the trading preferences of investors, we can not infer much about an investor’s trading preference with only few number of trading records. Hence, in order to make the results more reliable, we only consider the investor accounts with at least five trading records during our sample period.
For stocks with the following features are deleted (after screening, there are 501 stocks left in our sample):
1. The data with null value or errors.
2. The price of the stock has been below $10 during the sample period.
3. The stocks that are not listed or delisted in the Taiwan Stock
Exchange during our sample period.
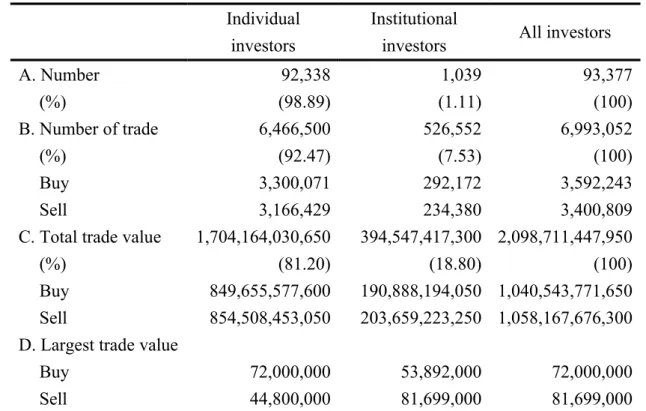
After filtering the data, 93,377 accounts with 6,993,052 trading records for 501 firms are left in our sample. Table IV summarizes the trade records of investors in the data set. The records indicate that the number of individual investors and their trade value are both much larger than those of institutional investors. Thus, individual investors play an important role in stock market, and it again shows that the analysis of their trading preferences is essential for Taiwan Stock Exchange.
< Table IV Inserted Here>
2. The Measure of Trading Preferences
The measure of “trading” preference used in this study is modified from the measure of stock preferences developed by Ng and Wu (2006), which only considers the buy trade of investors because their study focuses on measuring investors’ preference of “holding.” On the other hand, this study analyzes investors’ preference of “trading” and therefore both buy and sell trades are considered for the measurement of trading preference.
The measurement of the trading preferences (
TPij) applied by Ng and Wu (2006) is based on the market value of the stocks. Their model is as follows:
)1 (
, ,
,T
t it
t j j i
i MV
TP F
where
Fi,j,tis the total money flow towards stock i by investor j on day t, and
MVi,tis the market value of the stock i, which is the number of tradable shares of stock i multiplied by its closing price on day t. Ng and Wu’s measure of preference of holding is obtained by dividing the capital inflow by the market capitalization of a firm. However, such measure of preference will under-estimate less-wealthy investors’ preference over stocks with high capitalization. When less-wealthy individual investors pour all his wealth into a high-capitalization stock, it is very obvious that they have great preference over this stock. However, it will be difficult for these less-wealthy investors to obtain high preference measure according to Ng and Wu’s method.
Based on the above discussion, we develop another measurement
method for preference of “trading” which is measured by the number of
trading towards one specific stock by the investor. The larger the number of
trading, which indicates that the investor trade more frequently for the
stock, the greater the investor prefers trading that stock. The measure for trading preference of jth individual over ith stock (
TTPij) is defined as follows:
T
t j
t j j i
i SUM
TTP T,, ()2
where
Ti,j,tis the number of trading (buy and sell trade) toward stock i by investor j on day t, and
SUMjis the total number of trading by investor j during our sample period.
The above trading preference measure is designed to measure the relative tendency for an investor to trade a specific stock. A large value of
j
TTPi
will indicate that the jth investor is relatively more interested in the trading of the ith stock. For each account, there is one trading preference measure for every stock the investor make trading. If the investor invests in a stock more than once, the value of preference calculated from each trading record will be summed to calculate the preference for that stock by the investor. Finally, there are 1,125,383 records left in our sample.
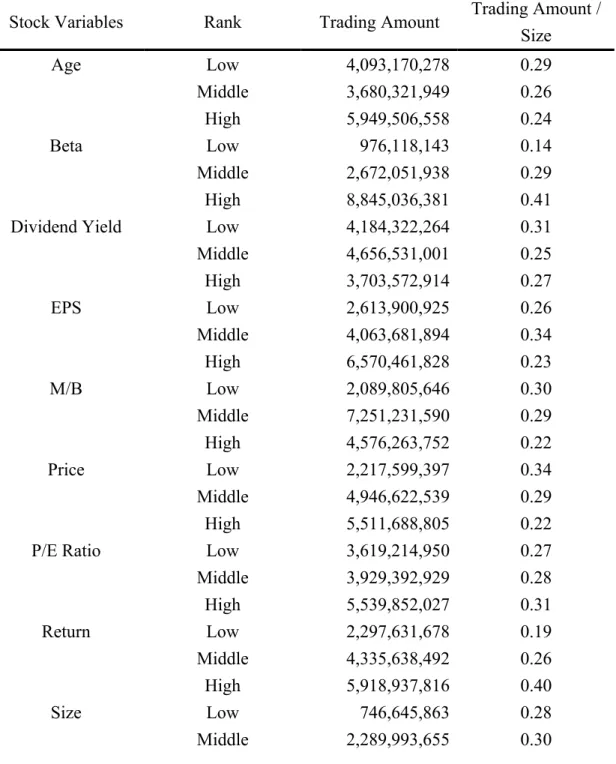
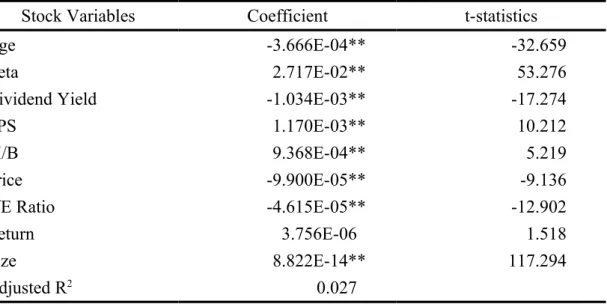
3. Stock Characteristics
Several characteristics of stocks which may affect investors’ trading preference are investigated. The definitions of these stock characteristics are discussed in the following:
Age: The number of years since the stock has been listed. We can examine whether the investors prefer “seasoned” firms or “young”
firms through this variable.
Beta
1: Beta is calculated from the market model which can be obtained directly from the TEJ equity module. Beta represents the market risk of the stock, and it can be used to investigate whether the investors tend to incur more trading for risky stocks.
Dividend yield: Annual dividends per share divided by stock price per
1 The market model used to calculate the Beta is as follows: Rit i iRmt i.
where R is the rate of abnormal return of stock i, it Rmt is the rate of return of the market of the Taiwan Stock Exchange Corporation, i denotes the intercept, i is the systematic risk, which is the common factors that will affect the stock prices of most firms in the market, and i denotes the unsystematic risk, which is the risk specific to each firm. Beta is used to measure the value that stock i is affected by unsystematic risk; namely, the value of .
share at the end of 2003. Investors with different wealth (taxes bracket) or different backgrounds may incur more trading for stock with higher dividend yields.
EPS: The earnings per share of the firm at the end of 2003. EPS is the earnings firms can make in a year, and we want to examine whether the investors’ trading preference is related to EPS.
M/B: The market value over the book value of each firm at the end of 2003. Firms with higher M/B ratios usually refer to so-called “growth stocks” which the market expects to have high growth protential in the future or have large intangible assets such as human caiptal, while firms with lower M/B represents the “value stocks” whose market values are more consistent with their book values. Thus, we can examine whether “growth stocks” or “value stocks” will attract more trading.
Price: The average price of the stock in 2003. In general, stocks with lower prices are more divisible and therefore more affordable for less- wealthy investors. It is interesting to analyze whether investors with various wealth levels may show different preferences of trading for stocks in different price ranges.
P/E ratio: The average closing price divided by EPS in 2003. Similar to M/B ratio, stocks with higher P/E ratios usually have more growth potential in the future. However, it also means that the investors must pay more costs for the stocks. Hence, we want to investigate the impact of P/E ratios on the stock trading of investors.
Return: The annual rate of stock return in 2003. The rate of return is related with the past performance of the stock. Hence, it is interesting to examine whether various investors will have different preference of trading for recent winners vs. recent loser-stocks.
Size: Total market capitalization of the firm as of 2003. Larger size
firms may cause more attention and therefore more news and analysis
will be distributed to market participants. Such attention may cause
more trading in general. However, with constant analysis and news
exposure, the stock price movements may involve less volatility which may discourage certain investors to trade on them.
Table V shows the descriptive statistics for the variables of stock characteristics.
< Table V Inserted Here>
4. Investor Characteristics
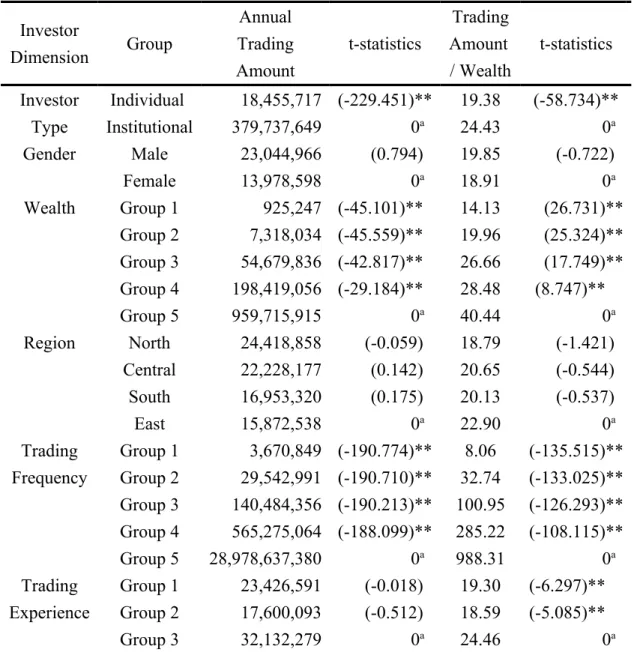
To compare trading preferences for investors with different backgrounds, we investigate the various preference structures for investors with different characteristics. In addition to comparing the trading preferences of institutional vs. individual investors, we select five dimensions about various investors’ backgrounds in our thesis: gender, wealth, region, trading frequency, and trading experience.
(2) Gender
From the number of the identification card of the individual investors in our data set, we can identify the gender of the individual investors. Then we divide the individual investors into two groups based on their gender.
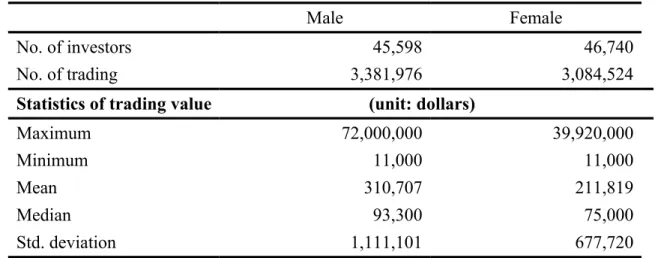
Table VI summarizes the grouping results of the data. We can find that the number of female investors is greater than male investors. However, the trading volume and mean trading value of female investors are both smaller than those of male investors. Besides, the maximum trading value in one stock investment of male is much larger than female. It appears to be in conformity with the existing studies documenting that women are more conservative and invest less than men.
< Table VI Inserted Here>
(2) Wealth
In order to examine whether the investors’ trading preferences will
vary with different levels of wealth, we separate the individual investors in
the data set into five groups. By referring to Ng and Wu (2006), we use the
investor’s maximum trading value in one trading record as the measure of
this investor’s wealth. The larger the trading value in one stock trading the
investor can afford, the greater the wealth he may own. There may be the
problem that the wealthier investors do not invest large amount of money in the stock each time, and that the less wealthy investors may put a high proportion of their property into one stock investment based on the psychology of gambling. However, logically thinking, the possibility of the behavior mention above is relatively smaller. Besides, because of privacy, it is impossible for us to obtain the real and detailed data about each investor’s wealth. Therefore, the maximum trading value in one trading record is the best way we can find to measure the wealth of each individual investor.
First, we find the maximum trading value of each individual investor, and divide the data into five groups: Group W1, Group W2, Group W3, Group W4, and Group W5. Group W1 contains the individual investors with the least wealth, and Group W5 is those with the greatest wealth.
Based on the distribution of our sample, we set the separation criteria as follows: Group W1 is the investors whose maximum trading value lies in between 0 and 100,000, Group W2 is between 100,001 and 1,000,000, Group W3 is between 1,000,001 and 5,000,000, Group W4 is between 5,000,001 and 10,000,000, and Group W5 is those whose maximum trading value is larger than 10,000,000. Table VII presents the statistics for each group. We can find that most of the investors are located at Group W2. In addition, the number of investors in Group W1 and Group W2 accounts for 87.11% of the total, and the number of trading in Group W1, Group W2 and Group W3 is about 86.20%. Thus, the pattern of stock trading in Taiwan is mainly composed of investors with less wealth.
< Table VII Inserted Here>
(3) Region
On the basis of the existing studies, investors located in different
regions may have different trading preferences. Hence, we want to
investigate whether the investors who live in different regions will have
different preferences for stocks with certain characteristics. However, the
area of Taiwan is small, and there are different characteristics between
different regions in Taiwan. For example, the North region of Taiwan is
more urbanized than the other regions, and the differences between the
cities and the countries are large. There are aborigines living in the East
region in Taiwan, and they have their own specific culture and customs.
Besides, they may have different preferences for stock trading. Therefore, in our thesis, we separate the investors based on a broader region instead of being on the basis of cities or districts. After identifying the address of each investor, we partition the individual and institutional investors into four groups: North, Central, South, and East. Table VIII shows the trading data of individual and institutional investors in different regions. Among all of the investors in our sample, about 64.20% of them live in the North region.
Because the North region is the most developed in Taiwan, it is easier for people to receive news and contact innovation. Besides, generally speaking, people lived in the North region in Taiwan are wealthier than the others. Thus, they are more willing to take the risk and make stock investments.
< Table VIII Inserted Here>
(4) Trading Frequency
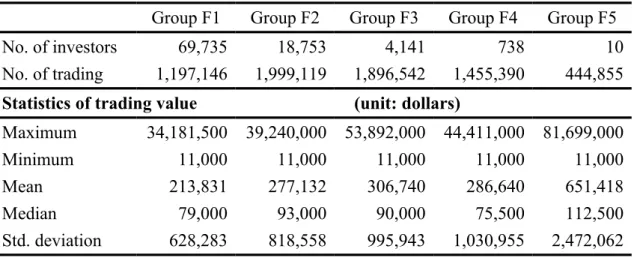
In order to analyze whether the trading frequency has an influence on the stock buying and selling behavior of individual and institutional investors, we separate the investors into three groups based on how often they make the stock trading. There are 5 trading days in a week, and about 250 trading days in one year. Thus, we define that Group F1 contains the investors whose trading frequency is between 5 and 50 (i.e., on average, they make one stock trading in a week.). Group F2 is investors with trading frequency between 51 and 250 (i.e., their trading frequency is about once every day). Group F3 includes investors whose trading frequency is between 251 and 1,000, Group F4 is between 1,001 and 10,000, and investors whose trading frequency is above 10,000 belong to Group F5.
Table IX summarizes the trade records of individual and institutional investors in different groups. We can find that most of the investors make stock trading less than five times in a week.
< Table IX Inserted Here>
(5) Trading Experience
In order to measure the impact of trading experience on investors’
preferences, we use the years of opening the accounts as the proxy because
it can represent the experience of making stock investments. Earlier date of
opening account means longer years of trading stocks, and that the investor
is more experienced. We divide the investors into three groups: Group Y1, Group Y2, and Group Y3. Investors in Group Y1 are the least experienced, and investors in Group Y3 are those with greatest experiences. The grouping criteria are that the investor’s year of opening accounts in Group Y1 is between 1 and 5, Group Y2 is between 6 and 10, and Group Y3 contains investors with experiences in excess of 10 years. Table X shows the trade records of investors in each group. We find that most of the investors are not experienced. It also indicates that stock investors in Taiwan are increasing in recent years.
< Table X Inserted Here>
5. Regression Model
The objective of this thesis is to examine whether the trading activities of various investors in Taiwan equity markets show any preferences for certain stock characteristics. Therefore, to measure the effects of stock characteristics on trading preferences in different dimensions of investors, we develop the regression model as follows:
) 3 ( Re
Pr 7 8 9
6
5 4
3 2
1 0
G i i G i G i G i G
i G i G
i G i G i G G j i
Size turn
PE ice
EPS Dividend
BM Beta
Age TTP
where
TTPijrepresents the trading preferences of investor j towards stock i, and G denotes one investor group, such as male, female, and so on.
We will run the regression by different groups to examine whether investors in one specific group will show preferences for certain stock characteristics. Each group in the study will be implemented the regression respectively. Hence, we can compare the preference differences between various types of investors.
6. Data Mining
(1) Self Organizing Map
In our thesis, we apply the tool of SPSS Clementine 7.0, which is used
for data mining solutions to run the procedures of SOM. To find the
appropriate number of seeds and better performance of SOM, we try two
combinations of seeds in the network. We set the network of SOM as 3×3
and 4×4 respectively, and include all the variables of stock characteristics
and investor dimensions in the procedure. For the network of 3×3 and 4×4, it can produce 9 and 16 clusters at most, but the numbers of total clusters it generate finally are decided by the network. The data we used in the process are the 6,993,052 trading records for 501 firms in our sample.
The investor dimensions included are gender, wealth levels, regions, trading frequency, and trading experience for the institutional investors and individual investors. As to the nine stock characteristics, we divide each variable into three ranks: low, middle, and high. It is difficult to interpret the result if the stock variables contain their own values. By ranking the values of stock characteristics, we can focus and condense the trading preferences of investors over stock characteristics. After the procedure of SOM, it will present the result of cluster distributions. Then, we compare the distribution to examine whether there are proportionately large clusters, which contain the most trade records in the sample. The greater the differences of the proportion between each cluster, the better the performance of the network because it means that there are apparent diversity between the features in the sample. Thus, according to the results, we will select the network with better performance to analyze the trading preferences of investors. Then, we apply the decision tree to further find the rule of our sample.
(2) The Decision Tree
After selecting the network of SOM, we extract the data of the main clusters to do the analyses. The sample distributed in the same cluster own similar features. If the number of sample in one cluster is large, it means the preferences, which inferred from the result are significant. Therefore, we focus the analysis on the primary clusters. We apply SPSS Clementine 7.0 as the tool to run the procedure of the decision tree. Then, we find out the rules of each level in the tree, and select the most significant in each cluster. Hence, we can examine whether there are trading preferences for stock characteristics among the investors. The results by using regression and data mining will be compared to examine whether there are similarities and differences between these two results.
7. The Diagram of Process
The process of our research methodology is as follows:
Original
Data Data
Set
Regression
SOM
Decision Tree
Result 1
Result 2 filtering
comparing