國立臺灣大學管理學院資訊管理學研究所 碩士論文
Department of Information Management College of Management
National Taiwan University Master Thesis
探勘社群網路中內涵式行為角色
Discovering Content-based Behavioral Roles in Social Networks
蔡忻潔 Hsin-Chieh Tsai
指導教授:李瑞庭 博士 Advisor: Anthony J. T. Lee, Ph.D.
中華民國 101 年 6 月
June 2012
探勘社群網路中內涵式行為角色
Discovering Content-based Behavioral Roles in Social Networks
本論文係提交國立台灣大學 資訊管理學研究所作為完成碩士
學位所需條件之一部份
研究生:蔡忻潔 撰
中華民國一百零一年六月
謝辭
大 學 四 年 很 快 就 過 去 了 , 而 兩 年 的 研 究 所 在 不 知 不 覺 中 已 接 近 尾 聲 , 我 即 將 離 開 校 園 , 邁 向 新 的 人 生 階 段 。 感 謝 這 一 路 上 陪 伴 我 的 家 人 、 老 師 、 朋 友 以 及 同 學 們 , 看 著 我 成 長 茁 壯 , 也 為 自 己 的 未 來 寫 上 了 新 的 一 頁 。
首 先 要 謝 謝 我 的 指 導 老 師 李 瑞 庭 老 師 , 在 實 驗 室 的 這 兩 年 裡 , 老 師 不 僅 僅 給 予 我 學 術 上 的 指 導 , 開 明 的 作 風 和 認 真 的 態 度 也 深 深 地 影 響 了 我 , 給 我 足 夠 的 思 考 空 間 , 又 適 時 地 拉 我 一 把 指 引 我 正 確 的 方 向 , 而 不 時 與 我 們 分 享 的 小 故 事 和 人 生 道 理 , 更 是 讓 我 獲 益 良 多 , 能 在 研 究 所 的 兩 年 當 老 師 的 研 究 生 , 真 是 我 最 正 確 的 選 擇 之 一 , 老 師 謝 謝 您 !
接 著 要 謝 謝 我 的 家 人 和 朋 友,爸 媽 的 支 持、哥 哥 的 提 點 、 好 朋 友 的 陪 伴 , 讓 我 在 這 兩 年 裡 過 得 自 在 又 開 心 , 有 時 候 疲 累 不 堪 的 時 候 , 家 裡 永 遠 是 最 溫 暖 並 包 容 我 的 地 方 , 而 好 朋 友 永 遠 是 陪 伴 我 的 依 靠 。
還 有 要 謝 謝 球 隊 學 妹 們 的 貼 心 陪 伴 , 以 及 球 場 上 熟 識 的 貴 人 朋 友 們 , 研 究 所 的 生 活 中 有 你 們 讓 我 總 能 在 研 究 之 餘 開 心 地 運 動 調 劑 身 心 , 為 下 一 個 目 標 養 精 蓄 銳 。
最 後 要 謝 謝 實 驗 室 的 同 學 、 學 長 姐 以 及 學 弟 妹 們 , 謝 謝 一 同 奮 戰 兩 年 的 同 學 們 , 一 起 吃 飯 聊 天 打 球 的 日 子 特 別 讓 人 懷 念,謝 謝 學 長 姐 不 時 地 指 導,謝 謝 學 弟 妹 無 怨 無 悔 地 幫 忙 , 特 別 感 謝 辰 葭 這 一 年 來 的 陪 伴 , 讓 我 這 兩 年 來 能 開 開 心 心 的 走 到 最 後 。
這 篇 論 文 能 順 利 完 成 要 感 謝 的 太 多 , 謝 謝 你 們 。
論文摘要
論 文 題 目 : 探 勘 社 群 網 路 中 內 涵 式 行 為 角 色
作 者 : 蔡 忻 潔 一 百 零 一 年 六 月
指 導 教 授 : 李 瑞 庭 博 士
社 群 網 路 如 F a c e b o o k、 G o o g l e +、 Tw i t t e r, 對 使 用 者 的 互 動 模 式 產 生 極 大 的 影 響 , 角 色 分 析 可 協 助 我 們 了 解 使 用 者 的 互 動 模 式,但 前 人 所 提 出 的 方 法 較 著 重 於 結 構 分 析。就 我 們 所 知 , 目 前 並 沒 有 方 法 使 用 內 涵 式 特 徵 與 行 為 特 徵 分 析 社 群 網 路 的 角 色 , 也 沒 有 方 法 探 討 角 色 轉 換 的 樣 式 。 因 此 , 在 本 篇 論 文 中 , 我 們 提 出 一 個 內 涵 式 的 方 法 分 析 社 群 網 路 中 的 角 色 與 角 色 轉 換 的 樣 式 , 我 們 的 方 法 不 須 事 先 定 義 角 色 型 態 就 能 找 出 所 有 的 角 色 , 且 允 許 使 用 者 扮 演 多 重 角 色 。 我 們 的 方 法 可 更 有 彈 性 地 分 析 社 群 網 路 中 的 角 色 與 角 色 轉 換 的 樣 式 。 實 驗 結 果 顯 示 我 們 所 提 出 來 的 方 法 能 有 效 地 找 出 在 不 同 社 群 中 不 同 的 內 涵 式 行 為 角 色 , 並 可 以 找 出 未 知 的 新 角 色 , 也 可 以 找 出 有 意 義 的 角 色 轉 換 樣 式 。 這 些 結 果 可 協 助 我 們 更 了 解 社 群 網 路 的 發 展 以 及 未 來 趨 勢 , 也 可 協 助 我 們 研 擬 更 有 效 的 管 理 策 略 。
關 鍵 字 : 社 群 網 路 、 資 料 探 勘 、 內 涵 式 行 為 角 色 、 角 色 轉 換 樣 式
THESIS ABSTRACT
Discovering Content-based Behavioral Roles in Social Networks
By Hsin-Chieh Tsai
MASTER DEGREE OF BUSSINESS ADMINISTRATION DEPARTMENT OF INFORMATION MANAGEMENT
NATIONAL TAIWAN UNIVERSITY JUNE 2012
ADVISOR: Anthony J.T. Lee, Ph.D.
Social networks such as Facebook, Google+, and Twitter have made a significant impact on the interactions among users. Role analysis helps us to characterize users’
interactions on a social network. However, previously proposed methods are mainly based on structural analysis of social networks rather than content-based behavior analysis. To the best of our knowledge, there is no method using content-based behavioral features extracted from user-generated content and behavior patterns to identify users’ roles and to explore role change patterns in social networks. Therefore, in this thesis, we propose a content-based method to identify users’ roles and find the role change patterns in a social network. The proposed method doesn’t need to define role types in advance and allow a user to play multiple roles on a social network. Our method provides a more general and flexible way to perform role analyses in social networks. The experimental results show that the proposed method can find various roles in a social network and additional roles that haven’t been previously aware of. It can also discover some interesting role change patterns in different groups. The results may help us better understand the trends and future growth of the social network, and formulate more effective management strategies.
Keywords: social network, data mining, content-based behavioral role, role change pattern
Table of Contents
Table of Contents ... i
List of Figures ... ii
List of Tables ... iii
Chapter 1 Introduction ... 1
Chapter 2 Related Work ... 4
Chapter 3 The Proposed Framework ... 7
3.1 Problem Definition ... 7
3.2 Proposed Framework ... 8
3.3 Discovering Multiple Roles in a Social Network ... 9
3.4 Discovering Role Change Patterns ... 16
Chapter 4 Experiment Setup and Results ... 19
4.1 Data Collection ... 19
4.2 Finding Roles in Social Network ... 21
4.3 Finding Role Change Patterns... 27
4.4 Comparing with the Previously Proposed Method ... 28
4.5 Evaluation of Distance Measure ... 31
Chapter 5 Conclusions and Future Work ... 32
References ... 34
List of Figures
Figure 1. Flowchart of the proposed framework. ... 9
Figure 2. Role distribution in Android. ... 21
Figure 3. Behavior distribution in Android. ... 22
Figure 4. Average recognition in Android. ... 22
Figure 5. Affectivity distribution in Android. ... 23
Figure 6. Role distribution in Obama. ... 23
Figure 7. Behavior distribution in Obama. ... 24
Figure 8. Average recognition in Obama. ... 24
Figure 9. Affectivity distribution in Obama. ... 25
Figure 10. Role distribution in Movie. ... 25
Figure 11. Role distribution in Music. ... 25
Figure 12. Behavior distribution in Movie. ... 26
Figure 13. Behavior distribution in Music. ... 26
Figure 14. Average recognition in Movie. ... 26
Figure 15. Average recognition in Music. ... 26
Figure 16. Affectivity distribution in Movie. ... 27
Figure 17. Affectivity distribution in Music. ... 27
Figure 18. Role distribution in TUAW. ... 29
Figure 19. Behavior distribution in TUAW. ... 29
Figure 20. Average recognition in TUAW. ... 30
Figure 21. Affectivity distribution in TUAW. ... 30
List of Tables
Table 1. An example database. ... 14
Table 2. The distance between each pair of action sequences. ... 15
Table 3. The centroids and membership vectors for each round. ... 15
Table 4. An example database. ... 16
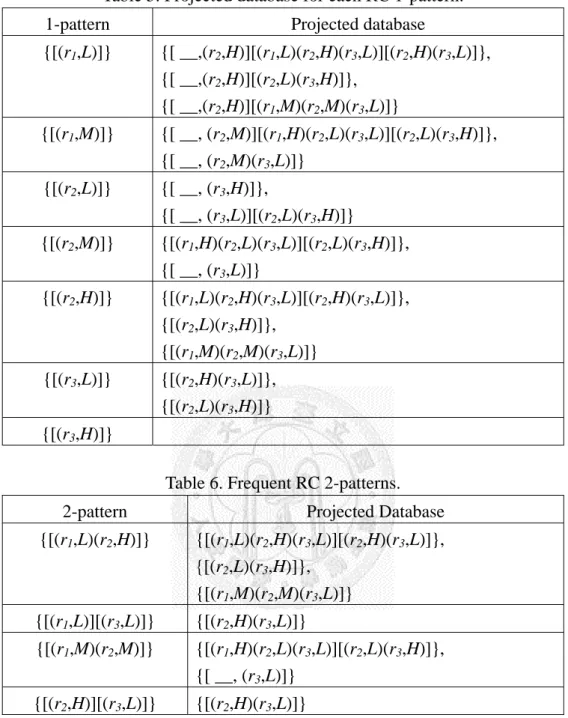
Table 5. Projected database for each RC 1-pattern. ... 17
Table 6. Frequent RC 2-patterns. ... 17
Table 7. Frequent RC 3-patterns. ... 17
Table 8. Categories and group names. ... 19
Table 9. Role change patterns in Android. ... 28
Table 10. Role change patterns in Obama. ... 28
Table 11. Precision of three distance measures. ... 31
1. Chapter 1 Introduction
Online social networking technologies enable users to share information with their friends. Social networks such as Facebook, Google+, and Twitter have made a significant impact on how users share and exchange data. Users join these networks, share opinions, make comments, and interact with their friends. The interactions involve behavior associated with particular roles. Role analysis helps to characterize users’ interactions on a social network.
The concept of a social role is viewed as the behavioral expectations that are associated with identifiable positions in a social structure. What role does an individual play in a group? A user may play her role as a leader, a participant, a commentator, a lurker, or etc. Fournier and Lee [12] pointed out that communities are strongest when everyone plays a role. Members stay involved and add value by playing a wide variety of roles. Akaka et al. [2] mentioned that social roles act as resources for change in value networks because they can lead to social norms and establish social positions. Since social network dynamically changes, roles user playing may change as time goes on. The role change may imply position shifting of users, status switching of participants, behavior transition of people, and etc. Gleave et al. [14] showed that by identifying roles, it would be more effective to monitor some proportions of roles. Also, a better search result can be obtained if the authors of content are considered. Thus, role analysis has long been central to sociology [28][24][6][9], and becomes more and more valuable in many aspects. For example, Many researches [19][20][1][16][31] focused on finding the influential leaders in a social group. Obviously, a more general and flexible framework for discovering significant roles including influential leaders will be necessary and helpful for many applications.
Since the rise of Web 2.0 from early 2000s, content generated by users become increasingly popular and important. Velardi et al. [33] mentioned that communicative content attracts more and more interest from business, social and research community
analysts. Naaman et al. [26] pointed out that interesting and informative content is the key to increase amount of readers. McCallum et al. [23] presented the Author-Recipient-Topic (ART) model for social network analysis. ART combines the connectivity structure and probabilistic language model to capture topics, find social roles and summarize a large amount of data. Through analyzing the content created by users, we can get better understand the characteristics of users and behavior between users.
Previously proposed methods are mainly based on structural analysis of social networks rather than content-based behavior analysis. Most of them classify the users in social networks into pre-defined roles and do not consider the dynamic characteristics in social networks. To the best of our knowledge, there is no method using content-based behavioral features extracted from user-generated content and behavior patterns to identify roles without using any pre-defined roles and to explore role change patterns in social networks.
Therefore, in this thesis, we propose a content-based behavioral method to analyze the roles and role changes in social networks. Unlike previous studies, we combine content-based and behavioral features to discover roles in social networks.
The features provide us a better view to analyze users’ roles. Our proposed method first extracts the content-based behavioral features for each user, and then utilizes fuzzy c-means clustering method (FCM) [5] to identify different roles in a social group. Next, it transforms the results obtained from FCM into role change sequences, and applies PrefixSpan [29] to discovering role change patterns. The proposed method can find various roles in social networks without using any pre-defined roles and may discover additional roles that haven’t been previously aware of. Using the concept of fuzzy set to record user’ role memberships provides us a flexible way to identify multiple roles played by the user in a social network. Moreover, content-based behavioral features provide valuable information of users and better understand users’
behavior.
The contributions of this thesis can be summarized as follows. First, we propose a framework to identify various roles in social networks. Next, we present an approach to mine role change patterns. Finally, the experimental results show that the proposed method can find various roles and role change patterns in different kinds of social groups. There are six roles in a technology group: expert, kicker, leader, viewer, participant and follower; three roles of opposite political positions in a political group:
supporter, dissenter and neutralist; and three roles in entertainment groups: creator, commentator and participant. We also discover some interesting role change patterns in different groups. In the technology group, users may shift their roles from viewer to leader since they learn more and more expertise from the fan group so that their recognition increases with time. In the political group, users shift their roles from positive supporter to negative dissenter or neutralist with higher negative affectivity. It may be a warning sign for the politician.
The rest of this thesis is organized as follows. Chapter 2 surveys the related work.
Chapter 3 describes the problem definitions and our proposed framework. Chapter 4 evaluates the proposed framework. Finally, the conclusions and future work are described in Chapter 5.
2. Chapter 2 Related Work
Role analysis has long been central to sociology. Callero [9] mentioned that roles are assumed to be real, objective, meaningful features of the social world. Many studies focused on using structural features to identify different roles. Golder [15]
combined qualitative and quantitative methods to develop a typology of social roles, including ethnographic study and statistical analysis of participation to determine different roles. Turner et al. [32] categorized newsgroups, authors, and threads in terms of their patterns of activities in Usenet. They presented a series of visualizations showing newsgroup hierarchies, newsgroup populations, authors, and conversation threads of Usenet newsgroups and user activities. They also identified some characteristic patterns from users’ posting behavior and classified users into different roles such as answer person, questioner, troll, spammer, binary poster, flame warrior, and conversationalist. Fisher et al. [11] presented a method to find second-degree ego-centric networks by the patterns of replies in Usenet Newsgroups. Welser et al.
[35] used visualization methods including authorlines, neighborhood networks and degree distribution charts to reveal structural signatures used to describe the characteristics of a social role. Skopik et al. [30] proposed a method to determine trust relationships between users and performed structural analysis to infer social roles.
Morzy [25] presented a model for social role discovery with statistical analysis and network analysis in internet forums. Wu and Chen [37] developed a systematic framework to classify users into four types of users such as posting picture user, literary user, commenting user, and quickly-re user who always gives a quickly response to other users. Welser et al. [34] used structural signature methods to identify four key roles in Wikipedia, namely, substantive expert, technical editor, vandal fighter and social networker.
For behavior-based analysis, IX survey [17] conducted a survey and classified social network members into six roles according to their involvement, namely, creator, discussant, commentator, sharer, participator and viewer. Jamali et al. [18] used a
classification and regression framework to study behavioral characteristics of users.
Benevenuto et al. [3] provided a clickstream model to characterize user activities in online social networks. Welser et al. [36] analyzed messages sending behavior in Q&A systems, and tried to find the experts. Zhu et al. [38] presented a behavior-based clustering approach to identify roles in a telecommunication network.
By pre-specified roles, a few content-based methods have been proposed for role analysis. Garg et al. [13] combined lexical features and structural interaction features to automatic recognition of different speaker roles, including project manager, marketing expert, user interface expert, and industrial designer. Bodendorf et al. [7]
presented a text mining approach to detect opinion leaders and opinion trends.
Naaman et al. [26] analyzed the messages posted by Twitter users and developed a content-based examination for users’ activities.
To analyze different roles in various social media, Fisher et al. [11] presented a method to find second-degree ego-centric networks by the patterns of replies in Usenet Newsgroups. Benevenuto et al. [4] provided a characterization of social and content attributes to classify Youtube users into three roles as spammer, promoter, and legitimate. Maia et al. [22] proposed a method for characterizing user behaviors in an online social network. They used specific features of Youtube and interaction features to cluster similar behavioral patterns. Welser et al. [34] used structural signature methods to identify four key roles in Wikipedia, namely, substantive expert, technical editor, vandal fighter and social networker. Fazeen et al. [10] proposed two methods for classifying the roles in Twitter into leader, lurker, spammer and close associate.
An important issue in role analysis is to find the influential leaders in a social network. Kempe et al. [19] presented a provable approximation to choose a good influential set of individuals to maximize the spread of influence in a social network.
Then, Kempe et al. [20] defined a natural and general model of influence propagation, decreasing cascade model, to solve the target set selection problem. Goyal et al. [16]
introduced a frequent pattern mining approach to discover leader and tribes in a social
network. Trusov et al. [31] developed a Bayesian shrinkage approach to identify influential nodes in a social network, and implemented a Poisson regression model to estimate the users’ influence. Agarwal et al. [1] presented a preliminary model to quantify influential bloggers and built a robust model to find various types of influential bloggers.
Unlike the previously proposed methods, we utilize content-based features and behavior-based analysis to identify user’s roles without defining role types in advance.
In addition, by introducing the concept of fuzzy sets to the proposed method, we allow a user to play multiple roles in a social network, not limited to just one.
3. Chapter 3 The Proposed Framework
In this chapter, we describe the problem definition and propose a framework to identify the roles in a social network and analyze role change patterns. The proposed framework contains two phases for role analysis. First, we modify the fuzzy c-means algorithm to cluster together users with similar characteristics and identify social roles in different social groups. Next, we propose an approach to find the role change patterns and use them to analyze users’ behavior characteristics.
3.1 Problem Definition
A social network contains a number of users, where users may perform actions and create content. By analyzing the behavior and content generated by users in the social network, we can find users’ roles and role change patterns.
Definition 1. Let SR={r
1,r2,…,rn} be a collection of roles in the social network.Every role is distinct from each other and exhibits a particular behavior characteristic.
A user may play multiple roles in the social network. The membership MS to each role for the user can be classified into a finite number of degrees, where 0≦MS
≦1. For example, the membership is classified into three degrees by Eq.(1).
=
, ∈ (0,0.25) , ∈ [0.25, 0.75)
, ∈ [0.75, 1 (1)
Definition 2.
Let a role-degree pair (RD pair), (r1,d1), denote that the degree of membership to role r1 is d1. The roles played by a user in a certain period of time are denoted as a roleset, a set of RD pairs. The roles played by the user in several periods of time can be represented by a sequence of rolesets (roleset sequence). For example, the roles played by user A in the first period of time can be denoted as [(r1,M)(r2,L)(r3,L)], where A plays r1 with degree M, r2 with degree L, and r3 with degree L. A sequence {[(r1,M)(r2,L)(r3,L)][(r1,H)(r2,L)]} represents the roles played byA in the first two periods.
Definition 3.
A roleset contains another roleset if every RD pair in the latter can befound in the former.
Definition 4.
A roleset sequence contains another roleset sequence if every roleset in the latter is contained by a roleset in the former, and those rolesets in the former appear in the same order as these in the latter.Definition 5. A role change pattern (RC pattern) of length k is called an RC k-pattern,
where the length of an RC pattern is defined as the number of RD pairs in it.
Definition 6. A RC pattern is frequent if its support is not less than the minimum
support threshold, where the support is defined as the fraction of roleset sequences containing the pattern in the database.
For example, a pattern {[(r1,H)][(r1,M)(r2,M)][(r1,L)(r2,H)]} denotes that users play r1 with degree H, shift to play r1 with degree M and r2 with degree M, and then shift to play r1 with degree L and r2 with degree H.
The role appearing most frequently in a social group is called a main role. The main role can help us to understand the major composition of a group. The role appearing only once is called a special role. The special role can help us to detect some special events.
3.2 Proposed Framework
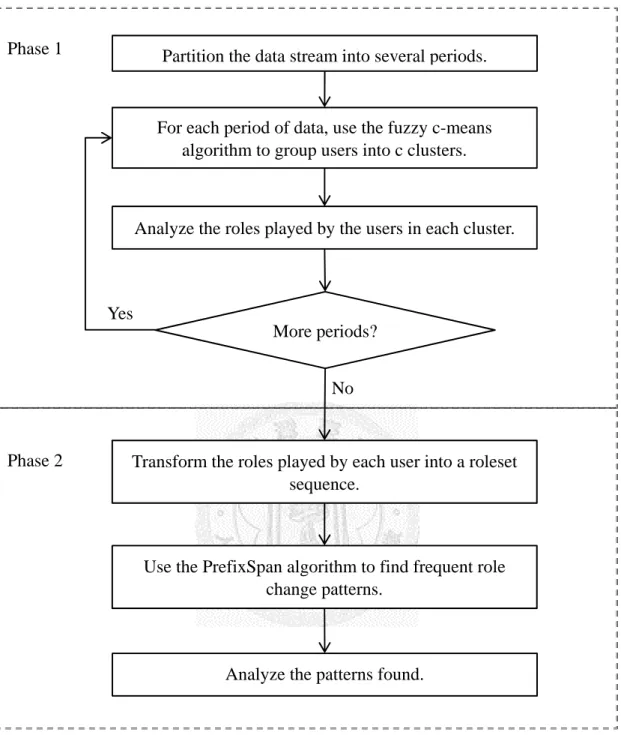
The proposed framework is shown in Figure 1. There are two phases in our framework. In phase 1, we first partition the data stream into several periods (ex. one month per period). For each period of data, we employ the fuzzy c-means algorithm to group users into c clusters and identify the roles played by the users in each cluster. In phase 2, we transform the roles played by each user into a roleset sequence. Next, we apply the PrefixSpan algorithm to find frequent role change patterns and analyze the patterns found.
Figure 1. Flowchart of the proposed framework.
3.3 Discovering Multiple Roles in a Social Network
3.3.1 Distance measuresWe use two distance measures to compute the distance between two feature vectors, namely, cosine and Euclidean. The cosine distance is defined by Eq. (2) while the Euclidean distance is defined by Eq. (3), where V1
= (v
11, v12, …, v1k) and V2=
(v21,v22, …, v2k) are feature vectors. The cosine distance is a distance measure betweenPhase 1
For each period of data, use the fuzzy c-means algorithm to group users into c clusters.
Analyze the roles played by the users in each cluster.
Phase 2 Transform the roles played by each user into a roleset sequence.
More periods?
Yes
No
Use the PrefixSpan algorithm to find frequent role change patterns.
Analyze the patterns found.
Partition the data stream into several periods.
two vectors based on the angle between them. The major limitation of cosine similarity is that it is not good for sparse data and cannot effectively handle outliers co-aligned with other normal vectors. Thus, we use the Euclidean distance as well to measure the distance between two vectors.
( , ) = 1 − ∙
‖ ‖‖ ‖ (2)
( , ) = ( − ) (3)
3.3.2 User properties
We use five types of attributes to describe the properties of users.
(1) Personality (PE)
The personality feature is the basic information in a social network. We choose the features including number of friends, number of posts in his/her own wall and privacy setting (0: public, 1: private, 2: secret) that may reflect the characteristic of users. Thus, the personality feature vector is denoted as PE = (number of
friends, number of posts, privacy). We compute the distance between two
personality feature vectors by the cosine distance. For example, the distance between two personality feature vectors (200, 300, 1) and (1000, 500, 2) is1 −√ ∙ ∙√ ∙ ∙ = 0.132.
(2) Behavior (BE)
We extract data which records the user’s actions including post, comment, and like. The behavior feature vector for a user is denoted as BE = (number of posts,
number of comments, number of likes). In order to distinguish both the behavior
distribution and behavior frequency, we take the cosine and Euclidean distances into consideration. For example, the cosine distance between two behavior vectors (500,10,1000) and (50,1,100) is 0 (behavior distribution); however, their behavior frequencies are obviously distinct. That is, we define the distance between two behavior feature vectors, BE1 andBE
2, asCD(BE
1,BE2)⋅ED(BE1,BE2). Then, the distance is normalized into [0,1]. For example, the distance between two behavior feature vectors (30, 3, 0) and (10, 5, 30) is 1 −√ ∙ ∙ ∙∙√ ∙ ( ) ( ) ( ) = 0.487 , where
50 is the maximum Euclidean distance among all behavior feature vectors and used to normalize the distance into [0,1].
(3) Action sequence (AS)
The actions taken by a user may reflect the different post modes of the user in a group. For example, a user who frequently posts statuses to express her feelings is different from another user who usually shares photos to others. We record user’s actions as an action sequence, denoted as AS = {a1, a2, …, ak}, where ai is a type of posts, i=1, 2,…, k. The types of posts are s(status), l(link), p(photo), and
v(video). For example, {s, l, l, v} is an action sequence. We define the distance
between two action sequences by Lev(AS1, AS2) and then the distance is normalized into [0,1], where Lev(AS1, AS2) is the Levenshtein distance [21], also known as edit distance, between AS1 and AS1. For example, the Levenshtein distance between a sequence AS1= {s, l, l, v} and AS
2= {s, l, l, p, s} is 2 because
two operations are required to modify AS1 into AS2 by replacing v to p and appending s to AS1.(4) Affectivity (AF)
Analyzing the emotion in the articles generated by a user can discriminate user’s implicit attitude. For example, a politics group generally has supporters and opponents. By analyzing the emotion in articles, we can detect users having similar behavior but standing on different positions. The affective norms for English words (ANEW) [8] have been developed to provide a set of normative emotional rating for a large number of English words. Nielsen [27] evaluated 2477 English words used in microblogs and rated them with a score between -5 and 5. We use these words to calculate user’s affectivity. The calculation steps are listed as follows.
a. Sum up all positive and negative scores in a post.
b. Divide total positive and negative scores by the length of the post.
c. Normalize the scores by multiplying each score by the average length of posts.
Thus, an affectivity vector is denoted as AF = (positive score, negative score), which represents the average positive and negative affective scores in a post for each user. Next, we use the cosine distance to compute the distance between two affectivity vectors.
(5) Recognition (RE)
We also take recognition into account. Recognition in sociology is public acknowledgement of person’s status or merits. By analyzing the users’
recognition accumulated in a social group, we can find the influential users whose posts are more respected by or attracted to other users. We take three features into consideration. The first is the number of comments obtained from other users, which shows the topicality or attraction of user’s posts. The second is the number of posts shared by other users. The third is the number of likes obtained from other users, which implies the acceptance or usefulness of user’s posts. It may reveal the value and influence of the user. Thus, the recognition feature vector is denoted as RE= (number of comments from other users / number
of posts, number of posts shared by other users / number of posts, number of likes obtained from other users / number of posts). We define the distance between two
recognition feature vectors, RE1 and RE2, by CD(RE1,RE2)⋅ED(RE1,RE2). Then, the distance is normalized into [0, 1].Therefore, a content-based behavioral feature vector of each user is formed by concatenating personality, behavior, action sequence, affectivity, and recognition feature vectors together. The distance between two content-based behavioral feature vectors (or two users) is computed by
α D
PE+β D
BE+γ D
AS+δ D
AF+η D
RE, where DPE,D
BE, DAS, DAF and DRE respectively denote the distances between the personalityfeature vectors, the behavior feature vectors, the action sequences, the affectivity feature vectors and the recognition feature vectors of the two users, and
α
+β
+γ
+δ
+η
= 1. Similarly, the distance is normalized into [0,1].3.3.3 Exponential decay
The behavior, affectivity and recognition features obtained in the previous periods can be accumulated into those in the current period; however, they may decay with time. We use an exponential decay function to adjust these features as shown in Eq. (4), where Ft is the adjusted feature vector in period t, ft is the feature vector in period t, Ft and ft can be one of behavior, affectivity and recognition feature vectors in period t, and
ω
is a decay parameter. But, personality feature is static and does not decay with time. That is, the number of friends, number of posts and privacy setting don’t decay with time. Similarly, the action sequence feature doesn’t accumulate with time.F
t =ω‧ F
t-1 + ft (4)3.3.4 Fuzzy c-means clustering
Users in a social group may not play just one role. For example, in Android fans, users can post related information (news link, videos, photos, etc.), make comments to discuss with other users, and click “Like” button to follow leader’s posts. Thus, we employ the fuzzy c-means clustering algorithm (FCM) [5] to cluster together the users with similar features, where each user is represented by a content-based behavioral feature vector.
FCM classifies feature vectors X={x1, x2,…, xn} into c clusters
= , , … , by minimizing the objective function shown in Eq. (5), where is the membership of feature vector xj to cluster , n is the number of feature vectors,
m
∈[1,∞) is a weight controlling degree of fuzziness, ci is the centroid of cluster ,∑ = 1, i=1,2,…, c, j=1,2,…,n.
= ( , ) (5)
The steps of FCM are shown as follows, where c is the number of clusters and m is the degree of fuzziness.
1. Randomly select c cluster centers, update
μ
ij of xi belonging to cluster fori=1,2,…,c by Eq. (6)
= ( , )
( , )
( )
⁄
(6)
2. Compute the cluster centroid ci for i=1,2,…,c by Eq. (7).
=∑ ( )
∑ ( ) (7)
3. If the improvement to the objective function Jm is greater than a threshold
ε
, go to step 1; otherwise, stop.After grouping users into clusters, we compute the membership to each centroid for each user. Thus, each user is represented by a membership vector, denoted as
MV=[e
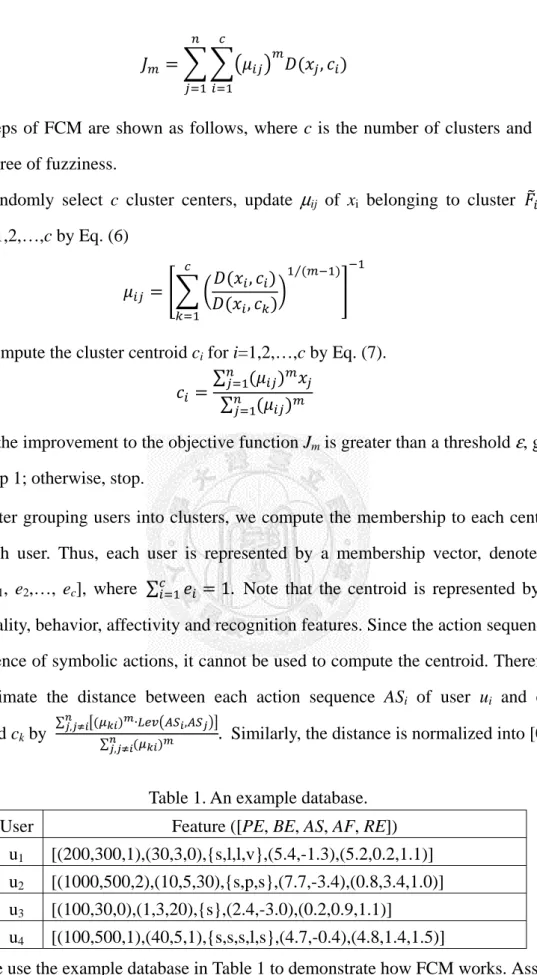
1, e2,…, ec], where ∑ = 1. Note that the centroid is represented by the personality, behavior, affectivity and recognition features. Since the action sequence is a sequence of symbolic actions, it cannot be used to compute the centroid. Therefore, we estimate the distance between each action sequence ASi of user ui and each centroid ckby
∑, (∑ ) ∙ ,( )
, . Similarly, the distance is normalized into [0,1].
Table 1. An example database.
User Feature ([PE, BE, AS, AF, RE]) u1 [(200,300,1),(30,3,0),{s,l,l,v},(5.4,-1.3),(5.2,0.2,1.1)]
u2 [(1000,500,2),(10,5,30),{s,p,s},(7.7,-3.4),(0.8,3.4,1.0)]
u3 [(100,30,0),(1,3,20),{s},(2.4,-3.0),(0.2,0.9,1.1)]
u4 [(100,500,1),(40,5,1),{s,s,s,l,s},(4.7,-0.4),(4.8,1.4,1.5)]
We use the example database in Table 1 to demonstrate how FCM works. Assume
c=2, m=2 and ε =
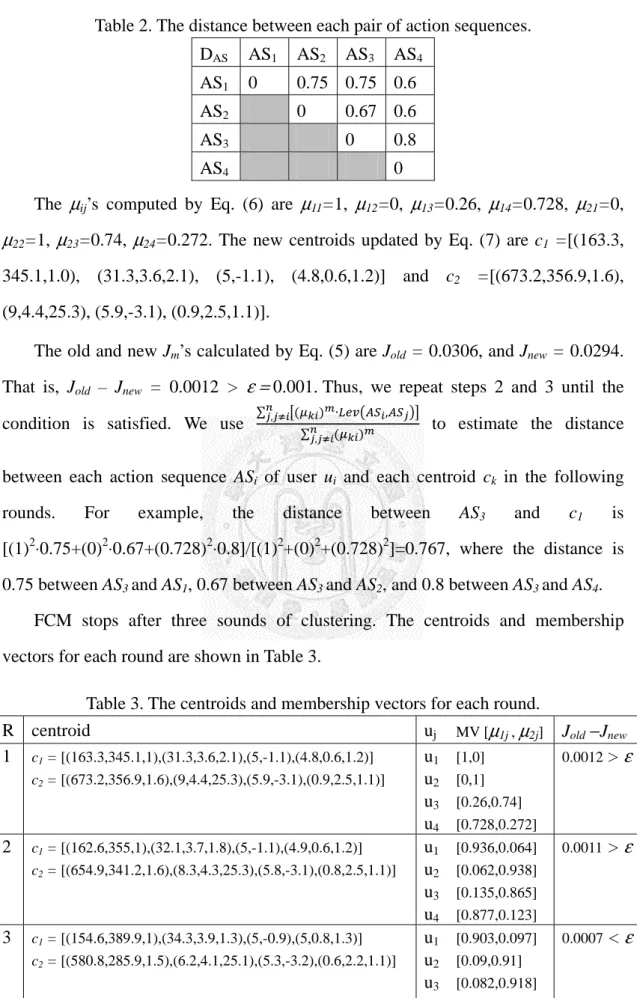
0.001. We first select u1 and u2 as two centroids (c1 and c2). The distance between each pair of action sequences in the first round is shown in Table 2.Table 2. The distance between each pair of action sequences.
DAS AS1 AS2 AS3 AS4
AS1
0 0.75
0.75 0.6 AS20
0.67 0.6AS3
0 0.8
AS4
0
The
μ
ij’s computed by Eq. (6) areμ
11=1, μ
12=0, μ
13=0.26, μ
14=0.728, μ
21=0, μ
22=1, μ
23=0.74, μ
24=0.272. The new centroids updated by Eq. (7) are c
1 =[(163.3, 345.1,1.0), (31.3,3.6,2.1), (5,-1.1), (4.8,0.6,1.2)] and c2 =[(673.2,356.9,1.6), (9,4.4,25.3), (5.9,-3.1), (0.9,2.5,1.1)].The old and new Jm’s calculated by Eq. (5) are Jold
= 0.0306, and J
new= 0.0294.
That is, Jold
– J
new= 0.0012 > ε =
0.001. Thus, we repeat steps 2 and 3 until the condition is satisfied. We use ∑, (∑ ) ∙( ) ,, to estimate the distance between each action sequence ASi of user ui and each centroid ck
in the following
rounds. For example, the distance between AS3 and c1 is [(1)2⋅0.75+(0)2⋅0.67+(0.728)2⋅0.8]/[(1)2+(0)2+(0.728)2]=0.767, where the distance is 0.75 between AS3 and AS1, 0.67 between AS3 and AS2, and 0.8 between AS3 and AS4.FCM stops after three sounds of clustering. The centroids and membership vectors for each round are shown in Table 3.
Table 3. The centroids and membership vectors for each round.
R centroid uj MV [
μ
1j ,μ
2j] Jold−Jnew1 c1 = [(163.3,345.1,1),(31.3,3.6,2.1),(5,-1.1),(4.8,0.6,1.2)]
c2 = [(673.2,356.9,1.6),(9,4.4,25.3),(5.9,-3.1),(0.9,2.5,1.1)]
u1
u2 u3
u4
[1,0]
[0,1]
[0.26,0.74]
[0.728,0.272]
0.0012
> ε
2 c1 = [(162.6,355,1),(32.1,3.7,1.8),(5,-1.1),(4.9,0.6,1.2)]
c2 = [(654.9,341.2,1.6),(8.3,4.3,25.3),(5.8,-3.1),(0.8,2.5,1.1)]
u1
u2
u3
u4
[0.936,0.064]
[0.062,0.938]
[0.135,0.865]
[0.877,0.123]
0.0011
> ε
3 c1 = [(154.6,389.9,1),(34.3,3.9,1.3),(5,-0.9),(5,0.8,1.3)]
c2 = [(580.8,285.9,1.5),(6.2,4.1,25.1),(5.3,-3.2),(0.6,2.2,1.1)]
u1 u2
u3 u4
[0.903,0.097]
[0.09,0.91]
[0.082,0.918]
[0.931,0.069]
0.0007
< ε
3.4 Discovering Role Change Patterns
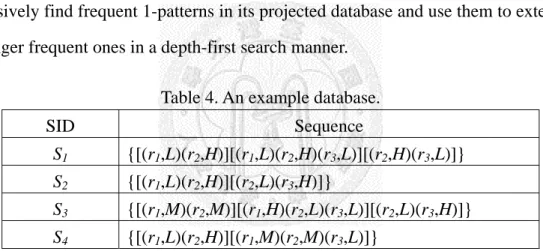
To mine role change patterns, we first transform every membership in each membership vector into a degree as defined by Eq. (1). For example, the membership vector (0.18,0.01,0.81) is transformed into [(r1,L)(r2,L)(r3,H)]. The transformed degree vectors are collected into a database, where each transaction contains a sequence of rolesets. Next, we employ the PrefixSpan algorithm [29] to mine frequent RC patterns. The PrefixSpan algorithm first scans the database and finds all frequent RC 1-patterns, where each RC 1-pattern is associated with a projected database. The projected database of an RC pattern contains the postfixes of the roleset sequences containing the pattern. The postfix of a roleset sequence containing pattern P is defined as the rest sequence behind P. For each frequent RC pattern found Q, we recursively find frequent 1-patterns in its projected database and use them to extend Q to longer frequent ones in a depth-first search manner.
Table 4. An example database.
SID Sequence
S
1 {[(r1,L)(r2,H)][(r1,L)(r2,H)(r3,L)][(r2,H)(r3,L)]}S
2 {[(r1,L)(r2,H)][(r2,L)(r3,H)]}S
3 {[(r1,M)(r2,M)][(r1,H)(r2,L)(r3,L)][(r2,L)(r3,H)]}S
4 {[(r1,L)(r2,H)][(r1,M)(r2,M)(r3,L)]}We use the database in Table 4 to demonstrate how the PrefixSpan algorithm mines frequent RC patterns. Assume the minimum support threshold is 0.5. We first scan the database to find all frequent RC 1-patterns, and construct their projected databases as shown in Table 5, where “__” means that a new 2-pattern can be formed by adding the frequent 1-pattern to this position in the roleset.
By scanning the projected database of {[(r1,L)]}, we find 2 frequent RC 2-patterns, namely, {[(r1,L)(r2,H)]} and {[(r1,L)][(r3,L)]}. Similarly, by scanning the projected database for each RC 1-pattern found, we can find all frequent RC 2-patterns as shown in Table 6.
Table 5. Projected database for each RC 1-pattern.
1-pattern Projected database
{[(r1,L)]} {[ __,(r2,H)][(r1,L)(r2,H)(r3,L)][(r2,H)(r3,L)]}, {[ __,(r2,H)][(r2,L)(r3,H)]},
{[ __,(r2,H)][(r1,M)(r2,M)(r3,L)]}
{[(r1,M)]} {[ __, (r2,M)][(r1,H)(r2,L)(r3,L)][(r2,L)(r3,H)]}, {[ __, (r2,M)(r3,L)]}
{[(r2,L)]} {[ __, (r3,H)]},
{[ __, (r3,L)][(r2,L)(r3,H)]}
{[(r2,M)]} {[(r1,H)(r2,L)(r3,L)][(r2,L)(r3,H)]}, {[ __, (r3,L)]}
{[(r2,H)]} {[(r1,L)(r2,H)(r3,L)][(r2,H)(r3,L)]}, {[(r2,L)(r3,H)]},
{[(r1,M)(r2,M)(r3,L)]}
{[(r3,L)]} {[(r2,H)(r3,L)]}, {[(r2,L)(r3,H)]}
{[(r3,H)]}
Table 6. Frequent RC 2-patterns.
2-pattern Projected Database
{[(r1,L)(r2,H)]} {[(r1,L)(r2,H)(r3,L)][(r2,H)(r3,L)]}, {[(r2,L)(r3,H)]},
{[(r1,M)(r2,M)(r3,L)]}
{[(r1,L)][(r3,L)]} {[(r2,H)(r3,L)]}
{[(r1,M)(r2,M)]} {[(r1,H)(r2,L)(r3,L)][(r2,L)(r3,H)]}, {[ __, (r3,L)]}
{[(r2,H)][(r3,L)]} {[(r2,H)(r3,L)]}
Next, by scanning the projected database of {[(r1,L)(r2,H)]}, we find 1 frequent RC 3-pattern, {[(r1,L)(r2,H)][(r3,L)]}. Similarly, by scanning the projected database for each RC 2-pattern found, we can find all frequent RC 3-patterns as shown in Table 7.
Table 7. Frequent RC 3-patterns.
3-pattern Projected database
{[(r1,L)(r2,H)][(r3,L)]} {[(r2,H)(r3,L)]}
Finally, we obtain 12 frequent RC patterns, {[(r1,L)]}, {[(r1,M)]}, {[(r2,L)]}, {[(r2,M)]}, {[(r2,H)]}, {[(r3,L)]}, {[(r3,H)]}, {[(r1,L)(r2,H)]}, {[(r1,L)][(r3,L)]}, {[(r1,M)(r2,M)]}, {[(r2,H)][(r3,L)]}, and {[(r1,L)(r2,H)][(r3,L)]}.
4. Chapter 4 Experiment Setup and Results
4.1 Data Collection
We collected the datasets from Facebook and TUAW. Facebook is a social networking website launched in 2004. The population of users is over 800 million1 and still increases. Facebook is not only the largest social network site in the world, but also grows at the fastest rate. People use Facebook to communicate with friends, play web games, share information and form groups with users having the same hobbies. There are more and more fan groups formed on Facebook. Most users join more than one group. They can post articles, upload photos, share links, ask questions in the discussion areas, post ideas on the News Feed and interact with group members.
The groups on Facebook comprise users with the same interest.
Facebook Pages2 group people who have the same interest and give them a stage to share with others. People in Pages can post articles which can be a link, video, photo or status, make comments on others’ posts, click “Like” button, and even share information to their friends not in the group. We used the Facebook Graph API3 to collect public data from different types of Pages, including member list, news feed, photos, videos, Pages information and other related data such as descriptive messages, comment text and like list. By the Graph API and FQL4 provided by Facebook, we also collected public data from users in the member list and then extracted user features from the public data. To find different roles from different types of Pages, we chose the three categories of groups, namely, entertainment, politics and technology, as shown in Table 8.
Table 8. Categories and group names.
Category Group name
Entertainment Movie, Music
Politics Barrack Obama
1 “100 social media statistics for 2012”:
http://thesocialskinny.com/100-social-media-statistics-for-2012/
2 Facebook Pages: http://www.facebook.com/pages/browser.php
3 Facebook Graph API: http://developers.facebook.com/docs/reference/api/
4 Facebook FQL: http://developers.facebook.com/docs/reference/fql/
Technology Android
The Movie dataset contains 1534 users and 2140 posts from September 2011 to March 2012. The Music dataset contains 7712 users and 11131 posts from September 2011 to March 2012. The Obama dataset contains 3701 users and 4059 posts from November 2010 to April 2012. The Android dataset contains 13716 users and 18794 posts from November 2008 to February 2012. The time spanned by the dataset is divided into several periods on a monthly basis. Thus, the Movie dataset is split to 7 periods, the Music dataset 7 periods, the Obama dataset 18 periods and the Android dataset 27 periods.
Agarwal et al. [1] collected over 10,000 posts from TUAW to evaluate their method. TUAW is a website devoted to tips, reviews, news, analyses and opinions on everything about Apple. The dataset was crawled from The Unofficial Apple Weblog (http://www.tuaw.com) starting from January 2004 to February 2007. They contains title, timestamp, blogger, tags, blog post content, number of outlinks, number of inlinks, and comments. We also used this dataset to compare our proposed method with theirs.
The dataset doesn’t contain any personal information. Thus, we won’t take this feature into consideration. We take the number of posts and outlinks as the behavior features, where an outlink is the link shared in the post, and considered as a type of sharing. We classify the blog post by its tag information, and record in AS. The score of affectivity of blog post content is mapped to AF feature. Also, we take two recognition features into consideration, the number of inlinks and number of comments from other users, where an inlink is that the post is linked by another post (i.e. the post is shared by another post). Therefore, BE=(number of posts, number of
outlinks), AS={tag1, tag2,…}, AF=(positive score, negative score) and RE = (number
of inlinks / number of posts, number of comments from other users / number of posts).
4.2 Finding Roles in Social Network
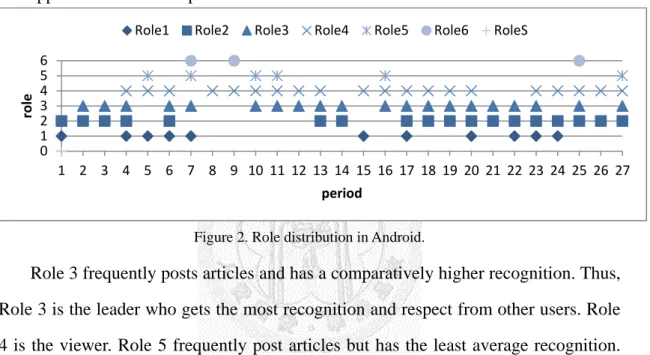
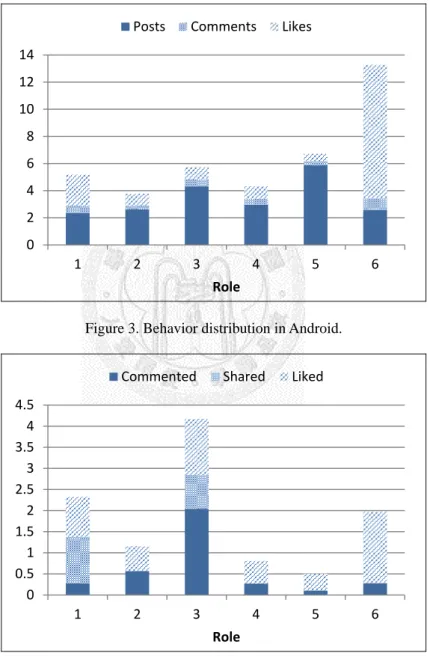
4.2.1 AndroidThere are six roles in Android. The role distribution is shown in Figure 2. It denotes the appearance of each role. For example, roles 1, 2 and S (or role 0) appear in period 1 and roles 2, 3, 4 and 5 appear in period 27. The behavior distributions, average recognition and affectivity distributions for each role are presented in Figure 3, Figure 4 and Figure 5, respectively. Roles 3 (leader) and 4 (viewer) are main roles and appear 20 times in 27 periods.
Figure 2. Role distribution in Android.
Role 3 frequently posts articles and has a comparatively higher recognition. Thus, Role 3 is the leader who gets the most recognition and respect from other users. Role 4 is the viewer. Role 5 frequently post articles but has the least average recognition.
The users of role 5 are the participants without expertise. They usually post some information including news or links when new applications emerge in market, and show some short status for their feeling about the applications. The users of role 6 are followers who frequently click “Like” button but seldom post articles. The followers don’t appear in every period but in the period when useful and new information shows up. Role 2 is the only role whose negative score is higher than positive score in affectivity. Role 2 is a kicker who is hypercritical discussant and gets more comments from the other users (commenteds) than other roles except role 3. They argue for application bugs and discuss with other fans. Role 1 gets a high number of likes received from the other users (likeds) and the highest number of shares received from the other users (shareds) but less comments. Role 1 looks like an expert in Android
0 1 2 3 4 5 6
1 2 3 4 5 6 7 8 9 10 11 12 13 14 15 16 17 18 19 20 21 22 23 24 25 26 27
role
period
Role1 Role2 Role3 Role4 Role5 Role6 RoleS
and can provide useful information to other users.
Furthermore, we find a special role S with an unusually high recognition. The role gets average 55.92 comments and 24.39 likes per post. We find that the user of special role is an official spokesman who appears only in period 1 to make an official announcement. Obviously, the special role discovered can help us to detect some special events.
Figure 3. Behavior distribution in Android.
Figure 4. Average recognition in Android.
0 2 4 6 8 10 12 14
1 2 3 4 5 6
Role
Posts Comments Likes
0 0.5 1 1.5 2 2.5 3 3.5 4 4.5
1 2 3 4 5 6
Role
Commented Shared Liked
Figure 5. Affectivity distribution in Android.
4.2.2 Obama
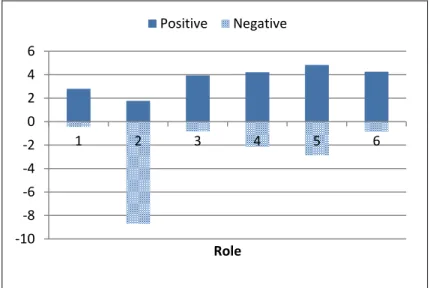
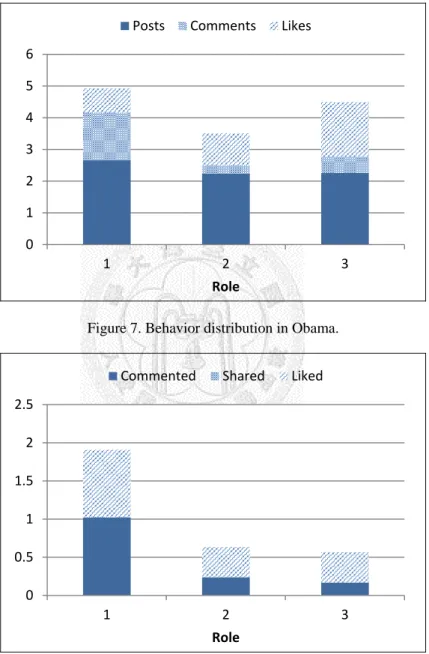
There are three roles in Obama. The role and behavior distributions are shown in Figure 6 and 7, respectively. Figures 8 and 9 present the average recognition and affectivity distribution, respectively. Role 1 is a main role and appears 17 times in 18 periods.
Figure 6. Role distribution in Obama.
There are three categories of roles in Obama, supporter (with higher positive score), dissenter (with higher negative score) and neutralist (with almost equal positive and negative score). Role 1 is the supporter, roles 2 is the dissenter, and role 3 is the neutralist. An interesting phenomenon is that the average recognition of supporter is higher than that of neutralist and dissenter as shown in Figure 8. The main role, role 1, is the supporter who always posts with positive affectivity.
Figure 9 shows that the affectivity distribution in Obama has the higher positive
-10 -8 -6 -4 -2 0 2 4 6
1 2 3 4 5 6
Role Positive Negative
0 1 2 3
1 2 3 4 5 6 7 8 9 10 11 12 13 14 15 16 17 18
role
period Role1 Role2 Role3
and negative scores, and the larger diversity between positive and negative scores than those in Android. For a political group, it is a reasonable phenomenon that the users in the group have their own positions. Meanwhile, the number of shareds is none in Obama. We can discover that users in Obama usually discuss with others and try to express their own positions but seldom share with others.
Figure 7. Behavior distribution in Obama.
Figure 8. Average recognition in Obama.
0 1 2 3 4 5 6
1 2 3
Role
Posts Comments Likes
0 0.5 1 1.5 2 2.5
1 2 3
Role
Commented Shared Liked
Figure 9. Affectivity distribution in Obama.
4.2.3 Music and Movie
The roles in Music and Movie are similar to each other. We discuss both cases together. There are three roles in Music and Movie. Music and Movie are in the entertainment category. Both have the similar roles. The role distributions are shown as in Figure 10 and Figure 11. The behavior distributions are presented in Figure 12 and Figure 13. The average recognitions are illustrated in Figure 14 and Figure 15. The affectivity distributions are displayed in Figure 16 and Figure 17. Role 2 is a main role (participant) and appears 7 times in 7 periods.
Figure 10. Role distribution in Movie.
Figure 11. Role distribution in Music.
-20 -15 -10 -5 0 5 10
1 2 3
Role Positive Negative
0 1 2 3
1 2 3 4 5 6 7
role
period Role1 Role2 Role3
0 1 2 3
1 2 3 4 5 6 7
role
period Role1 Role2 Role3
Although both fan groups have different number of users and posts, their distributions of behavior, recognition and affectivity features are quite similar. Role 1 is considered as a creator who frequently posts articles, and role 3 looks like a commentator who adds comments on others’ posts. Role 2 appears in every period.
There are no special characteristics for role 2. We consider the role as the participant who posts, comments and clicks “Like” button with average frequency. In addition, the users of role 2 have normal recognition and affectivity distribution. This role has no distinguishing features but exists in every period.
Figure 12. Behavior distribution in Movie. Figure 13. Behavior distribution in Music.
Figure 14. Average recognition in Movie. Figure 15. Average recognition in Music.
0 2 4 6 8 10 12 14
1 2 3
Role
Posts Comments Likes
0 2 4 6 8 10 12 14
1 2 3
Role
Posts Comments Likes
0 0.5 1 1.5 2 2.5
1 2 3
Role
Liked Shared Commented
0 0.5 1 1.5 2 2.5
1 2 3
Role
Liked Shared Commented
Figure 16. Affectivity distribution in Movie. Figure 17. Affectivity distribution in Music.
Without defining role types in advance, we can find different roles in different kinds of groups. In Android, there are six roles, namely, expert, kicker, leader, viewer, participant and follower. There are three roles in Obama. The groups on entertainment category, Music and Movie, have similar roles, creator, commentator and participant.
In addition, main role represents the primary composition of users. We discover that different kinds of groups have different main roles. Android has two main roles, leader and viewer since it is a well-established group having leaders posting useful articles and viewers watching the articles posted by the leaders. Conversely, the entertainment groups have one main role, participant. There are not constantly leading roles in the group. Obama has one main role, supporter.
4.3 Finding Role Change Patterns
We discover some interesting frequent RC patterns in Android as shown in Table 9 with the minimum support 0.05. The users supporting these patterns shift their roles to role 3 (leader with expertise). That is, the degree of membership to role 3 is getting higher. Since some users frequently discuss technology issues about Android, they learn more and more expertise from this group so that they gradually become leaders and their recognition increases with time.
-11 -9 -7 -5 -3 -1 1 3 5 7
1 2 3
Role
Positive Negative
-11 -9 -7 -5 -3 -1 1 3 5 7
1 2 3
Role
Positive Negative
Table 9.Role change patterns in Android.
No. Pattern Support
1 {[(2,L)(4,H)][(2,L)(3,L)(4,M)(5,M)]} 0.09 2 {[(1,M)(2,L)(3,L)(4,M)][(2,L)(3,H)]} 0.09 3 {[(2,L)(3,M)(4,M)][(2,L)(3,H)]} 0.07 We also discover some interesting frequent RC patterns in Obama as shown in Table 10 with the minimum support 0.05. The first two patterns show that loyal users never change their political stands. The rest patterns show that the users supporting these patterns shift their roles from supporters to dissenters or neutralists. A poll showed in the end of 2011, Obama's disapproval rating hits new high. We can also see this trend in the patterns we found. It may be a warning sign for the politician that the supporters shift their affectivity from positive to negative. This phenomenon may push the politician to review his decisions and policies, and try to receive supports from the public.
Table 10. Role change patterns in Obama.
No. Pattern Support
1 {[(1,H)(2,L)][(1,H)(2,L)]} 0.22 2 {[(1,L)(2,H)][(1,L)(2,H)]} 0.1 3 {[(1,H)][(1,H)(3,L)]} 0.08 4 {[(1,H)][(1,H)(2,L)]} 0.14 5 {[(1,H)(2,L)][(1,M)(2,M)]} 0.08 6 {[(1,H)][(1,H)][(1,H)(2,L)]} 0.06
4.4 Comparing with the Previously Proposed Method
There are five roles in TUAW blogs discovered by our model. The role distribution is shown in Figure 18. Roles 4 and 5 are active creator who has large number of posts as shown in Figure 19; however, role 5 has the highest recognition much higher than role 4 as shown in Figure 20. Thus, role 5 is considered as the leader who is the influential blogger. Role 4 is the second active but non-influential
role. Role 2 is influential but inactive blogger in the group. Role 3 is inactive and non-influential role. Role 1 is the normal role with average active and influential value.
Figure 18. Role distribution in TUAW.
Most of the users share tips, reviews, news, analyses and opinions on everything about Apple, and seldom criticize. Thus, the positive score is higher than the negative score for each role as shown in Figure 21. Compared with Figure 19, a role with a higher positive score is more willing to share with the others. Figure 18 shows that users shift their roles to 4 or 5. The users of role 5 have expertise in Apple products and their recognition increases with time. The users of role 4 frequently post articles and share comments with the others. Like the phenomenon in Android, the users in technology category learn more and more expertise from this group. Their knowledge and aspiration for sharing increase with time.
Figure 19. Behavior distribution in TUAW.
0 1 2 3 4 5
1 2 3 4 5 6 7 8 9 10 11 12 13 14 15 16 17 18 19 20 21 22
role
period
Role1 Role2 Role3 Role4 Role5
0 100 200 300 400 500
1 2 3 4 5
Role
Posts Shares
Figure 20. Average recognition in TUAW.
Figure 21. Affectivity distribution in TUAW.
Agarwal et al. [1] only found influential/non-influential and active/inactive bloggers with a ranking function. They found active and influential bloggers (role 5), inactive but influential bloggers (role 2) and active but non-influential bloggers (role 4). We can find the influential bloggers (role 5) by role analysis such as Scott Mcnulty, Laurie A. Duncan, Dave Caolo, David Chartier, Dan Lurie and Erica Sadun. We can also find that three active bloggers (Scott Mcnulty, David Chartier and Dave Caolo) play two roles, namely, influential and active bloggers. We not only find the influential and active bloggers, but also find the trend of role distribution in the blog.
Furthermore, we find another two roles, roles 1 and 3. Role 1 posts a number of
0 5 10 15 20 25 30 35 40
1 2 3 4 5
Role
Shared Commented
-60 -40 -20 0 20 40 60
1 2 3 4 5
Role
Positive Negative
questions and tries to find the answers from the other users while role 3 rarely posts articles but seeks for information. The positive affectivity of roles 1 and 3 is higher than their negative affectivity. The users of roles 1 and 3 may be potential consumers.
It is helpful for us to identify different roles of users and implement different policies to manage them.
4.5 Evaluation of Distance Measure
In this section, we evaluate the mixed distance used in behavior and recognition, namely, CD(BE1,BE2)⋅ED(BE1,BE2) and CD(RE1,RE2)⋅ED(RE1,RE2). We choose 120 users in the Music dataset and manually label them with three role types found in the Section 4.2.3 according to the behavior feature. We next use three distance measures (mixed, cosine, Euclidean) to calculate the distance between each user and the centroids of these three role types, and label the user with the nearest role type.
Finally, we calculate the precision for the three distance measures. Table 11 shows that the mixed distance measure retrieves 90.8% precision higher than the other two measures. Therefore, the mixed distance is a better distance measure for content-based behavior features.
Table 11. Precision of three distance measures.
Relevant users Precision
Mixed distance 109 90.8%
Cosine distance 105 87.5%
Euclidean distance 94 78.3%
5. Chapter 5 Conclusions and Future Work
In this thesis, we have proposed a content-based method to identify users’ roles and find the role change patterns in a social network. Our proposed method doesn’t need to define role types in advance and allow a user to play multiple roles on a social network.
Our method provides a more general and flexible way to perform role analyses in social networks. Users’ behavior and content generated play an important role in characterizing users. Thus, the affectivity and recognition features in our model lead us to find more meaningful roles from different aspects. The recognition can help us to find the influential individuals, which implies that the content generated by users may be useful. The affectivity expresses the attitude of users to the group. Moreover, by introducing the concept of fuzzy sets to the proposed method, we allow a user to play multiple roles on a social network, not limited to just one.
The experimental results show that the proposed method finds various roles in social networks without using any pre-defined roles and can discover additional roles that haven’t been previously aware of. For example, kicker in Android is found unexpectedly. Compared with the method proposed by Agarwal et al. [1], our method can find two additional roles. The users of one of these roles who rarely publish articles but seek for information may be potential consumers. It is helpful for us to identify different roles of users and implement different policies to manage them.
In addition, we discover some interesting frequent RC patterns in Android and Obama. In Android, some users are likely to shift their roles to leader since they frequently discuss technology issues about Android, and learn more and more expertise from the fan group. Thus, their recognition increases with time. In Obama, even there are some users staunchly support the politician, some users may shift their roles from the role to the other roles with higher negative affectivity, which may be a warning sign for the politician.
In the future, we may extend our model to take dynamic social network properties
into consideration, and add some context conditions to our model. With the fast growth of social networks, we may extend our model to analyze a large scale of social networks. We may also broaden the scope from fan groups to enterprise groups and compare the roles found from fan groups with those found from enterprise groups.
Moreover, enhancing the content analysis in text and analyzing the relationships between roles are another direction to extend our model.