國立台灣大學醫學院暨工學院醫學工程研究所 博士論文
Graduate Institute of Biomedical Engineering College of Medicine and College of Engineering
National Taiwan University Doctoral Dissertation
膠質母細胞瘤之個人化治療: 以影像生物標記預測 腫瘤進展模式與發展對應之腫瘤內藥物傳輸系統
Personalized Glioblastoma Treatment:
Seeking Imaging Biomarkers to Predict Tumor Progression Patterns and Developing Targeted Intratumoral Drug Delivery System
梁祥光
Hsiang-Kuang Liang
指導教授:曾文毅 博士、陳中明 博士、林峯輝 博士
Advisors: Wen-Yih Tseng, M.D., Ph.D., Chung-Ming Chen Ph.D., and Feng-Huei Lin Ph.D.
中華民國 106 年 11 月
November 2017
I
II
誌謝
一件事的完成,並非只靠自己一個人,背後有許多人與團隊的幫助。能一路走 到這裡,要感謝許多人。
在醫工與臨床研究方面:
感謝曾文毅老師的教導,在研究、教學、人生、信仰,給我許多啟發與鼓勵。
感謝陳中明老師的指導,支持我應用不同醫工領域的技術,設計實驗解決臨床問 題。感謝林峯輝老師、賴學仕碩士和實驗室團隊,共同合作進行跨領域整合實驗。
感謝台大放射腫瘤科郭頌鑫主任、魏名峰博士、陸思慧物理師與陳亮欣物理 師、台大神經外科蔡瑞章主任、曾漢民醫師與賴達明醫師、台大神經部謝松蒼醫 師、台大病理部黃佩欣醫師與溫文芬小姐、婦產部周佳宏博士、台大影醫部蘇茂源 博士、輔大公衛系游山林教授、台大化工所許朝雄博士、張倖瑋研究助理、台大醫 工所林頌然教授、中原醫工系陳民樺教授的參與、建議、討論。感謝台大醫院放射 腫瘤科、神經外科、神經部、影像醫學部、病理部、台大醫院神經腫瘤、癌防中 心、醫工所辦公室、台北醫學大學放射腫瘤科各單位同仁團隊的協助。感謝一起分 享意見,幫助研究的每一個人。特別感謝所有的病人與家屬,每一份資料都是生命 歷程的寶貴紀錄。
在「台大輻質中心跨國領航合作計畫」方面:
感謝台大癌症醫院鄭安理院長、楊志新主任支持台大輻質中心跨國合作計畫。
感謝台灣大學當時校長楊泮池教授、日本筑波大學永田恭介校長、王碧昭教授、大 庭良介教授、筑波大學醫院松村明院長、筑波質子中心櫻井英幸部長、坪井康次教 授、武榮二教授、水本斉志醫師,在雙邊各位師長與同仁協助下,開啟台大輻質中 心與筑波大學質子中心合作研究與交流訓練計畫。
感謝北海道大學醫院、MD Anderson Cancer Center、St. Jude Children’s Research Hospital、Proton Therapy Center in San Diego 的 faculty 接待台大輻質中心跨國合作計
III
畫參訪行程。感謝 MD Anderson Cancer Center Ueno Naoto 教授和 Japan Team Oncology Program Committee 讓我加入腫瘤團隊合作學院 faculty 的行列。
感謝全民健康基金會與董事長許金川教授關注質子治療對台灣癌症發展的重要 性,支持獎助台灣質子治療與國際連結合作計畫,並給予我許多進修發展的寶貴建 議與鼓勵。感謝永齡健康基金會與創辦人郭台銘先生捐贈台大輻質中心,以及一同 執行計畫的團隊。感謝台大癌醫籌備處團隊,提供台大輻質中心跨國合作計畫的幫 助。
在人生歷程方面:
感謝我的父母,雖因癌症過世多年,但他們的生命就像「一粒麥子落在地裡,
結出許多子粒來」。感謝我的岳父,他以前在世看見告訴我的,如今我漸漸看見。
感謝我的岳母、叔叔、嬸嬸時常為我們家禱告,愛我們的家,全力支持我所做的 事。感謝許多親人、朋友、兄弟姊妹、同學、同事,時常關心、鼓勵、幫助。感謝 士林、以琳、Tsukuba International Christian Assembly 以及許多教會弟兄姊妹關心代 禱。感謝在日本許多來自台灣與世界各國的朋友幫助我們在筑波進修的生活。
從物理系、醫學系到醫工所,從神經部、放射腫瘤科到台大輻質中心,一路走 來經歷挑戰、挫折、停頓、計畫未過、論文退稿,幾度感到灰心疑惑。每當想起這 些病人,其中有我照顧過的病人、同事、同學、親人、朋友,「希望幫助治好更多 人」的念頭讓我又繼續前進。
持守信念,人生總會遇到理念相同的人,相互支持鼓勵。
特別感謝太太的支持,孩子的陪伴,還有 天父、耶穌、聖靈一路保守帶領。
這一刻,想起許多令我感謝與懷念的人。我只能忘記背後,努力面前,繼續向 著標竿直跑…
IV
中文摘要
膠質母細胞瘤為成人最常見原發型腦瘤。同步放化療後最常見的進展型態為局 部或照野內復發,約佔 72%–96.8%,而遠端轉移或照野外復發約佔 2%–28%。病人開 刀前若有腫瘤周邊水腫大範圍延伸以及腫瘤位於腦室和胼胝體交界處,存活較差並 有多樣化進展型態。我們以影像生物標記,分類膠質母細胞瘤病人的腫瘤進展型態,
包括侷限型、中間型和擴散型,與相對應不同的存活狀況。再根據不同分類,提出 相對應的膠質母細胞瘤放射治療目標劃定與劑量給予,決定個人化的治療策略。侷 限型膠質母細胞瘤僅有小於 10%的人腫瘤會延伸大於原腫瘤界線兩公分,然而擴散型 病人,超過 70%會有腫瘤移動超過原腫瘤界線兩公分的情況。和侷限型的病人相比,
擴散型的病人存活狀況較差。我們的臨床研究顯示需要根據膠質母細胞瘤影像生物 標記制定個人化的治療策略。
無論侷限型或擴散型,原腫瘤處是膠質母細胞瘤復發最常見的位置。提高腫瘤 局部控制的最好策略之一,就是腫瘤內藥物注射再加上局部放射治療。我們比較各 種腫瘤內藥物傳輸方式,包括藥片、熱塑型水膠和對流加壓注射,比較藥物釋放安 全性與輻射增強效果,設計一個基礎研究探討腫瘤內藥物傳輸方式,以便臨床應用。
為達到未解決的臨床需求,我們合成一個新的藥物結合水狀凝膠與卡鉑進行腫 瘤內藥物注射。經過全面性的生物材料、細胞與動物實驗,我們成功證實水狀凝膠 與卡鉑是一個安全、有效、方便的藥物組合。腫瘤內卡鉑凝膠注射保有放射化學治 療的協同效果,而且沒有嚴重的治療副作用。單次腫瘤內水狀凝膠與卡鉑注射的藥 物持續釋放,簡化給藥過程與接續的放射治療,有助應用在臨床腦瘤治療。
關鍵字: 膠質母細胞瘤、影像生物標記、疾病分類、個人化治療、卡鉑凝膠、腫瘤 內藥物注射、同步放射化學治療
V
ABSTRACT
Glioblastoma is the most prevalent primary brain tumor of adults. The most common progression patterns after concurrent chemoradiotherapy are local and in-field (72%–96.8%), and the rates of distant and out-field recurrence range from 2% to 28%. The extensive preoperative edema (EPE) (edema extent ≥ 2 cm from the tumor edge) and tumor located at synchronous subventricular zone and corpus callosum (sSVZCC) are associated with poor survival and diverse progression patterns of glioblastoma. We combined the imaging biomarkers, EPE and sSVZCC invasion, to classify glioblastomas progression patterns, including confined, intermediate, and extensive types, with different survivals. According to the classification, we proposed the corresponding RT target volume delineations and dose prescriptions to personalize treatment strategies for glioblastomas.
Less than 10% of patients with EPE- (confined type) have tumor progression extending beyond the 2-cm margin from the preoperative tumor edge, while more than 70%
glioblastomas with EPE+/SVZCC+ (extensive type) have tumor migration beyond the 2-cm margin from the preoperative tumor edge along the preoperative edema areas. Compared with patients with confines type glioblastoma, those with extensive type have poorer survival.
Our clinical study demonstrated the need for developing individualized irradiation strategies for glioblastomas according to the imaging biomarkers of EPE and sSVZCC invasion.
The tumor bed is the most common recurrence area of glioblastomas either confined or extensive types. One of the strategies to increase the local tumor control is intratumoral drug delivery combining with local radiotherapy (RT). We compared the drug release and safety features of intratumoral delivery modalities (wafer, thermogelling hydrogel, and convection-
VI
enhanced delivery) and the radiosensitizing effects among anti-cancer drugs (carmustine, carboplatin, and cisplatin) to propose a basic investigation on the intratumoral drug delivery for further clinical application.
To satisfy the unmet clinical need for glioma treatment, we compounded a novel drug combination of oxidated hyaluronic acid/adipic acid dihydrazide hydrogel and carboplatin for intratumoral injection. Through the comprehensive biomaterial, cell, and animal experiment design, we significantly demonstrated that hydrogel carboplatin is a safe, effective, and convenient drug combination. Intratumoral hydrogel carboplatin injection simplified the method and frequency of intratumoral hydrogel carboplatin delivery and remained the RT synergistic effect without causing severe toxicity, which makes intraoperative single drug injection with subsequent RT a feasible and potential clinical treatment for glioblastomas.
Keywords: glioblastoma, imaging biomarkers, disease classification, personalized treatment
strategy, hydrogel carboplatin, intratumoral drug injection, concurrent chemotherapyVII
TABLE OF CONTENTS
口試委員審定書……….I
誌謝………...…….II
中文摘要………...IV
A
BSTRACT………..……VC
HAPTER1
I
NTRODUCTION………..11.1 Glioblastomas: Epidemiology, Pathology, and Treatment Outcomes……….………1
1.2 The Unmet Clinical Needs for Glioblastomas: Individualized Treatment Strategies According to the Progression Patterns……….………2
1.3 Clinical Investigation of Imaging Biomarkers: Hypothesis and Purpose………4
1.4 Basic Investigation of Intratumoral Drug Injection: Hypothesis and Purpose………5
C
HAPTER2
M
ATERIALS ANDM
ETHODS………...82.1 Clinical Study of Imaging Biomarkers………8
2.1.1 Patient eligibility………...8
2.1.2 Treatment modalities………8
2.1.3 Anatomical features of preoperative imaging………9
2.1.4 Tumor progression patterns after concurrent chemoradiotherapy (CCRT)……10
2.1.5 Statistical analysis………...11
VIII
2.2 Basic Study of Intratumoral Hydrogel Carboplatin injection………12
2.2.1 Biomaterial investigation………12
2.2.1.1 Preparation of oxi-HA/ADH hydrogel and hydrogel carboplatin…………13
2.2.1.2 Characterization of oxi-HA/ADH hydrogel and hydrogel carboplatin by Fourier transformation infrared analysis………..13
2.2.1.3 Gelling time and temperature of oxi-HA/ADH hydrogel by rheometer…..14
2.2.1.4 Degradation property of oxi-HA/ADH hydrogel……….14
2.2.1.5 Drug release profile of hydrogel carboplatin by inductively coupled plasma mass spectrometry (ICP-MS)………..15
2.2.2 In vitro investigation………...15
2.2.2.1 Cell culture………..16
2.2.2.2 Biocompatibility of oxi-HA/ADH hydrogel………16
2.2.2.3 Half maximal inhibitory concentration (IC50) of carboplatin to ALTS1C1 glioma cells……….18
2.2.3 In vivo investigation………18
2.2.3.1 Subcutaneous tumor implant model of mice………18
2.2.3.2 Intratumoral dye injection………19
2.2.3.3 Irradiation setting……….19
IX
2.2.3.4 Different treatment combinations of carboplatin and irradiation……….19
2.2.3.5 Tumor growth evaluation by gross volume measurement and bioluminescence imaging (BLI)………..21
2.2.3.6 Treatment effect evaluation by tumor gross/slice………21
2.2.3.7 Toxicity evaluation by blood analysis and skin survey………22
2.2.4 Statistical analysis………...22
C
HAPTER3
R
ESULTS………..…….233.1 Imaging Biomarkers………...23
3.1.1 Patient characteristics………..23
3.1.2 Survival analyses……….………23
3.1.3 Progression pattern analysis………...……….…24
3.2 Intratumoral Hydrogel Carboplatin Injection………...……….26
3.2.1 Biomaterial investigation……….………...26
3.2.1.1 Characterization of oxi-HA/ADH hydrogel and hydrogel carboplatin by FTIR Analysis……….………... 26
3.2.1.2 Gelling time of oxi-HA/ADH hydrogel by rheometer………..26
3.2.1.3 Degradation property of oxi-HA/ADH hydrogel……….27
3.2.1.4 Drug release of hydrogel carboplatin by ICP-MS………27
X
3.2.2 In vitro investigation………...27
3.2.2.1 Biocompatibility of hydrogel………...27
3.2.2.2 IC50 of carboplatin to ALCS1C1 cells...28
3.2.3 In vivo investigation...28
3.2.3.1 First-stage in vivo experiment (low-dose carboplatin)...28
3.2.3.2 Second-stage in vivo experiment (high-dose carboplatin)...29
C
HAPTER4
D
ISCUSSION………..314.1 Imaging biomarkers and clinical impacts...31
4.1.1 Disease classification and RT strategies...31
4.1.2 High-dose proton boost for confined type glioblastoma...34
4.1.3 Disease classification and drug selection strategy...34
4.1.4 Imaging biomarkers and future investigation...35
4.2 Treatment Impact and Clinical Application of Hydrogel Carboplatin...37
4.2.1 Effectiveness of hydrogel carboplatin combined with RT for tumor control...37
4.2.2 Convenience of hydrogel carboplatin administration to combine with RT...38
4.2.3 Safety of hydrogel carboplatin with RT...40
C
HAPTER5
C
ONCLUSIONS ANDF
UTUREP
ROSPECT………..415.1 Clinical Investigation...41
XI
5.2 Basic Investigation...41
L
IST OF FIGURES………...43Figure 1. The clinical and basic research perspectives of our glioblastoma study...43
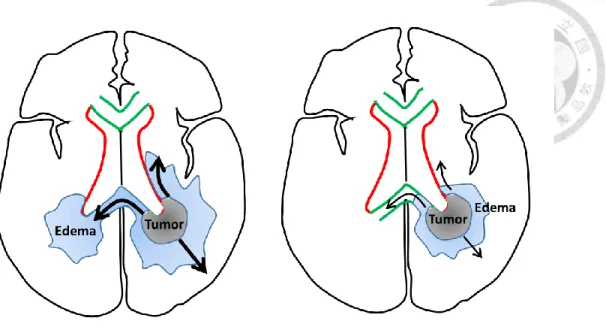
Figure 2. The correlation between tumor location with edema and tumor migration...44
Figure 3. The rationale and purpose in the current basic study...45
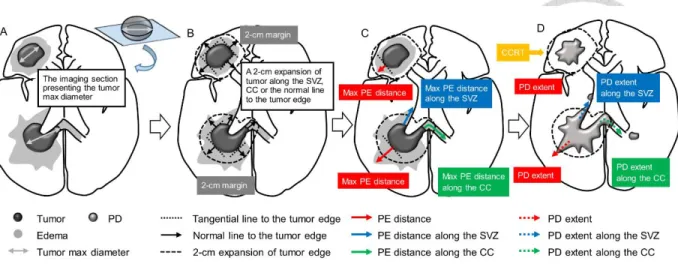
Figure 4. The method of evaluating the preoperative edema extent in our clinical study...46
Figure 5. The definitions of edema extent and progression patterns...47
Figure 6. The workflow of our basic study design...48
Figure 7. Drug preparation...49
Figure 8. The treatment regimens and evaluation protocol of our mice study………50
Figure 9. Kaplan-Meier’s estimates……….51
Figure 10. MRI demonstration of patients with different tumor locations………..52
Figure 11. MRI demonstration of patients with different edema extents and tumor locations……….... 54
Figure 12. Illustrations of by FTIR analysis……….55
Figure 13. The rheological properties of oxi-HA/ADH………...56
Figure 14. Degradation properties of oxi-HA/ADH hydrogel……….56
Figure 15. Drug release profile………57
XII
Figure 16. Biocompatibility of oxi-HA/ADH………..57
Figure 17. The LIVE/DEAD staining………..58
Figure 18. The IC50 test of carboplatin………58
Figure 19. The BLIs evolution of the first-stage in vivo experiment………59
Figure 20. The tumor volume evolution of the first-stage in vivo experiment………60
Figure 21. The BLIs evolution of the second-stage in vivo experiment………..61
Figure 22. The bioluminescence signal ofthe second-stage in vivo experiment………….61
Figure 23. The tumor volume evolution of the second-stage in vivo experiment…………62
Figure 24. The survival curves of the second-stage in vivo experiment……….….62
Figure 25. The gross and histopathological findings of the second-stage in vivo experiment……….63
Figure 26. The weight change and skin reaction of mice in the second-stage in vivo experiment………..…...64
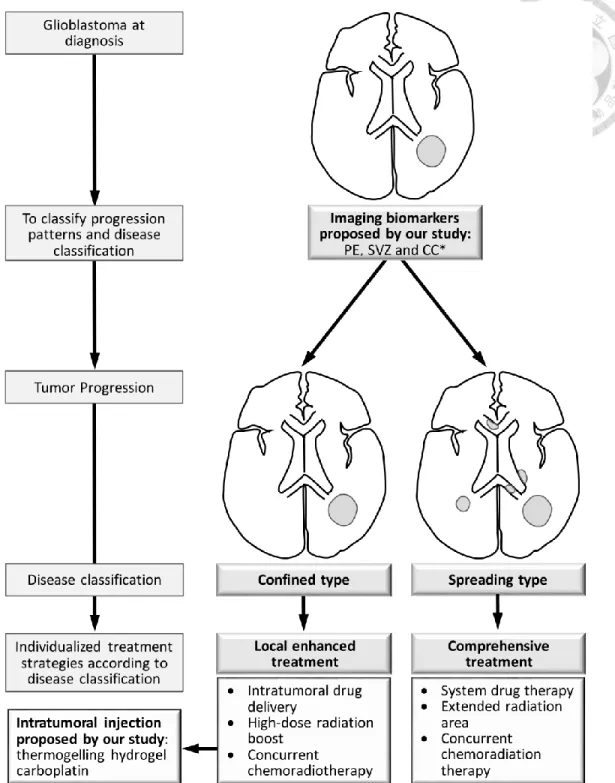
Figure 27. The proposed personalized glioblastoma treatment strategies………65
Figure 28. Progression patterns and sSVZCC invasion………66
L
IST OF TABLES……….67Table 1. Patient characteristics, imaging findings, and treatment modalities stratified by EPE status………...……...67
XIII
Table 2. Univariate analysis results for OS and PFS………68
Table 3. Multivariate Cox proportional hazards results for shorter OS and PFS combined with different various anatomical factors..……….………68
Table 4. Univariate analysis results for OS and PFS stratified by sSVZCC invasion status the in the EPE− and EPE+ groups………69
Table 5. Progression patterns and sites stratified by EPE and sSVZCC invasion………….70
Table 6. Progression patterns and sites stratified by RT techniques………71
Table 7. Analysis of survival in the first-stage in vivo experiment……….…….71
Table 8. Analysis of survival in the second-stage in vivo experiment……….………72
Table 9. Analysis of blood samples in the second-stage in vivo experiment………..72
R
EFERENCE………...73A
PPENDIX………..88A. Abbreviations………... 88
B. Publications ………...………...91
1
C
HAPTER1 I
NTRODUCTION1.1 Glioblastomas: Epidemiology, Pathology, and Treatment Outcomes
Gliomas are the most prevalent primary intracranial tumor of adults, representing 81%
of brain tumors and the most common malignant glioma histology is glioblastoma, which accounts 45% of all gliomas, follow by anaplastic astrocytoma [1]. There are annually 150 to 200 glioblastoma cases which accounts for about 37% to 47% of adult primary brain tumor in Taiwan, and the male-to-female ratio of incidence is around 1.3 to 1.5 [2-4]. The histological features of glioblastoma include increased cellularity, mitotic activity, microvascular proliferation, nuclear atypia, and necrosis [5], which are correlated to the typical image findings of central areas necrosis with extensive peritumoral edema [6].
Clinically, common prognostic factors for glioblastoma patients include age, Karnofsky performance status (KPS), neurologic status, and tumor resection extent [7-9]. The molecular biomarker of isocitrate dehydrogenase 1 (IDH1) mutation significantly predict patient overall survival (OS) [10, 11]. Before the invention of temozolomide, an alkylating agent for treating malignant glioma, surgical resection followed by radiotherapy (RT) resulted in a better OS than resection without RT [12]. Nowadays, surgical resection followed by concurrent chemoradiotherapy (CCRT) with oral temozolomide became the standard treatment for glioblastoma. The methylation status of O6-methylguanin-deoxyribonucleic acid (DNA) methyltransferase (MGMT) promotor substantially identifies patients most likely to benefit from CCRT with temozolomide [10]. The median OS and 2-year survival rates for patients receiving definitive or adjuvant CCRT with temozolomide are 13.4–16.0 months and 26.5%–
31%, respectively [13-15].
2
1.2 The Clinical Unmet Needs for Glioblastomas: Individualized Treatment Strategies According to the Progression Patterns
The most common progression patterns after CCRT with temozolomide are local and in-field (72%–96.8%), and the rates of distant and out-field recurrence range from 2% to 28%
[16-18]. However, the clinical prognostic factors and available molecular biomarkers do not correlate with the glioblastoma progression patterns, in-field or out-field, after CCRT.
Clinically, there is no effective factor available to predict whether the tumor progresses confined to the tumor bed or spreads out of tumor bed. To develop individualized treatment strategy for glioblastomas of different progression patterns, effective factors are required for disease classification [19].
Currently, RT guidelines adopted by the European Organisation for Research and Treatment of Cancer (EORTC) and the Radiation Therapy Oncology Group (RTOG) for target delineation and dose prescription of the peritumoral edematous areas of glioblastoma are diverse [20]. The necessity of irradiating peritumoral edema of glioblastomas remains controversial. The EORTC uses a 2-cm volumetric expansion of the gross tumor volume (GTV) to generate the clinical target volume (CTV) in a single phase of 60 Gy in 30 fractions, which is based on published data stating that > 80% of recurrences occur within a 2-cm margin of contrast-enhanced lesions by computed tomography (CT) or magnetic resonance imaging (MRI) scans [20]. The RTOG defines CTV1 as the surgical resection cavity plus any residual enhancing tumor plus surrounding edema within a 2–2.5-cm margin, which should receive 46 Gy in 23 fractions, followed by a cone-down boost to the tumor bed with a 2-cm margin, while CTV2 should receive an additional 14 Gy in seven fractions [20], considering that pre- or postmortem findings have demonstrated high rates of glioblastoma cells at
3
peritumoral edema areas, as observed in CT and MRI scans [21].
Some studies reported that glioblastomas with subventricular zone (SVZ) or corpus callosum (CC) invasion are associated with adverse prognoses and diverse progression patterns [22-24]. Patients with glioblastoma involving the SVZ are highly associated with a significant decline in progression-free survival (PFS) and OS [24-26]. Some published data demonstrated that glioblastoma with SVZ invasion is associated with local recurrence as well as spreading to the ventricles, distant areas, and multifocal progression [22, 24, 27, 28].
Similarly, glioblastoma with preoperative contrast-enhanced tumors or edema involving the CC [9, 29] and butterfly glioblastoma, a tumor involving the bilateral hemispheres through the CC, [30, 31] are poor prognostic factors for OS. In addition to SVZ and CC invasion, extensive peritumoral edema observed on T2-weighted or fluid-attenuated inversion recovery (FLAIR) MRI images is associated with a poor prognosis for glioblastoma patients [32].
The tumor bed is the most common recurrence area of glioblastomas and one of the treatment strategies to increase the local tumor control is intratumoral drug delivery which has the advantage of reducing the systemic toxicity and circumventing the blood-brain barrier [33]. Three modalities, including wafer, convection-enhanced delivery (CED), and hydrogel, were proposed for intratumoral anti-cancer drug delivery [33-35]. Nowadays, only carmustine wafer was utilized clinically for glioblastoma as intratumoral drug delivery [34, 35].
The individualized treatment strategies for glioblastoma patients according to their progression patterns remained undetermined. Figure 1 illustrates our study concept to satisfy the clinical unmet needs for glioblastomas, we proposed an extensive study, including
4
clinical and basic investigations, to explore imaging biomarkers for glioblastoma classification and intratumoral drug injection for glioblastoma treatment, respectively.
1.3 Clinical Investigation of Imaging Biomarkers: Hypothesis and Purpose
The neurogenesis of adult mammalian brain occurs in the SVZ on the walls of the lateral ventricles and the subgranular layer of the dentate gyrus in the hippocampus [36-38]. In humans, the anterior, occipital, and temporal horns of lateral ventricles comprise different astrocytes and ependymal, proliferating cells, and migratory patterns [36]. Cerebral commissures, including the CC and the anterior commissure, contribute interhemispheric connections. The anterior (the genu) and posterior (the splenium) sections of the CC connect the bilateral frontal and occipital lobes through the radiating fibers, respectively. The ventral surface of the CC forms the roof of the lateral ventricles close to the SVZ [39]. The anterior commissure comprises a bundle of axons, which crosses the midline in the lamina terminalis and traverses the corpora striata, and supplies communication between the temporal lobes [39]. The peritumoral edema of glioblastoma correlates with cancer cell infiltration [21] or effusion resulting from blood-brain barrier damage [40].
The SVZ hosts potential neural progenitor cells, the CC provides the interhemispheric connections, and the preoperative edema (PE) correlates with cancer cell infiltration. Using the imaging biomarkers including the anatomical factors (SVZ and CC) [23] and pathophysiological factors (PE), we investigated the outcome of glioblastoma after CCRT and classified patients according to the survival and progression patterns. The classification
5
categorized glioblastoma with in-field (confined near the tumor bed) or out-field (spreading beyond the tumor bed), which requires individualized treatment strategy.
From the anatomical perspective, we hypothesized that glioblastomas with synchronous SVZ and CC (sSVZCC) invasion have distinct progression patterns associated with the interhemispheric and lateral ventricular involvement. From the pathophysiological perspective, we hypothesized that glioblastomas with extensive PE (EPE) have high tumor migration ability. For glioblastoma patients, the interactions between the anatomical factor sSVZCC and the pathophysiological factor EPE and the associated clinical impacts, including tumor migration ability and directions, remain undetermined (Figure 2). We analyzed the associations between these imaging factors and survival and tumor progression patterns after CCRT to classify glioblastomas for further proposing individualized treatment strategies.
1.4 Basic Investigation of Intratumoral Drug Injection: Hypothesis and Purpose
Clinically, carmustine (an alkylating agent) is delivered by local wafer implantation during surgery after tumor resection to improve the survival [34, 35]. Carmustine is released from wafers over a period of approximately 5 days and wafers degrade completely over a period of 6 to 8 weeks when in continuous contact with interstitial fluid [41]. However, the adverse effects of carmustine wafer, such as healing abnormalities, cerebral edema, cerebrospinal fluid leaks, and intracranial infection were reported [34]. Big resection cavity size required for adequate drug dosage or implant dislodgement result in the technique
6
difficulty [42]. Besides, the synergistic effect of combining carmustine with RT for malignant gliomas was limited [49].
Carboplatin is a platinum-based antineoplastic agent, which is widely combined with radiotherapy for clinical cancer treatment [43-45]. Carboplatin binds to DNA to form intrastrand and interstrand cross links with the purine bases [46] and thus enhances the formation of cluster damage to DNA by ionizing radiation [47]. Several animal studies demonstrated the synergistic effect of combined carboplatin and radiation for glioma treatment [48-50]. However, carboplatin delivered by intratumoral infusion via the CED is limited in clinical practice due to the complications and delivery difficulty [49, 51]. The complications caused by CED include increased brain edema, infection, bleeding, and seizures [52]. The difficulty in catheter placement surgery depends on the brain lesion locations [52]. Moreover, neurotoxicity can be induced by the infusate backflow in the catheter, which can not be completely prevented by any insertion method [53].
The oxidized hyaluronic acid/adipic acid dihydrazide (oxi-HA/ADH) hydrogel is a biocompatible and thermogelling material [54], which can transform from liquid form into a gel-like matrix within 1–8 min, depending on the operational temperature [54]. Oxi- HA/ADH hydrogel is stable at body temperature. It maintains its gel-like state for up to 5 weeks after in vivo injection and is degraded gradually by hyaluronidase [54]. To meet requirements, including slow and steady release and radiosensitizing effect and to avoid the difficulties of wafer implantation and CED catheter placement [41, 48-50, 52], some studies investigated the combination of hydrogel-loaded anticancer agents for glioma treatments, including temozolomide, gemcitabine, cisplatin, and methotrexate etc. [42].
7
The ability of oxi-HA/ADH hydrogel to carry hydrophilic drug by crosslink achieves slow and steady drug release. Carboplatin has more intensity to produce DNA double-strand breakage than cisplatin as regard to the synergistic effect with ionized radiation, [47].
Combining these features, thermogelling oxi-HA/ADH hydrogel is potential to load carboplatin for single intratumoral injection to simplify the delivery method and frequency without compromising the synergetic effect of RT [55-58].
In Figure 3 [59], we compared the drug release and safety features of intratumoral delivery modalities (wafer, thermogelling hydrogel, and CED) [33-35] and the radiosensitizing effects among anti-cancer drugs (carmustine, carboplatin, and cisplatin) [47, 60]. In the current study, we proposed a novel combination of carboplatin loaded by thermogelling oxi-HA/ADH hydrogel and RT to satisfy the unmet clinical needs for treating malignant gliomas. The effectiveness, convenience, and safety of intratumoral delivery of oxi-HA/ADH hydrogel carboplatin (briefly hydrogel carboplatin) combined with RT for treating gliomas remains undetermined. From the biomedical engineering perspective, we hypothesized the sustained release of hydrogel carboplatin simplifies the drug delivery method and frequency and remains the synergistic effect with RT and without severe toxicity.
Through the comprehensive biomaterial, cell, and animal experiment design, we intended to demonstrate that the synergistic effect with RT by using single injection of hydrogel carboplatin is comparable to multiple injections of aqueous carboplatin. In addition, we used different regimens, including drug forms and dosages, to find the optimal CCRT parameters to improve the local tumor control and survival for mice glioma treatment, which makes intraoperative single drug injection with subsequent RT a feasible and potential clinical treatment for glioblastomas.
8
C
HAPTER2 M
ATERIALS ANDM
ETHODS2.1 Clinical Study of Imaging Biomarkers
2.1.1 Patient eligibility
Patients from a single institute (National Taiwan University Hospital), who were pathologically confirmed as having glioblastoma between August 2004 and December 2015, were retrospectively evaluated after receiving approval from the institute’s institutional review board (201405076RINC). Patients who received complete CCRT with temozolomide were enrolled and were excluded if they were younger than 18 years, had active concomitant malignancies, received an RT dosage of < 54 Gy, or did not receive follow-up MRI or CT scans after CCRT.
2.1.2 Treatment modalities
The extent of tumor excision was classified as gross total and subtotal resection. Biopsy was employed for unresectable lesions.
RT techniques [23], including three-dimensional conformal RT, intensity-modulated radiation therapy, volumetric-modulated arc therapy, and tomotherapy, were employed using 6-MV linear accelerators. GTV1 was defined as gadolinium-enhanced lesions on T1- weighted images and hyperintense lesions on FLAIR or T2-weighted images. GTV2 was defined as gadolinium-enhanced lesions on T1-weighted images. CTV1 and CTV2 were defined, respectively, as the GTV1 and GTV2 plus a 1.5–2-cm margin for potential microscopic disease with a margin reduced to 0.5 cm around natural boundaries or the optic nerve/chiasm. The planning target volume (PTV)1 and PTV2 were CTV1 and CTV2 plus a 0.3–0.5-cm margin, respectively. An RT dosage of 46 Gy—administered at a daily dose of 2
9
Gy once per day for 5 days per week—was prescribed for PTV1, and an additional 14 Gy was prescribed for PTV2. Uninvaded SVZ was not irradiated in this study.
Concurrent chemotherapy with temozolomide was administered at a daily dose of 75 mg/m2 for 7 days per week, from the first to the last day of RT. After a four-week break, the patients received up to six cycles of adjuvant temozolomide for 5 days over a 28-day period.
The dose was 150 mg/m2 for the first adjuvant cycle, and this was increased to 200 mg/m2 at the beginning of the second cycle [15].
2.1.3 Anatomical features of preoperative imaging
Neuroimaging (MRI or CT) findings were interpreted by neuroradiologists.
Preoperative imaging findings, including tumor size, edema extent, and anatomical invasion into the SVZ and CC, were evaluated. PE was defined as a hyperintense area observed through T2 or FLAIR MRI or a hypointense area observed through CT. We used the MRI hyperintense signal on T2W or FLAIR sequence with different sections, including axial, coronal, and sagittal sections, to measure the edema distance along the normal line from tumor margin to the distal edema edge. The method of evaluating the preoperative edema extent is illustrated in Figure 4. First, we selected the image section that presented the maximum diameter of the preoperative tumor (Figure 4A). Then, we created a 2-cm expansion of the tumor edge along the SVZ (the lateral wall of lateral ventricles) or CC if these structures are invaded (Figure 4B); otherwise, we drew tangential lines to the tumor edge and then used their normal lines to expand a 2-cm margin of the tumor. The 2-cm expansion margin of the tumor was used as the reference boundary to evaluate the PE extent.
The 2-cm expansion margin of the preoperative tumor was applied on the similar image
10
sections after concurrent CRT to evaluate the PD extent.
EPE was defined as PE extending ≥ 2 cm from the tumor margin (Figure 5, A1).
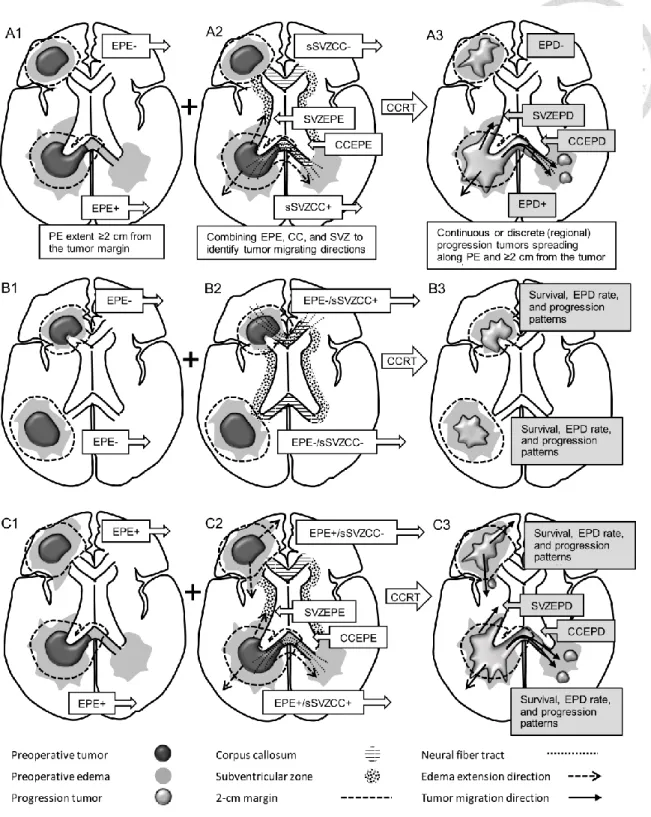
sSVZCC invasion was defined by the presence of contrast-enhanced lesions synchronously involving the lateral walls of the lateral ventricles and cerebral commissures (the CC or anterior commissure) [23] as illustrated in Figure 5, A2. The neural fiber tracts (NFTs) included the CC, forceps frontalis, and forceps occipitalis, defined by anatomical structures [39] (Figure 5, A2). For tumors with sSVZCC invasion, the EPE along the CC (CCEPE) and along the SVZ (SVZEPE) were defined as edema extending ≥ 2 cm from the tumor margin along the CC and the SVZ, respectively (Figure 5, A2). Tumor size was defined by the maximum diameter determined through preoperative T1-weighted gadolinium-enhanced MRI or contrast-enhanced CT scans [61].
2.1.4 Tumor progression patterns after CCRT
Neuroimaging after CCRT was performed primarily through MRI at intervals of 3–6 months. Tumor progression was assessed according to the imaging definition of Response Assessment in Neuro-Oncology criteria and involved either of the following: (1) ≥ 25%
enlargement of contrast-enhanced lesions compared with the smallest tumor measured either at the baseline (if no decrease) or at best response, or (2) appearance of any new contrast- enhanced lesions [62, 63].When early progressive disease is suspected on the images within 12 weeks after completion of concurrent CRT, we used the following criteria to differentiate it from the pseudoprogression: the presentation of new enhancement beyond the radiation field or the high-dose region [62, 63]. Reoperation for pathological confirmation was
11
accepted according to neurosurgeons’ clinical judgement for differentiating tumor progression from pseudoprogression and radiation necrosis [62, 63].
Extensive progressive disease (EPD) was defined as the progression of tumors continuously extending or discretely spreading ≥ 2 cm from the preoperative tumor margin along the PE areas (Figure 5, A3) [64]. For tumors with sSVZCC invasion, EPD in the SVZ (SVZEPD) and in the CC (CCEPD) were defined as tumors continuously extending or discretely spreading with PE areas along the SVZ and the CC, respectively, for ≥ 2 cm from the preoperative tumor margin (Figure 5, A3). We adopted the two imaging factors of EPE and sSVZCC invasion to categorize patients into four groups (Figure 5; B1,2 and C1,2) to analyze the survival, EPD rate, and tumor progression patterns (Figure 5, B3 and C3). The tumor progression areas were categorized as local (tumors involving the original tumor bed), regional (tumors involving the preoperative edematous areas and located beyond the original tumor bed), and distant (tumors located beyond the original tumor bed and preoperative edematous areas) [23].
2.1.5 Statistical analysis
Data analysis and statistical tests were performed using SPSS (version 19; SPSS, Chicago, IL, USA). OS was calculated on the basis of the date of first histological diagnosis to the date of death. PFS was calculated on the basis of the date of first histological diagnosis to the date of disease progression, including death or tumor progression proven through imaging Patients lost to follow-up or those who were alive but were without progression at the time of analysis were censored from the analysis. Survival was calculated using the Kaplan-Meier product-limit method. Differences in survival were compared between the
12
groups by using the log-rank test. The variables of the anatomical features and other adverse prognostic factors, including age, KPS, extent of tumor resection, and tumor size, were used for the univariate and Cox regression analyses [7-9, 61, 65]. Patient age was stratified as <
50 versus ≥ 50 years, KPS as ≤ 70 versus ≥ 80, and tumor size as < 5 versus ≥ 5 cm. The extent of tumor excision was classified according to the findings of postoperative neuroimaging or neurosurgeon records. The hazard ratios (HRs) and 95% confidence intervals (CIs) were calculated for the survival data. Fisher’s exact test was used to examine the significance of the association between EPE and sSVZCC invasion and tumor progression patterns and areas. All tests were two-sided and results with p < 0.05 were considered statistically significant.
2.2 Basic Study of Intratumoral Hydrogel Carboplatin Injection
The workflow of our comprehensive study design, including biomaterial, in vitro, and in vivo investigations, is illustrated in Figure 6 [59].
2.2.1 Biomaterial investigation
The materials and reagents used for the preparation of hydrogel carboplatin were:
hyaluronic acid (HA, average molecular weight 1.5–1.8 × 10⁶ Da), adipic acid dihydrazide (ADH), sodium bicarbonate, and sodium chloride (Sigma-Aldrich, Missouri, USA), ethylene glycol and sodium periodate (NaIO4) (RDH Chemical Company, California, USA), dialysis bag MWCO 6000–8000 (Spectrum Laboratories Incorporated, California, USA), and
13
PARAPLATIN® (carboplatin aqueous solution, 10 mg/mL) (Bristol Myers Squibb Company, New York, USA).
2.2.1.1 Preparation of oxi-HA/ADH hydrogel and hydrogel carboplatin
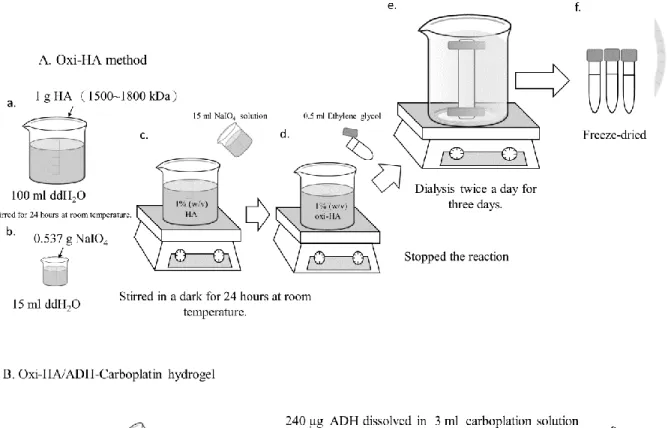
The procedures of oxi-HA/ADH hydrogel and hydrogel carboplatin preparation were illustrated in Figure 7A and 7B [59]. One gram of HA powder was dissolved in 100 mL of double-distilled water to form a weight percentage 1% (w/v) aqueous solution of hyaluronic acid, and then 15 mL of sodium periodate solution (NaIO4, 2.67%) were added gradually with stirring. The molar ratio of NaIO4 to HA was 1:1 to achieve oxidation degrees [54].
After 24 h at room temperature, the oxidation reaction was ended by adding ethylene glycol for 30 minutes. The oxi-HA solution was poured into a dialysis bag MWCO 6000-8000 with water changed twice daily for 3 days. The final products were dried by a freeze dryer (FDU- 1100, EYELA, Tokyo, Japan) for 3 days to yield a white fluffy product, oxi-HA [54]. The oxi-HA was dissolved in a phosphate-buffered saline (PBS, pH 7.4) to a concentration of 6%
(w/v) at a 4 °C overnight. At the same temperature, 0.24 mg of ADH dissolved in 3 mL of aqueous carboplatin (10 mg/mL) were homogeneously mixed to form ADH carboplatin solution. Afterwards, 12 mL of oxi-HA was added into the mold, and then 3 mL of ADH carboplatin solution was slowly poured and mixed to form hydrogel carboplatin [66], with the carboplatin concentration of 2 mg/mL.
2.2.1.2 Characterization of oxi-HA/ADH hydrogel and hydrogel carboplatin by Fourier
transformation infrared (FTIR) analysis
14
An FTIR spectrometer, FTIR-4200 (JASCO Incorporated, Maryland, USA), with ATR PRO450-S was used to distinguish the functional groups of oxi-HA, ADH, oxi-HA/ADH, and hydrogel carboplatin. Freeze-dried samples were ground into power, placed in well plates, and then pressed down gently by the pressure tip. The FTIR spectra were recorded by 16 scans between 2500 and 500 cm-1 with a resolution of 8 cm-1 [54].
2.2.1.3 Gelling time and temperature of oxi-HA/ADH hydrogel by rheometer
A rheometer DHR-3 (TA instruments, USA) with cone and plate geometry were used to estimate the rheological properties of oxi-HA/ADH hydrogel. The elastic modulus G’ and the viscous modulus G” were record and analyzed by TRIOS software (TA instruments, USA) [67]. The crossover point (called the gel point) of G’ and G” determined the gel formation and the gelling time of substance as the time elapsing from liquid state to gel state [54]. The G’ and G’’ crossover point of oxi-HA/ADH hydrogel was used to evaluate the gelling time at different temperatures ranging from 4 to 40 °C, which was measured by oscillation time sweep mode at 0.1 Hz, 10 Pa and terminated after 15 min [67].
2.2.1.4 Degradation property of oxi-HA/ADH hydrogel
In PBS under 37 °C, 5% CO2, 0.3 mL of liquid-state oxi-HA/ADH solution was poured into the cylinder mold and put for 10 min to form a gel-like matrix. Then the cylinder of oxi- HA/ADH hydrogel was moved into a 24-well culture plate and 3 mL PBS was added to each well [54]. At 12, 24, 72 and 120 h, the oxi-HA/ADH hydrogel was taken out respectively.
Lyophilization of the hydrogel was performed by using a freeze-drying method to obtain the
15
dry weight (Wd). The degradation percentage was calculated with the formula (Wd-Wi)/Wi
× 100%, where Wi is the initial weight of hydrogel at hour 0 [54].
2.2.1.5 Drug release profile of hydrogel carboplatin by inductively coupled plasma mass spectrometry (ICP-MS)
At 4 °C, 0.24 mL of 6% (w/v) Oxi-HA solution and 0.06 mL of 8% (w/v) ADH carboplatin solution were mixed in the mold to form hydrogel carboplatin. After 10 minutes, the hydrogel carboplatin was extracted from the mold and put into 24 well. After that, 3 mL of PBS (pH=7.4) was poured into each well. The 24 well contained the hydrogel carboplatin and PBS were incubated in the shaking bath (37 °C, 50 rpm). The release medium was removed at scheduled time points (1, 3, 6, 12, 24, 48, 72, 96, and 120 h) for sampling and replaced immediately with fresh PBS to keep the sink condition. The sampled carboplatin content in the release medium was measured by ICP-MS to calculate and draw the cumulative release curve [68].
2.2.2 In vitro investigation
The materials and reagents used were: Firefly D-luciferin potassium salt (Biosynth Incorporated, Naperville, USA), ALTS1C1 (glioma cells, BCRC, Taiwan) with the luciferase gene (National Centre for Cell Sciences, Taipei, Taiwan), 3T3 cells (BioVision, USA), Dulbecco’s modified Eagle’s medium/high glucose (Sigma-Aldrich), trypsin-EDTA, fetal bovine serum (FBS) and antibiotic-antimycotic solution (Gibco, Waltham, USA), Quick Cell Proliferation Assay Kit and Cytotoxicity Assay Kit (Takara, Japan), water-soluble
16
tetrazolium-1 (WST-1, Takara) and LIVE/DEAD Viability/Cytotoxicity Kit (Invitrogen, Carlsbad, USA).
2.2.2.1 Cell culture
ALTS1C1 cells and 3T3 cells were preserved in the high glucose medium supplied with 10% FBS and 1% antibiotic–antimycotic.
2.2.2.2 Biocompatibility of oxi-HA/ADH hydrogel
Biocompatibility of oxi-HA/ADH hydrogel was assessed by examining the extraction medium with 3T3 cells according to International Standardization Organization standards [69]. The extraction medium was prepared by incubating the oxi-HA/ADH hydrogel with standard culture medium at a 0.75 cm2 mL−1 extraction ratio for 72 h at 37 °C [54]. Two hundred microliters of the extraction medium were examined on a monolayer of 3T3 cells seeded in 96-well tissue culture plates and fed with standard culture medium at 37 °C under 5% carbon dioxide atmosphere. The study groups included control (standard culture medium), negative control (Al2O3 extraction medium), positive control (0.2 g/mL zinc diethyldithiocarbamate contained medium), and experimental group (oxi-HA/ADH hydrogel extraction medium) [54]. After incubation at 37 °C for 72 h, biocompatibility evaluations, including cell viability and cytotoxicity, were quantitatively analyzed.
For cell viability evaluation, the test medium was abandoned and 0.2 mL of WST-1 working solution was moved to each well. After 2 h incubation, the WST-1 working solution
17
should show color change because the tetrazolium salt split and formed formazan by cellular mitochondrial dehydrogenase. The viability of 3T3 cell was quantitatively analyzed by the ELISA reader (Tecan, Sunrise, Switzerland) readout at 450 nm with the reference wavelength of 650 nm [54].
For cytotoxicity evaluation, 0.05 mL of the incubation medium was moved into 96-well ELISA plates (Tecan, Sunrise, Switzerland) and mixed with 0.05 mL of substrate mix, then was incubated for 30 min in the dark. The tetrazolium salt in substrate mix could react with lactate dehydrogenase (LDH) to give a red formazan product. LDH released in the medium was quantitatively analyzed by ELISA reader readout at 490 nm using extraction medium without incubating 3T3 cells as a culture medium background. The 3T3 cells were lysed by lysis solution (1% Triton® X-100) and the OD 490 value was recorded [54]. The cytotoxicity percentage was calculated with the formula (Medium OD – Blank OD)/ (Total lysis – Blank OD) x 100%, where OD is the optic density [54].
Two fluorescent dyes, calcein-AM (a non-fluorescent molecule, Invitrogen, Carlsbad, USA), and ethidium homodimer (EthD-1, Invitrogen, Carlsbad, USA) were used in the LIVE/DEAD staining kit. Calcein-AM could be hydrolyzed by intracellular esterase into the highly negatively charged green fluorescent calcein to identify live cells. EthD-1 is a high- affinity nucleic acid stain that is weakly fluorescent until bound to DNA, yielding a bright red fluorescence to identify dead cells [54]. 3T3 cells treated with extraction medium were stained with LIVE/DEAD staining kit and photographed by confocal microscope (Olympus, Japan).
18
2.2.2.3 Half maximal inhibitory concentration (IC
50) of carboplatin to ALTS1C1 glioma cells
ALTS1C1 cells were preserved in high glucose medium supplied with 10% FBS and 1% antibiotic–antimycotic. Cells were plated in a 96-well plate with a density of 104 cells per well in 0.2 mL of complete medium. After 24 h, 0.02 mL of the concentrated carboplatin solution was poured to each well to accomplish the final concentration ranging from 0.1 to 100 mg/mL. A control group was treated with 0.02 mL of PBS. Cells were incubated for either 1-day or 3-day treatment before the cell assay [55]. The cell viability was evaluated by the WST-1 assay. At the end of each treatment, the medium was replaced with 0.2 mL of fresh medium containing 0.02 mL WST-1 solution and was incubated for 2 h. The absorbance of the solubilized formazan was recorded with an ELISA reader at a wavelength of 450 nm with the measured absorbance normalized to the absorbance of PBS-treated cells [55].
2.2.3 In vivo investigation
This animal experiment was approved by the ethical committee for animal care of National Taiwan University and was performed following the national regulations' guidelines.
Mice (C57BL/6) were purchased from BioLASCO Co. (Taipei, Taiwan).
2.2.3.1 Subcutaneous tumor implant model of mice
Subcutaneous glioma implants model was adopted to monitor tumor volume serially according to published studies [70-72]. Six-week-old male C57BL/6 mice were used and ALTS1C1 glioma cells with luciferase reporter gene [73, 74] were injected subcutaneously
19
in their right thigh [70, 71]. When the tumor diameter grew up to 3 to 4 mm and adequate for intratumoral drug injection, mice were categorized into different treatment groups.
2.2.3.2 Intratumoral dye injection
Blue colorant (20 μL) containing methylene blue (Sigma-Aldrich, Missouri, USA) was mixed with oxi-HA/ADH hydrogel (80 μL) and injected into the subcutaneous tumor via a syringe with a 28-gauge needle. The mice were sacrificed 1 day and 3 days after intratumoral dye injection respectively, followed by tumor excision and gross section to evaluate the distribution of dye loaded by hydrogel [49].
2.2.3.3 Irradiation setting
The mice were anesthetized by intramuscular injection (1 µl/g) of a mixture with Zoletil 50 (Virbac Laboratory, France) and 2% Xylazine (Bayer, Germany) in a 2:1 ratio [75, 76].
The radiation was delivered with 20 Gy (10 Gy daily fraction for 2 fractions, at a dosage rate of 0.5 Gy/min) adjusted according to the published data and tumor growth condition [48, 49, 51] by a cobalt-60 unit (V-9, PICKER, USA). The distance from the radiation source to the skin of right thigh was 80 cm. A customized harness was used to immobilize the mice with only the right hind leg was exposed and the remainder of the body was shielded with five times the half-value thickness of lead [77].
2.2.3.4 Different treatment combinations of carboplatin and irradiation
20
The total carboplatin dose was classified as low-dose (60 µg, 3 µg/g) and high-dose (300 µg, 15 µg/g) calculated by mouse body weight and adjusted according to the published studies [56, 78] as well as the feasible drug loading volume by mouse tumor size to explore the adequate carboplatin dose combined with RT. In order to compare the treatment effect of hydrogel carboplatin with aqueous carboplatin, the dose of hydrogel carboplatin was injected in a single dose, while the equal amount of aqueous carboplatin was divided into 3 doses and injected in 3 consecutive days. Hydrogel carboplatin or aqueous carboplatin was injected into the subcutaneous tumor by a syringe with a 28-gauge needle. The mice were categorized into the following groups according to their treatments: including shame (S), hydrogel (H), aqueous carboplatin (AC), hydrogel carboplatin (HC), RT (R), RT with hydrogel (HRT), RT with aqueous carboplatin (ACR), and RT with hydrogel carboplatin (HCR).
The purpose of the first-stage in vivo experiment was to investigate the synergistic effect of low-dose hydrogel carboplatin or aqueous carboplatin with RT. Mice were randomized into 5 treatment groups, including S, R, HRT, ACR, and HCR groups. The purpose of the second-stage in vivo experiment was to investigate the synergistic effects of high-dose hydrogel carboplatin or aqueous carboplatin with RT. Mice were randomized into 7 treatment groups, including S, H, AC, HC, R, ACR, and HCR groups.
Figure 8A and Figure 8B illustrated the cell number, dosage of hydrogel carboplatin and aqueous carboplatin, radiation dose, and schedules of drug delivery for first and second in vivo experiments, respectively [59]. The protocol of the second-stage experiment was modified according to the results of the first-stage experiment. The primary endpoint of the in vivo investigation was the tumor growth control effect according to different treatments.
The secondary endpoints included survival and treatment-related local and systemic
21
toxicities. The survival time was calculated from the day of tumor cell implant to the day of mice death or being sacrificed due to tumor dimension ≥ 20 mm or skin ulcer development.
The treatment effects were compared among different treatment groups, especially between the single injection of hydrogel carboplatin and multiple injection of aqueous carboplatin.
2.2.3.5 Tumor growth evaluation by gross volume measurement and bioluminescence imaging (BLI)
The length and width of tumors were measured by an electronic caliper and the tumor volume was estimated by the formula: volume = 1/2 × length × width2 [79]. Tumor volume was evaluated every 2 to 5 days according to the tumor growth condition. BLI was used for sequential tumor growth monitor [80]. Mice were anesthetized by isoflurance gas (8.6 mg/kg, respectively) and D-luciferin (0.2 mL) was injected intraperitoneally. BLI was acquired by spectrometer, In Vivo Image System (IVIS) SPECTRUM (exposure time: 30 sec; binning:
medium; f/stop: 1) with Living Image® software (PerkinElmer), 10 minutes after D-luciferin injection with exposure for 30 seconds. BLI was evaluated every 5 to 8 days according to the tumor growth condition and facility availability [81]. The intensity of bioluminescence signal (expressed in radiance) from ALTS1C1-luc tumors and the maximum value was quantified by Living Image® software to estimate the tumor burdens [55].
2.2.3.6 Treatment effect evaluation by tumor gross and slice
22
The gross tumors of different treatment combinations were dissected after mice being sacrificed, and slice with hematoxylin and eosin (H&E) stain was used to evaluate the histologic tumor cell proliferation and death.
2.2.3.7 Toxicity evaluation by blood analysis and skin survey
Systemic toxicity of carboplatin was evaluated by the blood biochemistry study (BCS), including liver and kidney functions, and complete blood count (CBC), which were sampled 6 days after intratumoral injection of high-dose aqueous carboplatin [82]. The BCS and CBC were analyzed by ProCyte Dx® hematology analyzer (IDEXX, Maine, USA) and Cobas c111 analyzer (Roche, New Jersey, USA) respectively. Local toxicity of RT, such as skin ulcer, usually developing within 2 weeks after RT, was monitored sequentially up to 3 weeks after treatment.
2.2.4 Statistical analysis
Data analysis and statistical tests were performed using SPSS. OS was calculated on the basis of the date of tumor plant to the date of death or being sacrificed. Survival was calculated using the Kaplan-Meier product-limit method. Differences in survival were compared between the groups by using the log-rank test. Biocompatibility investigation of oxi-HA/ADH and tumor volume differences on a specific day among different treatment groups were analyzed by using one-way analysis of variance (ANOVA) or t-test according to the number of groups. All tests were two-sided and results with p < 0.05 were considered statistically significant.
23
C
HAPTER3 R
ESULTS3.1 Imaging biomarkers
3.1.1 Patient characteristics
We evaluated 145 patients whose glioblastoma was pathologically confirmed between August 2004 and December 2015. Three patients with active concomitant malignancies and six without post-CCRT neuroimaging were excluded. By December 2016, at a median follow-up period of 74.9 (range 47.7–102.1) months, 115 (84.6%) of the 136 patients had experienced disease progression, including tumor progression noted on imaging (107; 78.7%) and death (103; 75.7%); 33 patients survived without loss of follow-up [64]. Table 1 lists the patient characteristics, imaging findings, and treatment modalities [64]. A total of 132 patients (97.1%) underwent preoperative MRI and one underwent preoperative CT. Three patients with subtotal tumor resection were evaluated on the basis of postoperative CT or MRI findings before CCRT because of the unavailability of preoperative neuroimaging data.
3.1.2 Survival analyses
In the univariate analysis (Table 2) [64], the median OS was 19.7 and 28.6 months for patients with and without EPE, respectively (p = 0.005) (Figure 9, A1). PFS was 11.0 and 17.4 months for patients with and without EPE, respectively (p = 0.011) (Figure 9, A2). The median OS was 18.7 and 25.4 months for patients with and without sSVZCC invasion, respectively (p = 0.021) (Figure 9, B1). PFS was 10.7 and 14.6 months for patients with and without sSVZCC invasion, respectively (p = 0.020) (Figure 9, B2). In the multivariate analysis (Table 3), EPE was a significant adverse prognostic factor for OS and PFS (HR, 1.98; 95% CI, 1.28–3.05 and HR, 1.84; 95% CI, 1.23–2.76, respectively). sSVZCC invasion
24
showed a near-significant trend for adverse OS (HR, 1.50; 95% CI, 0.96–2.34) and was a significant adverse prognostic factor for PFS (HR, 1.56; 95% CI, 1.03–2.38).
3.1.3 Progression pattern analysis
In the subgroup univariate analysis (Table 4) [64], the sSVZCC invasion status showed no significant differences for OS and PFS in either the EPE− or EPE+ groups. In the progression patterns analysis (Table 5) [64], EPE− patients without and with sSVZCC invasion were classified as Group I and Group II, respectively. The rates of EPD, local, regional, and distant progression were 2.8%, 58.3%, 2.8%, and 16.7% for Group I and 7.1%
(p = 0.486), 71.4% (p = 0.522), 0% (p = 1), and 21.4% (p = 0.697) for Group II, respectively.
EPE+ patients without and with sSVZCC invasion were classified as Group III and Group IV, respectively. The rates of EPD, local, regional, and distant progression were 37.0%, 72.2%, 14.8%, and 22.2% for Group III and 71.9% (p = 0.003), 84.4% (p = 0.291), 56.3%
(p < 0.001), and 34.4% (p = 0.313) for Group IV, respectively (Table 5) [64]. In EPE+/sSVZCC+ group, tumors with CCEPE were associated with a significantly higher rate of CCEPD than were those without CCEPE (77.8% vs. 20.0%, p = 0.024), whereas tumors with SVZEPE were associated with a significantly higher rate of SVZEPD than were those without SVZEPE (50.0% versus 6.3%, p = 0.015) (Table 5) [64].
During the period from 2004 to 2006, the 3-dimensional conformal radiation therapy (3DCRT) technique was given to patients who were scheduled for radiotherapy. With the advance in RT technologies, patients were treated mainly with the intensity-modulated radiation therapy (IMRT) technique and some with tomotherapy from 2007 to 2013, while the volumetric-modulated arc therapy (VMAT) technique was generally adopted after 2013.
25
In our analysis, 21 (15.4%) patients received 3DCRT, 65 (47.8%) received IMRT, 42 (30.9%) received VMAT, and 8 (5.9%) received tomotherapy. Table 6 shows no significant difference in progression patterns in patients receiving 3DCRT compared with those receiving IMRT, VMAT, and tomotherapy techniques.
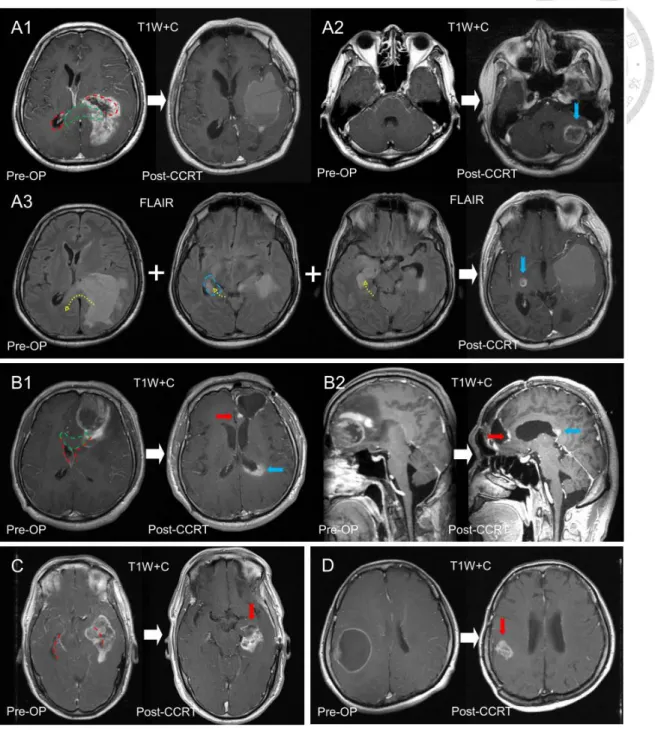
Figure 10 demonstrates distinct progression patterns and sites in 4 patients categorized according to the different combinations of SVZ and CC lesions [23]. A patient with synchronous SVZ (left occipital horn) and CC (left splenium) invasion before surgery presented no local progression (Figure 10, A1) but showed distant progression to the left cerebellum (Figure 10, A2) and regional progression of preoperative edematous areas to the contralateral hemisphere (Figure 10, A3). Another patient with synchronous SVZ (left frontal horn) and CC (left genu) invasion before surgery developed progression to the local tumor bed (Figure 10, B1) and left posterior CC along the occipital horn (Figure 10, B2). Figure 10C and 10D are the MRI images of 2 patients with local progression. One was diagnosed with SVZ invasion alone (left temporal horn) (Figure 10C) and the other had neither SVZ nor CC invasion (Figure 10D) before surgery [23].
Figure 11 demonstrates the distinct progression patterns observed after CCRT in 5 patients [64]. A patient with EPE−/sSVZCC− before surgery (Figure 11, A1,2) presented with local progression without EPD (Figure 11, A3). Another patient with EPE−/sSVZCC+
before surgery (Figure 11, B1,2) presented with local progression without EPD (Figure 11, B3). Figure 11, C1 and C2, describes a patient with EPE+/sSVZCC− before surgery, who presented with local progression with EPD (Figure 11, C3). Figure 11, D1 and D2, shows a patient with EPE+/sSVZCC+ and CCEPE before surgery, who presented with local progression with CCEPD (Figure 11, D3). Figure 11, E1 and E2, shows a patient with
26
EPE+/sSVZCC+ and SVZEPE before surgery, who presented with local progression with SVZEPD (Figure 11, E3).
3.2 Intratumoral Hydrogel Carboplatin Injection
3.2.1 Biomaterial investigation
3.2.1.1 Characterization of oxi-HA/ADH hydrogel and hydrogel carboplatin by FTIR analysis
The FTIR spectrum (Figure 12A1) demonstrated the aldehyde functional group of oxi- HA at frequency 1730 cm-1 [59]. The spectrum peak at 1730 cm-1 of oxi-HA disappeared after mixing oxi-HA with ADH, which correlated to the consumption of aldehyde to form the imine bond between oxi-HA and ADH and suggested the hydrogel formation [54, 67].
The appearance of a new forming peak at 1528 cm-1 of oxi-HA/ADH was associated with the N—H function group of ADH [54, 67]. The appearance of a new forming peak at 545 cm-1 of oxi-HA/ADH hydrogel carboplatin (Figure 12A2) was associated with the Pt—N function group of hydrogel carboplatin [59, 83]. Our results are comparable with published study that the oxi-HA, ADH, and caboplatin compound into hydrogel carboplatin [54, 83].
3.2.1.2 Gelling time of oxi-HA/ADH hydrogel by rheometer
The rheological properties demonstrated that the gelation of oxi-HA/ADH started at temperature higher than 27.6 °C (Figure 13, A1) and the gelling time of oxi-HA/ADH from liquid state to gel state were 17 seconds at 37 °C (body temperature) (Figure 13, A2) [59].
27
3.2.1.3 Degradation property of oxi-HA/ADH hydrogel
At 72 and 120 h, degradation percentages for oxi-HA/ADH (Figure 14) were 5.2% and 18.2%, respectively, which means less than 10% hydrogel was degraded within the first 3 days and more than 20% hydrogel started to degrade after 5 days [59]. The slow degradation property of oxi-HA/ADH hydrogel provides a stable carrier to load drug.
3.2.1.4 Drug release of hydrogel carboplatin by ICP-MS
Figure 15 demonstrates the cumulative release profile of carboplatin from oxi-HA/ADH hydrogel [59]. The ICP-MS result demonstrates two phases of the carboplatin release from hydrogel, including a burst release of 63.7% during the first 24 h, followed by a steady release of 16.6% over the 24 to 96 h. The drug release profile of carboplatin hydrogel illustrated that carboplatin was released up to 80.3% in 96 h, which provide 4 days to combine with RT after drug injection.
3.2.2 In vitro investigation
3.2.2.1 Biocompatibility of hydrogel
The WST-1 analysis (Figure 16A) demonstrated the cell viability of 3T3 cells cultured in oxi-HA/ADH hydrogel extraction medium was not significantly different compared with those in the control and negative control groups (p = 0.644) [59]. The LDH assay (Figure 16B) indicated the cytotoxicity oxi-HA/ADH is not significantly different from the negative control group (p = 0.173) [59].
28
The Live/Death staining (Figure 17) illustrated that nearly all the 3T3 cells were viable in the oxi-HA/ADH hydrogel after 3 days’ cultivation [59]. Our results, including WST-1 analysis, LDH assay, and Live/Death staining, demonstrated no evidence of toxicity of oxi- HA/ADH hydrogel, which is comparable with the published data [54].
3.2.2.2 IC
50of carboplatin to ALCS1C1 cells
The IC50 (Figure 18) test demonstrated that the in vitro concentrations of carboplatin to inhibit 50% ALCS1C1 cells to proliferation was 44.4 and 18.5 µg/mL after 1-day and 3-day treatment, respectively [59]. Considering the IC50 of carboplatin to AL1SC1 cells, drug carrying ability of hydrogel, and published data of Intratumoral carboplatin injection the adequate carboplatin concentration for in vivo experiment, we adopted the carboplatin concentration of 2 mg/mL for our in vivo investigation [56, 78].
3.2.3 In vivo investigation
3.3.1 First-stage in vivo experiment (low-dose carboplatin)
Five treatment groups, including S (N = 5), R (N = 5), HRT (N = 5), ACR (N = 5), and HCR (N = 5), were analyzed in the first-stage in vivo experiment. One mouse in HRT group and and 2 mice in HCR group died early due to the anesthesia procedure.
Comparing with the sham group, the BLI (Figure 19) demonstrated the relatively delayed tumor progression in all treatment groups [59]. Correspondingly, the tumor volume curves (Figure 20) of the treatment groups demonstrated tumor progression after temporary
29
tumor control effects [59]. On day 24, the tumor volume analysis (excepting sham group) by one-way ANOVA showed no difference of tumor progression for RT with and without low- dose carboplatin (p = 0.787). The survival data (Table 7) revealed that all mice treated with RT alone or combined with low-dose carboplatin died within 39 days after tumor implant [59].
3.2.3.2 Second-stage in vivo experiment (high-dose carboplatin)
Seven treatment groups, including S (N = 7), H (N = 9), AC (N = 9), HC (N = 9), R (N
= 6), ACR (N = 6), and HCR (N = 6), were analyzed in the second-stage in vivo experiment.
The BLI (Figure 21) demonstrated the tumor nearly complete response in HCR and ACR groups, while tumor progression in other treatment groups [59]. The bioluminescence signal represented in radiance showed corresponding findings (Figure 22) [59].
Figure 23 [59] illustrates the tumor volume curves of different treatment modalities combination in the second-stage in vivo experiment with high-dose carboplatin (15 µg/g), including RT, aqueous carboplatin (100 µg once daily for 3 days) or hydrogel carboplatin (300 µg in a single dose on the first treatment day) alone, and combining RT with aqueous or hydrogel carboplatin, respectively. In ACR and HCR groups, the tumor volume curves demonstrate good tumor control without difference (p = 0.904), while R group demonstrates tumor progression after temporal tumor volume control and AC and HC groups demonstrate persistent tumor progression. Tumor injected with hydrogel alone showed the same tumor growth as those without any treatment.
![Figure 3. The rationale and purpose in the current basic study: by comparing the characteristics of the intratumoral delivery modalities and drugs for malignant gliomas to propose a novel combination to satisfy the unmet clinical need [59]](https://thumb-ap.123doks.com/thumbv2/9libinfo/9608042.633694/59.918.166.806.125.477/rationale-comparing-characteristics-intratumoral-delivery-modalities-malignant-combination.webp)
![Figure 6. The workflow of our basic study design: biomaterial, in vitro, and in vivo investigations [59].](https://thumb-ap.123doks.com/thumbv2/9libinfo/9608042.633694/62.918.134.784.525.803/figure-workflow-basic-study-design-biomaterial-vitro-investigations.webp)
![Figure 8. The treatment regimens and evaluation protocol of our mice study: (A) low- low-dose carboplatin (first-stage experiment) and (B) high-low-dose carboplatin (second-stage experiment) [59].](https://thumb-ap.123doks.com/thumbv2/9libinfo/9608042.633694/64.918.173.796.116.866/treatment-regimens-evaluation-protocol-carboplatin-experiment-carboplatin-experiment.webp)
![Figure 9. Kaplan-Meier’s estimates of (A1) OS and (A2) PFS for patients with and without EPE, (B1) OS and (B2) PFS for patients with and without sSVZCC invasion [64]](https://thumb-ap.123doks.com/thumbv2/9libinfo/9608042.633694/65.918.136.800.127.830/figure-kaplan-meier-estimates-patients-patients-ssvzcc-invasion.webp)