國立臺灣大學醫學院暨工學院醫學工程學系 博士論文
Department of Biomedical Engineering National Taiwan University
Doctoral Dissertation
利用運輸通道蛋白建構報導基因系統與其相關應用 The feasibility and applicability as multi-imaging reporter
genes using NTCP and OATP1B3
吳孟容 Menq-Rong Wu
指導教授﹕黃義侑 教授 與 蕭仲凱 醫師
Advisors: Yi-You Huang, Ph. D and Jong-Kai Hsiao, M.D.
中華民國 108 年 11 月
Nov 2019
誌謝
轉眼迎來博士攻讀生涯終點站,讓我還來不及消化這消息。回首過往,許多 點滴浮上心頭。這段博士攻讀旅程,一路走來雖然不到跌跌撞撞,不過也是九彎 十八拐。實驗成果是由一次次的試誤所累積而成的,而實驗方向是由一次次的碰 撞所尋找出來的。這一路上,很感謝大家從旁給予的支持、建議與協助。感謝蕭 仲凱醫師的鼓勵,讓我有攻讀博士的動力;也感謝蕭醫師提供許多實驗建議與研 究環境,讓我能不斷的前行。感謝黃義侑教授給予我實驗上與課業上的指導,讓 我跳脫平常的思維框架。感謝楊中宜醫師指導我分析 MRI 影像,讓我能更加了解 分析上需要注意的小細節感謝。台北慈濟的實驗室同仁:珍妏學姐、憶柔、孟潔、
德森與小勳協助我實驗的進行,使得實驗進程得以加速。感謝 MRI 與 IVIS 的操 作員:雅雲、云珊與鳳霞姐協助造影,讓我得到非常精美的影像結果。感謝台大 第八共同研究室的同仁們:煜堃、雅絹、群玲、南哥、聖典、菜頭、沖哥跟芳宇 給予我實驗建議與共研事務上的協助,讓我在共研的實驗生活能順順利利。感謝 所上的琦美姐、素秋姐與宇寧助教協助我處理所上的大小事務。感謝口試委員們:
廖漢文醫師、楊台鴻教授與黃東明博士給予我許多寶貴的建議,更加拓展我研究 的思維面向。最後全面感謝曾參與我博士生涯的朋友們與家人們,有你們才能有 現在的我。
Abbreviation
8-FcA 8-fluorescein-cAMP
ASBT Apical sodium-dependent bile acid cotransporter
BLI bioluminescence imaging
BSA bovine serum albumin
CRISPR clustered regularly interspaced short palindromic repeats
CT computed tomography
DAPI 4'-6-diamidino-2-phenylindole
DDI drug-drug interaction
DiOC6 3,3’-dihexyloxacarbocyanine
DMEM Dulbecco’s modified Eagle’s medium
DMSO dimethyl sulfoxide
FBS fetal bovine serum
FDA Food and Drug Administration
FITC fluorescein isothiocyanate
FMTX fluorescein-methotrexate
FOV field of view
GCG glucagon
Gd-EOB-DTPA, Primovist gadolinium-ethoxybenzyl-diethylenetriaminepentaacetic acid
GFP fluorescence protein
GFP green fluorescent protein
HBV hepatitis B virus
HDV hepatitis D virus
HEK 293T human embryonic kidney cells 293T
HMG-CoA hydroxymethylglutaryl-CoA
ICG Indocyanine Green
ICP-MS Inductively coupled plasma mass spectrometry
IHC Immunohistochemistry
Ins insulin
ITS-G insulin, transferrin, selenium solution
IVIS in vivo imaging system
LD50 lethal dose
MATE multidrug and toxin extrusion transporter MDR1 multidrug resistance protein 1tertransporter MDR3 multidrug resistance protein 3tertransporter
MEM minimum essential medium
MGC Mammalian Gene Collection
MOI multiplicity of infection
MR magnetic resonance
MRP multidrug resistance protein
MTT 3-[4,5-dimethylthiazol-2-yl]-2,5- diphenyltetrazolium bromide
NEX number of excitations
NIR near-infrared
NTCP sodium taurocholate cotransporting polypeptide OATP organic anion transporting polypeptide
OATP1B1 organic-anion-transporting polypeptide 1B1 OATP1B3 organic-anion-transporting polypeptide 1B3
OATs organic anion transporters
OCTs organic cation transporters
PAI Photoacoustic imaging
PANC-1 pancreatic epithelioid carcinoma cells
PBS phosphate buffered saline
PBST phosphate-buffered saline with Tween-20
PET positron emission tomography
P-gp P-glycoprotein
RFP red fluorescent protein
RIPA radioimmunoprecipitation assay
ROI region of interest
ROS reactive oxygen species
SCID severe combined immunodeficient
SDS sodium dodecyl sulfate
SLC10 solute carrier family of transporters SLC10 solute carrier family of transporters 10
TBST Tris-buffered saline-Tween 20
TR/TE repetition time/echo time
中文摘要
報導基因開啟了生物學研究的一個新的世代,使得發育、癌症與分子生物學以及 細胞治療有著突破性的進展。活體細胞能利用螢光顯微鏡、非侵入式活體影像系 統、正子攝影與磁核造影來進行觀察。現今的活體細胞追蹤仍有限制,譬如說自 體螢光干擾、影像擷取深度與報導基因的強弱。因此,我們著重於新的報導基因 的開發。首先我們選出Apical sodium-dependent bile acid cotransporter (ASBT)、
sodium taurocholate co-transporting polypeptide (NTCP)與 organic anion-transporting polypeptides 1B3 (OATP1B3)來評估作為報導基因的可行性,因為這些基因所表現 的蛋白主要負責物質的交換。並且,NCTP 與 OATP1B3 能運輸近遠紅外光波段的 靛氰綠(ICG)與核磁造影顯影劑的卜爾邁斯(Primovist) 。此外,因為 ASBT 與 NCTP
同屬於SLC10A 家族所以 ASBT 也可能作為一個報導基因。因此,我們選擇 ASBT、
NTCP 與 OATP1B3 來測試其作為報導基因的可行性。從體外細胞實驗結果可得知 NTCP 有最好的 ICG 運輸能力,OATP1B3 次之,而 ASBT 最弱。接著我們保留 NTCP 與 OATP1B3 作進一步活體的細胞影像追蹤。出乎意料之外,OATP1B3 攝取
靛氰綠的能力比 NCTP 來的好並且從我們的體外與活體測試結果發現 NCTP 並無
法攝取卜爾邁斯。整體實驗結果顯示OATP1B3 為一個多功能且卓越的報導基因應
用。
基於上述結論,我們進一步測試在癌症細胞追蹤與細胞治療上OATP1B3 作為報導
基因的可行性。帶有OATP1B3 的 HT-1080 細胞腫瘤在注射靛氰綠後的九十六小時
依然能在非侵入式影像系統中偵測出靛氰綠訊號,並且打入卜爾邁斯後也能利用
核磁造影進行追蹤。我們更進一步將OATP1B3 轉染至具有分化成胰島相似細胞能
力的PANC-1 上,而帶有 OATP1B3 的 PANC-1 腫瘤也能利用核磁造影進行追蹤。
由此,我們對於OATP1B3 作為報導基因應用於癌症生物學與細胞治療上更具有信
心。
近來報導指出NTCP 為 B 型與 D 型肝炎病毒的入口之一。因此,我們嘗試利用帶
有 NTCP 的細胞建構藥物篩選平台。有潛力的治療藥物會與靛氰綠競爭 NTCP 這 個入口所以可藉由競爭結果得知是否可作為治療藥物。若是靛氰綠訊號低者則表
示其作為治療肝炎的效果可能較好。藉由這樣的特性,我們成功建構帶有 NTCP
細胞的肝炎藥物篩選平台。
綜合上述,OATP1B3 可作為可信賴的報導基因應用於癌症生物學與細胞治療上;
而NTCP 則可以作為肝炎藥物篩選平台的應用。
關鍵詞:報導基因、核磁造影、非侵入式活體影像系統、卜爾邁斯、靛氰綠
Abstract
Reporter genes as a tracking tool open a new window for the investigation of biology and make huge progress in development, tumor, molecular biology, and cell therapy.
Cells can be visualized through fluorescent microscopy, noninvasive in vivo imaging system (IVIS), positron emission tomography (PET), magnetic resonance imaging (MRI), etc. Currently, in vivo cell tracking still has a limitation, such as the autofluorescence, the penetration depth, and the intensity of the reporter. Thus, we focus on the new candidates as reporter genes. Apical sodium-dependent bile acid cotransporter (ASBT), sodium taurocholate co-transporting polypeptide (NTCP), and organic anion-transporting polypeptides 1B3 (OATP1B3) are what we address since they are membrane transporters responding for the exchange of many molecules.
Besides, we predict NTCP and OATP1B3 could be applicable reporter genes because they can transport indocyanine green, near-infrared fluorophore, and Primovist, MR contrast. Furthermore, ASBT could serve as a reporter gene since ASBT and NTCP are derived from the same family- the SLC10A transporter gene family. Thus, we testify the feasibility of ASBT, NTCP, and OATP1B3 as reporter genes. The highest transportability for ICG was NCTP, the following was OATP1B3, and ASBT was the last in vitro. We remained NCTP and OATP1B3 for in vivo investigation. Unexpectedly, OATP1B3 had better transportability for ICG than NTCP in vivo. Moreover, it seemed
that NTCP couldn’t intake Primovist in our in vitro and in vivo experiments. In summary, OATP1B3 was a superior reporter gene.
According to this concept, we further testified OATP1B3 as a reporter gene for tumor cell tracking and cell therapy. The xenograft of HT-1080 carrying OATP1B3 could be traced at least 96 h using IVIS after ICG administration and could be identified using MRI after Primovist injection. We further transduced OATP1B3 into PANC-1 cells which can be differentiated as pancreatic islet-like cells. The cellular functions of PANC-1 weren’t affected after OATP1B3 transduction. Moreover, the xenograft of PANC-1 carrying OATP1B3 could be visualized with MRI. We had more confidence about OATP1B3 as a reliable reporter gene for cell tracking in the fields of tumor biology and cell therapy.
We attempted to establish a drug screening platform using NTCP-expressing cells since NTCP has been reported that it is an entry for hepatitis virus B and D (HBV and HDV).
The candidate drugs for HBV or HDV could be selected if the ICG intensity was decreased because they compete for the same entry-NTCP. The drug screening platform using NTCP-expressing cells was established successfully through the competition between ICG and the candidate drugs.
In conclusion, OATP1B3 could serve as a reliable reporter gene and applied for tumor biology and cell therapy. NTCP could use for HBV and HDV drug selection.
Keywords: Reporter genes、MRI、IVIS、Primovist、ICG
目錄
口試委員會審定書………i
誌謝………ii
Abbreviation………iii
中文摘要………v
英文摘要………vii
第一章 Introduction ... 1
1.1 Imaging application and limitation ... 1
1.1.1 Reporter system ... 1
1.1.2 Cell tracking imaging application and limitation... 2
1.2 Indocyanine green (ICG) ... 3
1.3 Membrane transporters ... 4
1.3.1 Survey ... 4
1.3.2 Organic-anion-transporting polypeptide 1B3 (OATP1B3) ... 5
1.3.3 Sodium taurocholate cotransporting polypeptide (NTCP) ... 5
1.3.4 Apical sodium-dependent bile acid cotransporter (ASBT) ... 5
1.4 Drug screening platform ... 6
第二章 Materials and methods ... 7
2.1 Cell lines and culture ... 7
2.2 Vector construction and cell transfection and transduction ... 8
2.3 Cell viability... 9
2.4 Reactive oxygen species reaction ... 10
2.5 Mitochondria membrane potential ... 10
2.6 Differentiation Capacities ... 11
2.7 Quantitative-PCR ... 11
2.8 Western blotting ... 12
2.9 Immunofluorescence ... 13
2.10 Immunohistochemistry (IHC) ... 14
2.11 Apoptosis analysis ... 15
2.12 Animal experiments ... 15
2.13 Xenograft ... 16
2.14 Magnetic resonance imaging (MRI) in vitro ... 16
2.15 Magnetic resonance imaging (MRI) in vivo ... 18
2.16 Inductively coupled plasma mass spectrometry (ICP-MS) to detect Gd ... 19
2.17 Experiments on the cellular uptake of ICG... 19
2.18 Fluorescence and bioluminescence imaging in vivo and ex vivo ... 21
2.19 Luciferase assay ... 22
2.20 Statistical analyses ... 22
第三章 Results ... 23
3.1 Confirmation of constructions ... 23
3.2 Evaluation of the intake capacity of ICG in vitro ... 24
3.3 Evaluation of the intake capacity of fluorescein isothiocyanate (FITC) in vitro ... 24
3.4 Evaluation of the intake capacity of Primovist and other contrasts in vitro ... 25
3.5 Evaluation of the intake of ICG in vivo and ex vivo ... 25
3.6 Evaluation of the intake of Primovist in vivo ... 25
3.7 The application of OATP1B3 for tumor cell tracking using IVIS ... 26
3.8 The application of OATP1B3 for tumor cell tracking using MRI ... 26
3.9 The application of OATP1B3 for PANC-1 islet-like cell tracking in cell therapy... 26
3.10 The utility of NTCP in a drug screening platform in vitro ... 27
3.11 The application of OATP1B3 as a luminescent reporter ... 28
第四章 Discussion ... 28
4.1 Importance for establishing new imaging modality... 28
4.2 The comparison among ASBT, NTCP, and OATP1B3 ... 29
4.3 The retain of ICG in NTCP and OATP1B3 expressing cells ... 29
4.4 The limitation of detective depth ... 29
4.5 Photoacoustic imaging (PAI) ... 30
4.6 Living cell addressing in MRI ... 31
4.7 Bioluminescent imaging modality using OATP1B3 ... 31
4.8 NTCP is Primovist-transporter; however, it was not in our observation ... 31
4.9 Drug screening platform ... 32
4.10 The biosafety of fluorescent dyes and MR contrasts ... 32
4.11 Future exploration ... 33
References ... 35
圖目錄
Figure 1. The plasmid maps for this study.. ... 47 Figure 2. The confirmation of the overexpression using western blotting.. ... 48 Figure 3. The transduction confirmed using fluorescent immunostaining.. ... 49 Figure 4.The ICG intake ability comparison of ASBT, NTCP, and OATP1B3 in HT- 1080... 50 Figure 5. The ICG intake and retain ability comparison of ASBT, NTCP, and
OATP1B3 in HT-29.. ... 51 Figure 6. The ICG intake and retain ability comparison of NTCP and OATP1B3 in HT-29.. ... 52 Figure 7. The FITC intake ability comparison of ASBT, NTCP, and OATP1B3 in HT- 29... 53 Figure 8. The specificity of Gd containing MR contrasts among ASBT, NTCP, and OATP1B3 in HT-1080 using T1-weighted MRI.. ... 54 Figure 9. Evaluation of ICG intake in vivo... 55 Figure 10. The biodistribution of ICG for the comparison between NTCP and
OATP1B3 expressing HT-29 xenografts in IVIS.. ... 57 Figure 11. MRI contrast-Primovist intake in vivo in MR imaging.. ... 59 Figure 12. The application of ICG-OATP1B3 system in vivo. ... 60 Figure 13. MRI revealed cell death in OATP1B3 expressing HT-1080-bearing
mouse. ... 62 Figure 14. Functional validation of OATP1B3 expression and the examination of cellular function in vitro... 63 Figure 15. The morphology and hormone-producing abilities of control and
OATP1B3 expressing PANC‐1 after induced differentiation.... ... 64 Figure 16. The application of OATP1B3 as MR reporter gene in islet-like cells
xenografting animal model. ... 65 Figure 17. Drug-screening platform in vitro. ... 67 Figure 18. OATP1B3 involving in the transportation of d-luciferin.. ... 68
表目錄
Table 1. The list of primers for Q-PCR ... 69
第一章 Introduction
1.1 Imaging application and limitation
1.1.1 Reporter system
The discovery of reporters such as green fluorescent protein (GFP) and the development of their applications opens a new era on biomedical imaging1. By genetic modification, the fluorescent protein driven by specific promoters could address the cell fate2. Furthermore, it could address promoter associating protein by using luminance-based promoter assay3. As the development progressing, Cre-loxp recombination system can provide more detail for the development and fate mapping4,5. The advantage of cells carrying reporters can be tracked and monitored after cell therapy and get the knowledge of the location of the cells, and the interaction of cells. Moreover, the known
fluorescent molecules mediated by specific transporter can be applied for
6. The fluorescent and luminescent imaging modalities have high
sensitivity; however, the limitation of penetration depth is because of the nature of optics. Currently, more efforts have been focused on the infrared fluorescent dyes and other imaging modalities that have much deeper tissue visualization and higher resolution.
1.1.2 Cell tracking imaging application and limitation
Molecular imaging opened a new page for the explosion of intracellular or intercellular interaction in vivo. There are two major methods to address cell tracking: one is treating cells with dyes/contrasts which could be detected by imaging modalities, the other is manipulating the genome of cells to carry reporter genes7,8. Short term cell tracking can be achieved by labeling fluorescent dyes, contrasts, and/or nanoparticles which represent magnetic resonance (MR)/computed tomography (CT)/positron emission tomography (PET) signals. However, there is a dilutional effect due to cell divisions and its metabolism9,10. Moreover, inappropriate interpretation may be guided because dyes/contrasts/nanoparticles are intake by macrophages or other cells once labeled cells are dead11. Thus, the better method to address long-term cell tracking is the genetic modification with reporter genes, such as traditional GFP, red fluorescent protein (RFP), and bioluminescence imaging (BLI)12,13; herpes simplex virus type 1 thymidine kinase reporter, norepinephrine transporter, and dopamine transporter in PET14,15; transferrin receptor, organic-anion-transporting polypeptide 1B1 (OATP1B1), and organic-anion-transporting polypeptide 1B3 (OATP1B3) in magnetic resonance imaging16–18. Although Fluorescence and BLI have advantages in the sensitivity of the detection as compared with other imaging modality, the penetration depth is restricted due to the nature of optics and the copy number of reporter genes. Furthermore, the
manipulation of the genome may change the characteristics of cells such as uncontrollable proliferation, apoptosis, or dysfunction. Currently, the application of clustered regularly interspaced short palindromic repeats (CRISPR)-Cas9 to genome engineering achieving more specific genomic editing decreases the risk by previous methods to insert reporter genes19. At present, the infrared fluorescent dyes have become the main development for the investigation in molecular imaging because of its deeper tissue visualization. Indocyanine green (ICG), one of the best candidates, has been applied widely in clinical research20–23.
1.2 Indocyanine green (ICG)
Indocyanine green is the Food and Drug Administration (FDA) approved the near-infrared (NIR) compound. It has been widely made use of clinical or biomedical imaging applications since ICG has remarkable tissue penetration and the low background interference at the excitation/emission of 760nm/800nm compared with traditional NIR fluorescent dyes such as Cy5.5 which has the excitation/emission of 675nm/694nm20,24–28. ICG has more extensive applications in cardiac output measurements29, ophthalmic angiography30, rheumatoid arthritis31, hepatic function test32, intraoperative angiography33, and tumor detection and treatments34. ICG has a fast binding rate with plasma proteins. Subsequently, the complexes of ICG combining with plasma protein enter into cells through transporters such as OATP1B3 and sodium
taurocholate cotransporting polypeptide (NTCP). Then, the efflux of ICG is major through multidrug resistance protein 3 (MDR3)35 and minor through multidrug resistance protein 1 (MDR1)36. Eventually, it excretes quickly through the liver into bile juice37,38. The median lethal dose (LD50) of ICG is 50-80mg/kg in animals after intravenous injection39. In the human liver function test, the dosage of ICG is 0.5mg/kg which is extremely low and far from 50-80mg/kg. Thus, the low toxicity of ICG makes
it the only one fluorescent dye served in clinical application and diagnostic medication
40. According to the benefit of ICG, establishing an imaging modality through
combining ICG and transporters such as OATP1B3 and NTCP as reporter genes will make in vitro and in vivo biomedical application more reliable and more extensive.
1.3 Membrane transporters
1.3.1 Survey
Membrane transporters respond to the exchanges of nutrients, metabolites, drugs, and toxic substances to decide the fate of these substances41. There are many classes of membrane transporters such as organic anion transporting polypeptide (OATP) family, P-glycoprotein (P-gp), organic cation transporters (OCTs), organic anion transporters (OATs), multidrug resistance protein (MRP) family, and the multidrug and toxin extrusion transporter (MATE) family41. Here, we focus on the transporters that could deliver gadolinium-ethoxybenzyl-diethylenetriaminepentaacetic acid (Gd-EOB-DTPA,
Primovist) and ICG for our study.
1.3.2 Organic-anion-transporting polypeptide 1B3 (OATP1B3)
OATP1B3 belongs to OATPs family, is expressed in the hepatocytes. It is a transmembrane glycoprotein responsible to transport bilirubin42, nutrients, drugs43, certain MRI agents such as Primovist17,18,44, and ICG18,38. Because there are many components deliver into cells mediated by OATPs, it is very important to know the DDI through OATP1B3.
1.3.3 Sodium taurocholate cotransporting polypeptide (NTCP)
NTCP is sodium-dependent transporter and it belongs to the solute carrier family of transporters 10 (SLC10). It transports bile salts, sulfated compounds, thyroid hormones, drugs, and toxins45,46. NTCP and OATPs are responsible for the intake of bile salts from plasma to the liver47. Moreover, it can transport ICG into cells38. Recent studies have revealed a new role of NTCP as an entry receptor of the hepatitis B virus (HBV) and hepatitis D virus (HDV)48. Many inhibitors have developed for preventing HBV infection by blocking NTCP such as cyclosporin A, Myrcludex B, and oxysterols48–50. Therefore, screening and verifying NTCP inhibitors could contribute to the prevention and therapy for hepatitis.
1.3.4 Apical sodium-dependent bile acid cotransporter (ASBT)
ASBT, mainly expressing in the intestine, kidney, cholangiocytes, and gallbladder,
belongs to the SLC10 family and responds for the transportation of bile salts, such as conjugated, unconjugated bile acids, and taurocholic acid51. Dysfunction of ASBT may cause more bile acids in the colon and leads to diarrhea, gallstone disease, hypertriglyceridemia, or even colon cancer52. Hypercholesterolemia could be treatable through using the inhibitors of bile acids transporters such as ASBT, NTCP, and so on53. That’s a reason why investigating the drug-drug interaction of ASBT is valuable.
Currently, the known inhibitors of ASBT are dihydropyridine calcium channel blockers statins and hydroxymethylglutaryl-CoA (HMG-CoA) reductase inhibitors (statins)54
1.4 Drug screening platform
The metabolism of drugs is an essential issue to discover for health. Many drug absorption is mediated by OATP1B1 and OATP1B3 mainly expressed in liver43. It makes OATP1B1 and OATP1B3 as pioneers for the screening of drug candidates to select molecules that could serve as potential drugs. The fluorescence-based method is advantageous for investigating transport because of its convenience, safety, and optical characters55. Screening molecules for fluorescence-based method to address OATP1B3 are Fluo-3, fluorescein-methotrexate (FMTX), and 8-fluorescein-cAMP (8-FcA)56,57. Although three fluorescent molecules can be used for drug screening, they have some disadvantages, such as Fluo-3 depending on Ca2+, the toxicity of FMTX and 8-FcA.
Moreover, as mentioned before, NTCP is the entry of HBV and HDV virus48. Recently, ICG is reported that it can be transported into cells mediated OATP1B3 and NTCP38. We testified that whether ICG serves as a screening molecule for a fluorescence-based method to address OATP1B3 and NTCP.
第二章 Materials and methods
2.1 Cell lines and culture
HT-1080 (a fibrosarcoma cell line) was cultured in minimum essential medium (MEM) (Invitrogen, Carlsbad, CA, USA) supplemented with 10% fetal bovine serum (FBS) (Biological Industries, Cromwell, CT, USA), 100 U/mL penicillin, and 100 mg/mL streptomycin (Invitrogen, Carlsbad, CA). Human pancreatic epithelioid carcinoma cells (PANC-1), human embryonic kidney cells 293T (HEK 293T), and HT-29 (a human
colorectal adenocarcinoma cell line with epithelial morphology) were cultured in Dulbecco’s modified Eagle’s medium (DMEM) (Thermo Fisher Scientific, Waltham,
MA, USA) supplemented with 10% FBS, 100 U/mL penicillin, and 100 mg/mL streptomycin (Thermo Fisher Scientific, Waltham, MA, USA). PANC-1 was purchased from Food Industry Research and Development Institute (Taipei, Taiwan), HT-29, HEK293T were kindly provided by Professor Ming-Jium Shieh (National Taiwan University). All cells were maintained in a humidified atmosphere containing 5% CO2
at 37°C. HEK 293T, HT-1080, PANC-1, and HT-29 passaged with 0.5% trypsin (Thermo Fisher Scientific, Waltham, MA, USA) for 0.5, 2,4, and 10 min, and the ratios for passage were 1/4, 1/6, 1/2, and 1/6, respectively. The cell preservation was frozen at -80 °C in the concentration of 1x10⁶ per 100μL Bambanker (Lymphotec Inc., Japan).
2.2 Vector construction and cell transfection and transduction
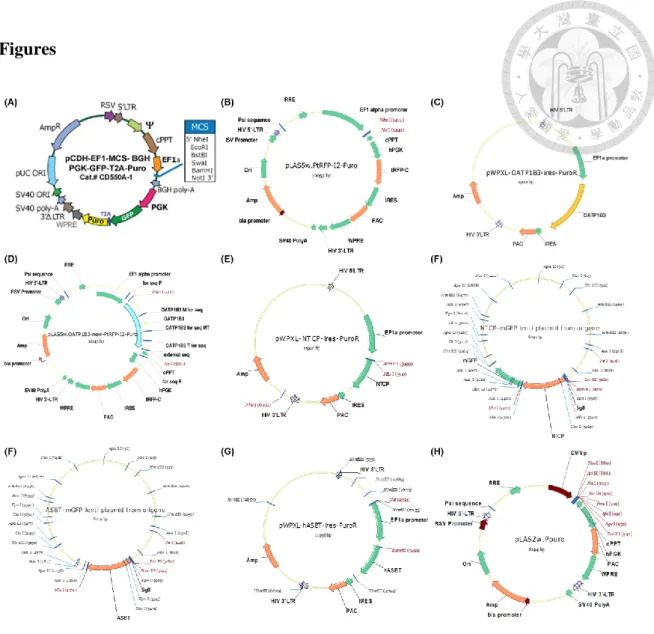
The lentiviral vector, pWPXL-MCS-PuroR, was a generous gift from Dr. Ming-Jium Shieh and the GFP control plasmid was from Dr. Yong-Chong Lin in National Taiwan University. Besides, pLAS5w.PtRFP-I2-Puro (Fig. 1B) was purchased from the RNAi consortium at Academia Sinica. OATP1B3 sequence was cloned from the Mammalian Gene Collection (MGC) full-length cDNA clone (Open BioSystems, Lafayette, CO, USA). Subsequently, OATP1B3 was amplified and cloned into the pWPXL-MCS-PuroR and pLAS5w.PtRFP-I2-Puro plasmid and the final construct were named pWPXL-OATP1B3-ires-Puro (Fig. 1C) and pLAS5w.OATP1B3-new-I2-Puro (Fig. 1D). The SLC10A1 sequence (NM_003049) and SLC10A2 sequence (NM_ 000452) were cloned from plasmids {RC210241L2 (Fig. 1F) and RC221202L2 (Fig. 1G);
Origene, Rockville, MD, United States}. Subsequently, the SLC10A1 and SLC10A12 sequences were amplified and cloned into the pWPXL-MCS-PuroR plasmid, and the final constructs were named pWPXL NTCP-ires-Puro (Fig. 1E) and pWPXL ASBT-ires-Puro (Fig. 1G), respectively. In total, 3.5 × 10⁶ 293T cells were seeded on a
10-cm2 dish one day before transfection. Before transfection, the medium was changed with fresh culture medium 1 h. Cotransfection was performed with target plasmids, psPAX2, and pMD2.G plasmids in a ratio of 4.5:3.6:0.9 (9 μg in total) by using PolyJet (SignaGen, Rockville, US) with vortexing or pipetting to mix homogenously and maintained in a still position for 15 min. Next, well-mixed transfection reagents were added to the cells and incubated at 37°C. At 16 h after transfection, the transfection medium was replaced with a culture medium. Viruses were collected at 30 h after transfection and were filtered through a 0.45-μm filter (Millipore-Sigma, Billerica, MA, USA). To infect cells with viral particles, 3 × 10⁵ PANC-1 cells, 3 × 10⁵ HT-1080 cells, and 2 × 10⁵ HT-29 cells were seeded in the 6-well plates for one day and transduced at a multiplicity of infection (MOI) of 50, 5, and 5, respectively. The infection process was performed through centrifugation at 2000 rpm at room temperature for 30 min. Cells were selected using 2 to 4 µg/mL puromycin (Millipore-Sigma, Billerica, MA, USA) for 10 days and change the medium every 2 days after infection. Cells without transduction were served as blank control. Cells with pLAS5w.PtRFP-I2-Puro transduction were served as vector control.
2.3 Cell viability
The good indicator for cell viability is 3-[4,5-dimethylthiazol-2-yl]-2,5- diphenyltetrazolium bromide (MTT) which turns to purple formazan in living cells
through mitochondrial reductase58. The PANC-1control cell and OATP1B3-expressing PANC-1 cell number was 1 × 10³ cells to seed in 96-well plates for 3 days and treated 0.5 mg/mL MTT for 1 h. Subsequently, the medium was removed from 96-well plates carefully and replaced 100μL dimethyl sulfoxide (DMSO) to dissolve MTT. The plate was detected by SpectraMax® M5 (Molecular Devices, Sunnyvale, CA, USA), the filter is 590nm after 1 min shaking at 200 rpm.
2.4 Reactive oxygen species reaction
For the adaptation of environmental stress, reactive oxygen species (ROS) are produced through mitochondrial oxidative metabolism or cellular response59. Oxidative stress occurs when excess ROS or oxidants imbalance the homeostasis of antioxidant response59. After 1 × 10⁶ cells were seeded in 6-well plates for one day, cells were treated with 10μM H2DCFDA (Millipore-Sigma, Billerica, MA, USA) in 1 mL of DMEM for 30 min at 37 °C. Then, the cells were washed three times with phosphate buffered saline (PBS) and collected. Cells which treated with 10uM H2O2 for 2 h before H2DCFDA treatment regards as a positive control. The fluorescent intensities were detected and quantified by SpectraMax® M5 (Molecular Devices, Sunnyvale, CA, USA)
2.5 Mitochondria membrane potential
Mitochondria membrane potential is an indicator of the apoptosis60. The apoptosis
signaling pathway will be triggered while cells under a toxic or unfavorable environment. Mitochondria membrane potential will decrease during apoptosis. Thus, it could be served as an apoptosis indicator61. On day 1, 6-well plates were cultured 4 × 10⁵ cells. Cells which treated with 1μg/mL doxorubicin from day 2 to day 5 were
regarded as a negative control. Subsequently, cells were trypsinized and treated with 3,3’-dihexyloxacarbocyanine (DiOC6(3), Millipore-Sigma, Billerica, MA, USA) at
37°C for 30 min in a cell culture incubator on day 6. The cells were washed and suspended in PBS for the measurement of fluorescent intensities (FITC as the filter) by FACSCalibur (BD Biosciences, San Jose, CA, USA).
2.6 Differentiation Capacities
Hardikar et al have introduced the PANC-1 cells into hormone-expressing islet-like cells62. Generally, 1 × 10⁶ cells were sprayed in 6-well plates using DMEM/F12 (Thermo Fisher Scientific, Waltham, MA, USA) supplemented with insulin, transferrin, selenium solution (ITS-G) (Thermo Fisher Scientific, Waltham, MA, USA), 100 U/mL penicillin, and 100 mg/mL streptomycin (Thermo Fisher Scientific, Waltham, MA, USA) at day 0. The medium was replaced every 2 or 3 days. Cells were harvested at day 4 and day 7 for the analysis of differentiation.
2.7 Quantitative-PCR
In total, 2 to 20 x 105 cells were used for the RNA extraction by Direct-zol RNA Kits
(ZYMO RESEARCH, CA, USA). One or 2 μg RNA was reversely transcribed to cDNA by ReverTra Ace® qPCR RT Kit (TOYOBO, Japan). After reverse transcription, cDNA was diluted 1/5 fold with ddH2O. TaqMan master mix (Thermo Fisher Scientific, Waltham, MA, USA) was mixed with 2 μL diluted cDNA and specific primers to final volume 20 μL. Q-PCR was performed by Applied Biosystems 7900HT Fast (Thermo Fisher Scientific, Waltham, MA, USA). The analysis of relative expression differences was through the 2-∆∆CT method and samples were normalized to beta-actin and relative to the vector control 63. The primers are shown in supporting information Table S1.
2.8 Western blotting
Cells were lysed in buffer containing protease
inhibitor cocktail (Roche, Mannheim, Germany). Protein concentrations were measured using the Pierce™ Coomassie Protein Assay (Bradford, Thermo Fisher Scientific, Waltham, MA, USA). Equal amounts of proteins (40 µg/lane) were loaded in 10%
sodium dodecyl sulfate (SDS)-polyacrylamide gel for 20 min at 80 V and 60~80 min (depending on the size of protein) at 110 V, and electrotransferred onto phosphatidylcholine membranes (Sartorius, G¨ottingen, Germany) for 2 h at 200 mA.
The membranes were blocked with 5% nonfat powdered milk in Tris-buffered saline-Tween 20 (TBST). Subsequently, the blots incubated with the primary antibodies against OATP8 (1:1000, Santa Cruz, CA, US), RFP (1:1000, MA5-15257, Thermo
Fisher Scientific, Waltham, MA, USA), β-actin (1:5000, MA5-15739, Thermo Fisher
Scientific, Waltham, MA, USA), NTCP (1:1000; Thermo Fisher Scientific), α-tubulin (1:5000; Merck Millipore, Burlington, MA, USA), and GAPDH (1:5000; Cell Signaling Technology, Danvers, MA, USA) separately at 4°C overnight. Afterward, membranes incubated with 1:5000 HRP-conjugated rabbit/mouse anti-IgG for 1 h at room temperature. Detection of protein bands was run by enhanced chemiluminescence (Millipore-Sigma, Billerica, MA, USA) using the BioSpectrum® 810 Imaging System (UVP, CA, US).
2.9 Immunofluorescence
Cells (2 × 10⁴) were seeded in the 8-well chamber slide for one day and fixed with 4%
formaldehyde and penetrated with 1X phosphate-buffered saline with Tween-20 (PBST) for 1 h. After washed with PBST, cells were blocked with 5% bovine serum albumin (BSA) (FocusBio, Dunedin, New Zealand) at room temperature for 1 h. Afterward, the samples were incubated with 1:100 rabbit polyclonal anti-OATP8 antibodies (Santa Cruz, CA, US), 1:50 anti-insulin antibodies (Novus Biological, US), 1:50 anti-glucagon antibodies (Thermo Fisher Scientific, Waltham, MA, USA), 1:1000 anti-RFP antibodies (Thermo Fisher Scientific, Waltham, MA, USA), 1:100 anti-NTCP antibodies (Thermo Fisher Scientific, Waltham, MA, USA), or/and rhodamine-phalloidin (staining actin;
Invitrogen, Carlsbad, CA, USA) at 4°C overnight. After a short wash in PBST, the
slides were incubated with 1:100~1:200 488-conjugated goat anti-rabbit/mouse IgG antibodies (Thermo Fisher Scientific, Waltham, MA, USA) or/and 1:100~1:200 546-conjugated goat anti-rabbit/mouse IgG antibodies (Thermo Fisher Scientific, Waltham, MA, USA) at room temperature for 1 h. The slides were mounted in SlowFade® Gold Antifade Reagent with 4'-6-diamidino-2-phenylindole (DAPI) (Thermo Fisher Scientific, Waltham, MA, USA) and were visualized using a ZOE Fluorescent Cell Imager (Bio-Rad, Hercules, CA, USA). Negative control was only treated with 5% BSA.
2.10 Immunohistochemistry (IHC)
The entire tumor tissues were collected from mice and sectioned in the same direction as the view shown in the MRI. Samples were fixed with 10% formalin and incubated with series dehydration buffers and wax to be prepared as paraffin-embedded sections (5 µm thick). Slide sections were deparaffinized in Sub-X Xylene Substitute (Leica, USA) and then were incubated in Trilogy (CELL MARQUE, Rocklin, CA, USA) to perform rehydration and antigen retrieval at 121°C for 10 min. Endogenous peroxidase was blocked by 0.3% hydrogen peroxide for 10 min. After washed with PBST, the tissue slides were blocked with 5% BSA at room temperature for 1 h. Subsequently, the slides were incubated with 1:100 rabbit polyclonal anti-OATP8 antibodies (Santa Cruz Biotechnology, Dallas, TX, USA) or 1:1000 anti-NTCP (Thermo Fisher Scientific,
Waltham, MA, USA) at 4°C overnight. After washed with PBST, the slides were treated with the EnVision kit (Agilent Technologies Inc., Santa Clara, CA, USA) and were counterstained with hematoxylin. All cover slides were examined using the ECLIPSE TE2000-U microscope (Nikon, Melville, NY, USA). Negative control was only treated with 5% BSA.
2.11 Apoptosis analysis
Tissue slide sections were deparaffinized in Sub-X Xylene Substitute (Leica, USA) and
were rehydrated in a graded alcohol series ending with water. The slides were stained using a DeadEnd™ Colorimetric Apoptosis Detection System (Promega, USA). The
operation of photo acquisition was described in the IHC section.
2.12 Animal experiments
Female BALB/cAnN.Cg-Foxnlnu/CrlNarl nude mice and severe combined immunodeficient (SCID) mice (aged 6–8 weeks) were purchased from the National Laboratory Animal Center and raised at the animal center of Taipei Tzu Chi Hospital.
All experimental procedures were approved by the Institutional Animal Use and Care Committee of Taipei Tzu Chi Hospital, Buddhist Tzu Chi Medical Foundation (102-IACUC-024, 106-IACUC-004). The mice caring were followed to the recommendations of the Guide for the Care and Use of Laboratory Animals (NIH).
2.13 Xenograft
Six to eight-week-old SCID mice were subcutaneously inoculated 1 ×10⁶ OATP1B3-expressing PANC-1 cells in 100 μL PBS near the hind limb at the right side of the mice and another injection of 1 ×10⁶ PANC-1 cells in 100 μL PBS on the other side. Six to eight-week-old nude mice were performed the same inoculations, except for the cell line was HT-1080. In total, 2.5 × 10⁶ HT-29 control cells and NTCP-expressing cells were injected subcutaneously to the nude mice on the left and right sides, respectively. The cell number used to inoculate control cells and OATP1B3-expressing HT-29 cells was 1.0 × 10⁶. The tumor sizes were measured with a digital caliper before performing fluorescence imaging by using the following formula: [(longest length) × (shortest)2]/2. If a subcutaneous nodule could be visualized (normally it was easier to observe once tumors exceeded 13.5 mm3), the size of the xenograft was recorded and the mice were sent for MRI analysis and fluorescence imaging by using the following formula: [(longest length) × (shortest)2]/2.
2.14 Magnetic resonance imaging (MRI) in vitro
For the confirmation of Primovist intake, 5 × 10⁵ cells (except for PANC-1 which was 1
× 106) were seeded in 6-well plates overnight and were treated with 1.25 mM Primovist (Bayer Pharma AG, Berlin, Germany) for 4 h. Cells were washed three times with PBS before trypsinization. After one more time washed with PBS, cells were centrifuged at
1200 rpm for 5 min in 0.2-mL tubes at 4 °C, the cells were analyzed using a clinical 1.5T MRI system (Siemens Magnetom Aera, Erlangen Germany) or 3T MR system (Signa Excite, GE Healthcare, US).
For the evaluation of the change of MR signal intensity in the treated PANC-1 cells over time, 5 × 10⁵ cells were seeded in 6-well plates overnight and further incubated with 1.25 mM Primovist (Bayer Pharma AG, Berlin, Germany) for 2 h. Cells were maintained in culture medium for different periods (0, 1, 6, 20, 28, and 44 h) after washed 3 times with PBS. At the end time point, cells were trypsinized, washed, centrifuged, and placed in a water tank for MR imaging. Cells were imaged with a clinical 3T MR system.
For comparison of MRI contrasts, 1 × 10⁶ cells were seeded in 6-well plates for one day
and were incubated with 1.25 μM Primovist (Bayer Pharma AG, Berlin, Germany) or 1.25 μM gadodiamide (GE Healthcare, Waukesha, Wisconsin, USA) for 4 h. Some
groups were also co-incubated with 100 μM rifampicin, a competitive inhibitor of OATP1B3 and NTCP. Cells were washed 3 times with PBS before trypsinization. And then, cells were washed once more with PBS. After cells were centrifuged at 1200 rpm for 5 min in 0.2-mL tubes at 4°C, the cells were imaged with a clinical 3T-MR system.
The conditions in 1.5T MRI system: Two-dimensional T1-weighted fast spin-echo pulse sequences were repetition time/echo time (TR/TE) =700/20 ms; the scanning slice
thickness was 1.0 mm with a 0.5-mm gap; the field of view (FOV) was 14 cm × 6 cm, and the matrix size was 256 × 112. The conditions in 3T MR system: Two-dimensional T1-weighted fast spin-echo pulse sequences were TR/TE = 550/13 ms; slice thickness was 1.0 mm with a 0.5-mm gap; field of view was 14 cm× 10 cm; matrix size was 288 × 192; the number of excitations (NEX) was 2, and total scan time was 4 min and 5 s.
All images were analyzed using the open-source image processing program (ImageJ) or RadiAnt DICOM Viewer (64-bit) (Medixant, Poznan, Poland). The signal for quantification was circled within the edge of the signal and normalized the circled area to acquire the MR intensity under the unit area for comparison.
2.15 Magnetic resonance imaging (MRI) in vivo
After subcutaneous implantation of cells, the MRI of the nude and SCID mice were
acquired, with the injection of Primovist (0.25 mM, 200 μL) or gadodiamide (0.5 mM, 100 μL) intravenously. Before contrast enhancements administration, mice were taken
an MR imaging as prescan control. Images were acquired using a 7T-MRI (Biospec 70/30; Bruker, Billerica, MA, USA) provided by 7T Animal MRI Core Lab of the Molecular Imaging Center at National Taiwan University. Mice were imaged 1 h after intravenous injection of contrast enhancements. The parameters for acquiring MR imaging were: TR/TE = 841.9464/8.6404 ms; matrix size = 256 × 256, slice thickness = 5 mm, FOV = 5 cm × 5 cm, NEX = 10, total scan time = 3 min and 20 s. The images
were analyzed using an open-source image processing program (ImageJ) or RadiAnt DICOM Viewer (64-bit) (Medixant, Poznan, Poland). For homogeneous signals in the tumor, the signal for quantification was circled within the edge of the signal and normalized the circled area to acquire the MR intensity under the unit area for comparison. For heterogeneous signals in the tumor, the signal was acquired in each unit area using the crossline (Fig. 13A and 13C).
2.16 Inductively coupled plasma mass spectrometry (ICP-MS) to detect Gd
Cells were lysed in 1% SDS after in vitro MRI. The supernatants were gathered after centrifugation at 12000 rpm for 5 min. Afterward, nitrohydrochloric acid was added to the supernatants. After the dilution in 2% nitric acid (1/100X), the samples were filtered with a 0.45 μm filter. Eight standards containing GdCl3 concentrations of 0, 1, 3, 10, 30, 100, 300, and 1000 ppb were for calibration. The Gd concentration of the sample was acquired by 7700 e ICP-MS (Agilent Technologies Inc., Santa Clara, CA, USA)
2.17 Experiments on the cellular uptake of ICG
To test the intracellular uptake ability, 5 × 10⁵ or 1 × 10⁶ cells were seeded in 6-well plates for 1 day and treated with 50 or 300 µg/mL ICG (Millipore-Sigma, Missouri, USA) for 1 h. Cells were trypsinized before washed with PBS 3 times. Afterward, cells were washed once more with PBS. The ICG signal was detected by using a flow cytometer FACSCalibur instrument (BD, CA, USA) with the APC-Cy7 channel (785
nm) filter. In the same procedure mention in the above, ICG was examined by confocal microscopy using a TCS SP5 laser scanning microscope (Leica, Wetzlar, Germany) with a Cy5 filter. Besides, 2*104 cells or 2 × 10⁵ cells were seeded in 96-well black plates for 1 day before adding 0.4, 2, 10, 50, and 200 µg/mL ICG for 1 h and 4 h. After cells were washed 3 times with 1X PBS, the ICG signal was acquired using Spark 10M (Tecan Trading AG, Switzerland) and an in vivo spectrum imaging system (Xenogen, Perkin Elmer, MA, USA). All images were acquired using the same parameters (emission/excitation channel: ICG/ICG; exposure time: 1 min; binning: medium; lens aperture [f/stop]: 2; the field of view: 12 cm). The imaging data were presented in the units of radiant efficiency (p/s/cm2/sr)/(µW/cm2). The quantification of ICG intensity was using the average efficiency in the region of interest (ROI).
For the detection limit of cells in IVIS, 2 × 10⁶ cells were sprayed into 6-well plates one day before the addition of 50 µg/mL of ICG for 1 h. After cells were washed with 1×
PBS three times to remove the excess ICG and were performed series dilution into a 96-well black plate. The ICG signal was acquired using an in vivo imaging system (IVIS Spectrum; Xenogen, Perkin Elmer, MA, USA). All images were acquired using the same parameters mentioned above.
For the evaluation of inhibitors of transporters, 4 × 10⁴ cells were sprayed into 96-well plates one day before the treatments. Cells were pretreated with 1.25 mM Primovist, 2–
10 μM cyclosporin A (Millipore-Sigma, Billerica, MA, USA), emodin (Millipore-Sigma, Billerica, MA, USA), erythrosin B (Millipore-Sigma, Billerica, MA, USA), and 100 μM rifampicin (Millipore-Sigma, Billerica, MA, USA) for 30 min before adding 5 µM ICG for 1.5 h. Subsequently, cells were washed three times with 1× PBS and were detected using Spark 10M (Tecan Trading AG, Switzerland) and the IVIS. The ICG signal intensity was further normalized using data from an MTT assay.
2.18 Fluorescence and bioluminescence imaging in vivo and ex vivo
After the nude and SCID mice were subcutaneously administrated tumor cells for 3 weeks, they were intraperitoneally injected with 10 mg/kg of ICG (solvent: ddH2O).
Subsequently, the trend of ICG signal in the mice was traced by in vivo fluorescence imaging at 1, 4, 24, 48, 72, and 96 h post-injection using an IVIS50 imaging system (Xenogen, Perkin Elmer, MA, US). For ex vivo analysis, the mice were euthanized to measure the ICG signal intensity in tumors, liver, kidney, heart, lung, spleen, and intestine under IVIS at 2 d after the injection of 10 mg/kg of ICG. The blank control was the mice without ICG injection.
For the drug screening platform in vivo, nude mice were administrated with 1 mg/kg of ICG through intravenous injection 4 h after the oral gavage of 10 and 50 mg/kg of cyclosporin A (solvents: olive oil or cream). Afterward, the ICG signal in the liver was acquired using the IVIS at 15 min, 1 h, and 4 h after ICG injection. For the drug
screening platform ex vivo, mice were euthanized to measure the ICG signal intensity in organs under the IVIS after cyclosporin A injection for 1 h and followed 10 mg/kg of ICG administration for 1 h.
All images were acquired using the same parameters and presented as mentioned in the section of “Experiments on the cellular uptake of ICG”.
2.19 Luciferase assay
The lentiviral vectors AS2w.FLuc.Ppuro (Fig. 1H; the RNAi consortium at Academia Sinica) were used for the viral production. The viral production was mentioned before in the same condition using HT-1080. HT-1080 were transduced FLuc first and OATP1B3 for one week later to obtain FLuc and OATP1B3 double-positive HT-1080.
There were 5 × 10⁴ cells seeded in 96-well black plates for 1 day before the treatment of 94 µM d-Luciferin (Gold Biotechnology, St. Louis, MO). The OATP1B3 inhibitor, rifampicin, was pretreated for 30 mins before the addition of d-Luciferin. The plate was detected using TECAN SPARK 10M (Männedorf, Switzerland) after adding d-Luciferin at once. The RNA levels of FLuc and OATP1B3 were confirmed by reverse transcription-PCR (RT-PCR).
2.20 Statistical analyses
The data were presented as means ± standard errors (SEM) and had at least three biological replicates. Statistical analysis was performed using Student's t-test, Duncan's
new multiple range test, and Newman–Keuls and Dunnett’s multiple comparison tests were conducted to determine differences via GraphPad Prism 5 (* p < 0.05; # p < 0.01;
& p < 0.001).
第三章 Results
3.1 Confirmation of constructions
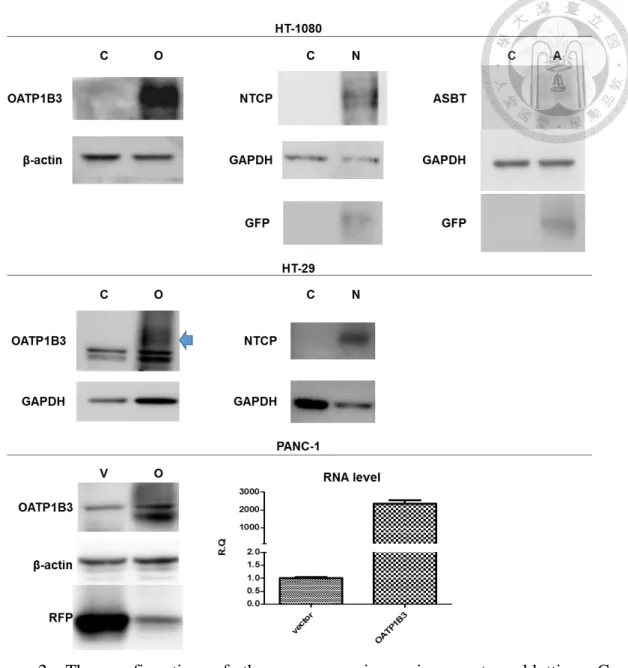
HT-1080, HT-29, and PANC-1 were transduced with OATP1B3, NTCP, or ASBT membrane transporters. In HT-1080, the plasmids used for overexpression were pWPXL-OATP1B3-ires-Puro, RC210241L2, and RC221202L2 (Fig. 1C, 1F, and 1G).
RC210241L2, and RC221202L2 contain GFP. The overexpressions of OATP1B3, NTCP-GFP, ASBT-GFP, and GFP in HT-1080 were validated by western blotting (Fig.
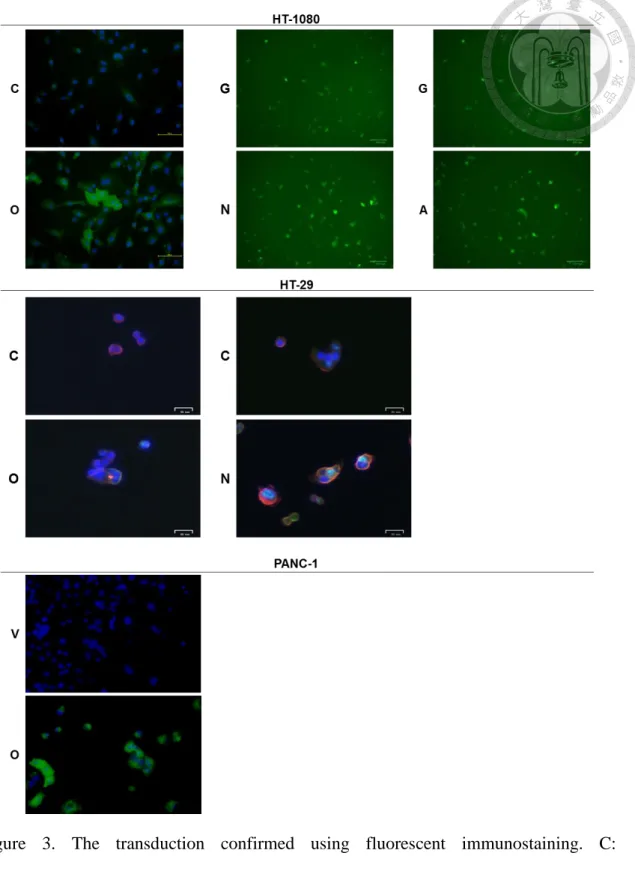
2). Further, the cellular location of OATP1B3 was visualized by OATP1B3 antibody in green color, and others were using GFP protein to locate the NCTP and ASBT (Fig. 3).
In HT-29, the plasmids used for overexpression were pWPXL NTCP-ires-Puro and pWPXL ASBT-ires-Puro (Fig. 1E and 1G). The overexpressed OATP1B3 and NTCP in HT-29 were confirmed by western blotting and immuno-fluorescent staining (Fig. 2 and 3). In PANC-1, the overexpression of OATP1B3 also confirmed by Q-PCR, western blotting, and immuno-fluorescent staining (Fig. 2 and 3).
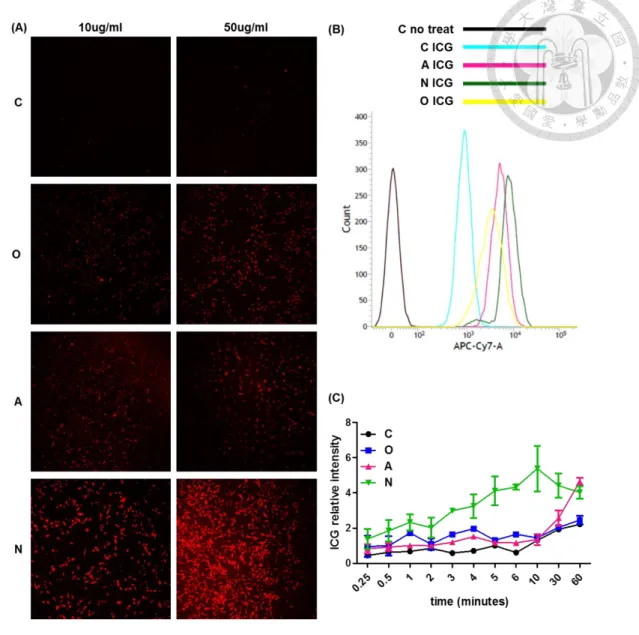
3.2 Evaluation of the intake capacity of ICG in vitro
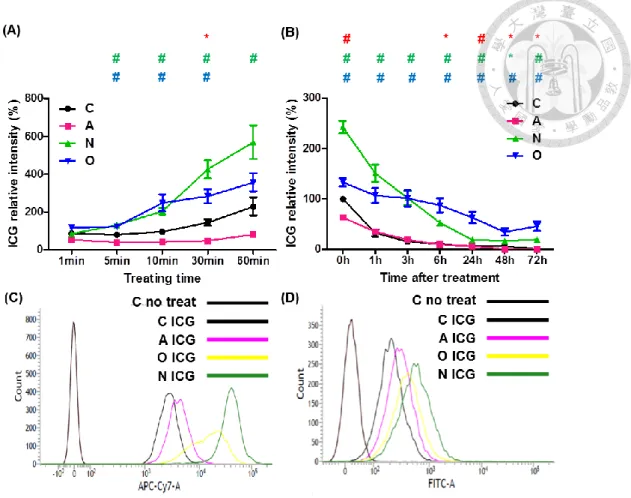
OATP1B3, NTCP, and ABST expressing HT-1080 had higher ICG intensity in confocal imaging, flow cytometry, and multimode detection platform data. Among them, the order of increased intake capacity of ICG was NTCP, ASBT, and OATP1B3 expressing HT-1080 (Fig. 4). Only OATP1B3 and NCTP expressing HT-29 remained a higher intake of ICG. Still, the intake of ICG was better in NTCP than OATP1B3 (Fig. 5 and 6).
The longer time for treating ICG, the higher ICG intensity was detected by the multimode detection platform. The difference of ICG intensity between NTCP and OATP1B3 expressing HT-29 was differentiated in 30 and 60 min treatments (Fig. 5A).
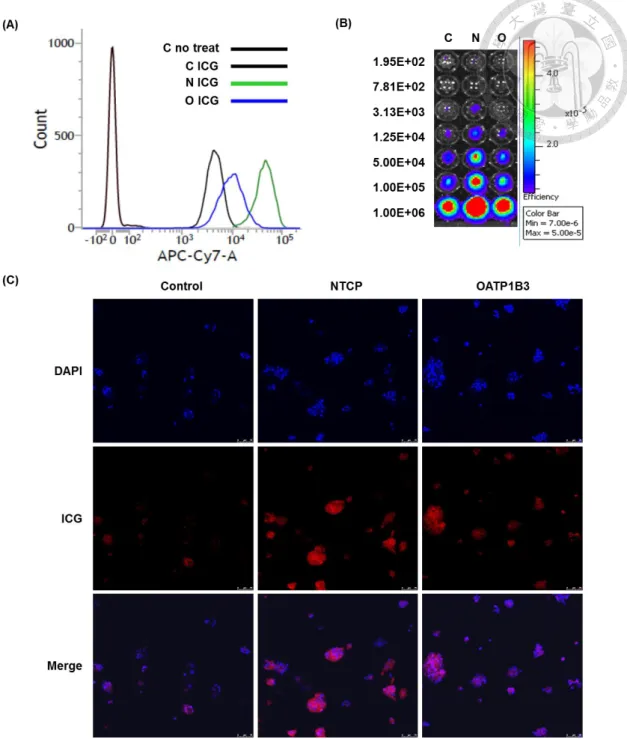
Moreover, OATP1B3 and NCTP expressing HT-29 could remain ICG in the cell at least for 72 h (Fig. 5B). The visualization of ICG in NTCP and OATP1B3 expressing HT-29 was using IVIS, and its detecting limitation was 3.13 x 10³ and 1.25 x 10⁴ in NTCP and OATP1B3 expressing HT-29, respectively (Fig. 6B).
3.3 Evaluation of the intake capacity of fluorescein isothiocyanate (FITC) in vitro
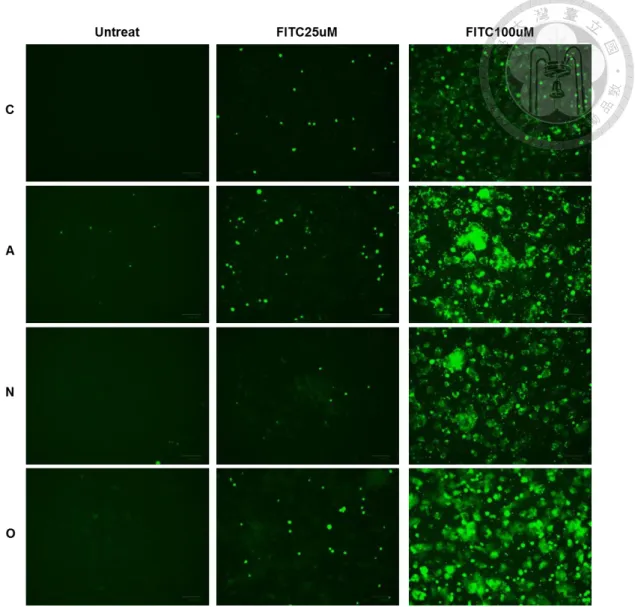
NaFluo, transported through OATP1B36, and fluorescein isothiocyanate (FITC) have a similar structure. We tested whether OATP1B3 was a FITC transporter. After treating 100μM FITC, the intake of FITC was increased in ASBT, NTCP, and OATP1B3 expressing HT-29 under fluorescent microscopy examining at 1 h after washing (Fig. 7) and showing in flow cytometry data (Fig. 5D).
3.4 Evaluation of the intake capacity of Primovist and other contrasts in vitro
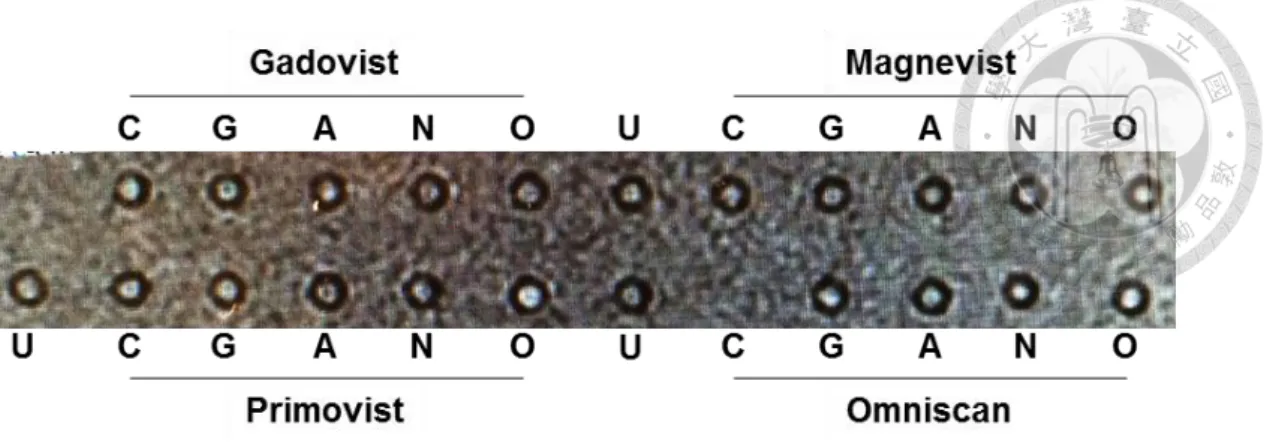
OATP1B3 had high specificity to Primovist instead of Gadovist, Magnevist, and Omniscan. Furthermore, ASBT and NTCP couldn’t serve as the transporters for these four Gd containing MR contrasts (Fig. 8).
3.5 Evaluation of the intake of ICG in vivo and ex vivo
After inoculating NCTP and OATP1B3 expressing HT-29 into nude mice and injecting ICG, the ICG signals were traced in a time-dependent manner. NTCP and OATP1B3 expressing HT-29 could retain the ICG for at least 72 h. Moreover, OATP1B3 expressing HT-29 had better retain the ability of ICG (Fig. 9). After 2 d ICG administration, all organs were examined using IVIS for ICG bio-distribution.
OATP1B3 expressing HT-29 tumor had the strongest ICG intensity, and the followings were liver, NTCP expressing HT-29 tumor, and the others (Fig. 10A and 10B). These HT-29 tumors have further confirmed the overexpression of NTCP and OATP1B3 using immunohistochemistry (Fig. 10C).
3.6 Evaluation of the intake of Primovist in vivo
After inoculating NCTP and OATP1B3 expressing HT-29 into nude mice for 11 d and injecting Primovist, the MR images were taken. Only OATP1B3 expressing HT-29 tumors with small size had elevated MRI intensity not interfered by tumor size (Fig.
11).
3.7 The application of OATP1B3 for tumor cell tracking using IVIS
After inoculating OATP1B3 expressing HT-1080 into nude mice, ICG was administrated through subcutaneous injection. The ICG signal was sustainable for at least 96 h (Fig. 12A and 12B). For validating the biodistribution of ICG, the mice with OATP1B3 expressing HT-1080 tumor was enthused at 2 d ICG injection. The OATP1B3 expressing HT-1080 tumor had the strongest ICG signal (Fig. 12C and 12D). At the endpoint, OATP1B3 expressing HT-1080 tumor remained higher OATP1B3 expression (Fig. 12E).
3.8 The application of OATP1B3 for tumor cell tracking using MRI
The nude mice bearing OATP1B3 expressing HT-1080 tumor was administrated Primovist through intravenous injection and detected in 7T-MRI. OATP1B3 expressing HT-1080 tumor had higher MR intensity (Fig. 13A and 13C). Moreover, the dark pattern in MR imaging was correlated to terminal deoxynucleotidyl transferase dUTP nick-end labeling (TUNEL) assay and histology indicating living cells had Primovist intake ability (Fig. 13B and 13C). The more comprehensive information could be revealed by MR imaging compared with IVIS imaging (Fig. 13C).
3.9 The application of OATP1B3 for PANC-1 islet-like cell tracking in cell therapy
We chose PANC-1 for the investigation of cell tracking in cell therapy since PANC-1 is a potential cell for treating diabetes64. After transduced OATP1B3 into PANC-1, the
Primovist intake ability was increased in vitro 3T-MRI and further confirmed the high quantity of Gd with ICP-MS (Fig. 14A and 14B). OATP1B3 overexpression doesn’t affect the cellular functions in mitochondria membrane potential, viability, and ROS reaction (Fig. 14C, 14D, and 14E). Moreover, the differentiation ability remained after OATP1B3 transduction into PANC-1, such as sphere formation, the expression of insulin (Ins) and glucagon (GCG) in RNA and protein levels (Fig. 15).
The SCID mice bearing with OATP1B3 expressing PANC-1 xenograft had a high MR signal after Primovist injection (Fig. 16A and 16C). At the endpoint, OATP1B3 expressing PANC-1 xenograft remained higher OATP1B3 expression (Fig. 16B).
Instead of tracing MR signal in vivo, the MR signal was tracked for 44 h in OATP1B3 expressing PANC-1 in vitro. The differentiation of MR signal was significant from the beginning to 2 h and OATP1B3 expressing PANC-1 still had insignificantly higher MR intensity at least for 28 h after Primovist washed out (Fig. 16D).
3.10 The utility of NTCP in a drug screening platform in vitro
To establish the drug screening platform for HBV through blocking NTCP, the candidate drugs (cyclosporin A, emodin, and erythrosin B) were treated first and added ICG for evaluating the possibility for the HBV treatment. The evaluation was confirmed by two methods; one is a multimode detection platform, and the other one is IVIS. Both methods represented similar results: cyclosporin A, emodin, and erythrosin B could
decrease ICG intensity indicating they could be the candidate drugs for HBV treatments (Fig. 17). Moreover, cyclosporin A treatment had a dose-dependent manner in ICG intensity in the multimode detection platform (Fig. 17C).
3.11 The application of OATP1B3 as a luminescent reporter
OATP1B3 and luciferase transduced into HT-1080 and the overexpression was confirmed in RNA level (Fig. 18A). Furthermore, the luminescent intensity was increased in OATP1B3 and Luciferase expressing HT-1080 compared with single Luciferase expressing HT-1080 (Fig. 18B). The luminescent intensity in OATP1B3 and Luciferase expressing HT-1080 was decreased after the inhibitor treatment (Fig. 18C).
第四章 Discussion
4.1 Importance for establishing new imaging modality
The discovery of GFP has opened an era for imaging since 19611. Many scientists explore the intercellular, intracellular, and molecular interactions, development, and cell tracking using optical imaging2–5. After that, more agents were discovered and used in different imaging modalities, such as CT65, PET14,15, MRI16–18 so that the medication make huge progress. The imaging modalities have their limitations like the penetration and the resolution66,67, the toxicity68–70, etc.. Hence, we attempted to investigate the feasibility of membrane transporters (ASBT, NTCP, and OATP1B3) as new reporter
genes applying in molecular imaging.
4.2 The comparison among ASBT, NTCP, and OATP1B3
ASBT, NTCP, and OATP1B3 could intake ICG and NTCP had the highest efficiency in vitro (Fig. 4, 5, and 6). However, OATP1B3 expressing tumor had higher ICG intensity than NTCP tumor in vivo and ex vivo (Fig. 9 and 10). Besides, ASBT, NTCP, and OATP1B3 were FITC transporters (Fig. 7). Furthermore, OATP1B3 could serve as an MR contrast, Primovist, transporter (Fig. 8 and 11) and luciferin transporter (Fig. 18).
From the above experiments, OATP1B3 had better feasibility as a reporter gene.
4.3 The retain of ICG in NTCP and OATP1B3 expressing cells
There was a high ability to retain ICG in OATP1B3 expressing cells than NTCP expressing cells. In the beginning, NTCP expressing cells contained more ICG. In
theoretically, NTCP expressing cells should highly retain ICG; however, the result showed the opposite situation. It might due to the orientation of NTCP wasn’t correct.
In normal status, the orientation of NTCP is outside-in. In NTCP expressing cells, some of NTCP might become inside-out so that ICG pumped out. Therefore, NTCP expressing cells had a lower ability to retain ICG than OATP1B3 expressing cells.
4.4 The limitation of detective depth
The inside structure in the deep tumor tissue can be visualized with the Primovist–MRI system. Our results showed that the viability of the tumor can be 3-dimensionally
detected with MRI; however, the ICG–IVIS system can only observe the overall tumor signals in a 2-dimension. Currently, PerkinElmer releases a new dual imaging modality which equipped both with IVIS and MRI. Thus, the images become more comparable since the dual IVIS and MR images can both be acquired in the same section.
4.5 Photoacoustic imaging (PAI)
Photoacoustic imaging (PAI), a powerful modality for molecular imaging, can capture the photo under the tissue at the depth of several centimeters with high resolution (100μm)71. Tyrosinase has been using as a reporter gene for photoacoustic molecular imaging. However, the application of tyrosinase is limited since its oxidizing product such as quinone or dopamine leads to potential toxicity72,73. The intrinsic chromophores contrast for PAI is effective for tumor detection and characterization because of the light absorption of hemoglobin, lipid, water, and melanin; however, the background absorption affects photo presentation71,74,75. Despite the fluorescent proteins such as GFP and RFP also can be visualized by PAI, they are not well applicable in PAI since the efficiency and photostability are limited76. ICG has been acknowledged as a favorable contrast for PAI since it has enormous nonradiative relaxation71. Currently, many studies illustrate that the expression of OATP is related to different levels of malignancies77. Thus, the application of ICG in PAI is the next question that needs further investigation.
4.6 Living cell addressing in MRI
Our OATP1B3-Primovist-MRI system could be applied in the visualization of apoptotic and necrotic cell patterns inside the tumor. Other MR contrasts could provide the tumor location/size and the vasculatures; however, it’s hard to know the cell viability. In our system, the cell viability could be easy to distinguish for evaluating the efficacy of anticancer drugs.
4.7 Bioluminescent imaging modality using OATP1B3
Bioluminescence is a powerful tool for applications in many fields such as cell viability, transcriptional activity, in vivo imaging, etc.78. It has been reported that OATP1B1 is a plasma membrane transporter for d-luciferin, the substrate of luciferase79. The bioluminescent cell tracking can be performed through the overexpression of OATP1B117. Our study also revealed the d-luciferin intake increased after OATP1B3 overexpression and repressed by OATP1B3 inhibitor, rifampicin (Fig. 18) indicating OATP1B3 could be a plasma membrane transporter for d-luciferin. Basing on this finding, we will further investigate the feasibility of OATP1B3 in the bioluminescent imaging modality of OATP1B3.
4.8 NTCP is Primovist-transporter; however, it was not in our observation
NCTP didn’t play a role in Primovist transportation in 1.5T MR image (Fig. 8); however, Leonhardt et al have reported that NCTP is one of Primovist transporter (Km = 0.04
mM, Vmax = 1.4 pmol/mg × min)44. The reason cause this difference might because of cell lines, the method to introduce NTCP, treating conditions, etc. Therefore, it is necessary to evaluate the transportability of transporters in different cell lines and different conditions for tracking particular tumor cells. Moreover, we could learn that OATP1B3 had better Primovist transportability than NTCP indicating OATP1B3 is an extraordinary reporter gene for combined IVIS and MRI systems (Fig. 11).
4.9 Drug screening platform
As mentioned in the introduction, OATP1B1 and OATP1B3 are major responding to drug absorption and affecting the health43. Besides, NTCP is the entry of HBV and HDV virus48. Furthermore, the existing systems for drug-drug interaction still have a space to do the improvement. Thus, we could verify the drug-drug interaction though OATP1B3/NTCP-ICG system.
4.10 The biosafety of fluorescent dyes and MR contrasts
Fluorophores as power media make optical imaging addressing cancer diagnosis easier.
The toxicity not only derives from fluorophores themselves also from their degradation byproducts69. Although the toxicity of 19 fluorophores (fluorescein, Alexa Fluor 488, Alexa Fluor 514, Tokyo green, BODIPY FL, BODIPY R6G, Cy 5.5, cypate, Oregon green, 8-phenyl BODIPY, rhodamine 110, rhodamine 6G, rhodamine X, rhodol, TAMRA, Texas red, Cy 7, and ICG) are not quite consistency from different literatures
because of different cell lines, animal models, and addressing methods, these fluorophores have high potential toxicity except for fluorescein and ICG which are approved by the FDA70. As mentioned before, ICG is an FDA approved NIR compound and its safety makes its extensive application. Currently, it is the outstanding fluorescent dye for cell monitoring.
Many MR contrasts contained gadolinium have the approval from the FDA; however, it has been reported that they have potential toxicity to the kidney and the brain68,80. Thus, the development of high bio-safe MR contrasts is the further question that needs to address.
4.11 Future exploration
1. To apply OATP1B3 dual reporter system for in vivo cell tracking such as cell therapy and cancer cell monitoring.
2. To evaluate the efficacy of OATP1B3 in different cell lines
3. To establish a drug-drug interaction system in ASBT, NTCP, and OATP1B3 using ICG for drug selection.
4. To establish a triple reporter system (luminance, fluorescence, and MRI) using OATP1B3
5. To explore more new bio-safe fluorophores and MR contrasts for molecular imaging
6. To explore whether NTCP is a d-luciferin transporter for a further imaging application.
References
1. Chudakov, D. M., Matz, M.V., Lukyanov, S. &Lukyanov, K. A. Fluorescent Proteins and Their Applications in Imaging Living Cells and Tissues. Physiol. Rev.
90, 1103–1163 (2010).
2. Rao, J., Dragulescu-Andrasi, A. &Yao, H. Fluorescence imaging in vivo: recent advances. Curr. Opin. Biotechnol. 18, 17–25 (2007).
3. Contag, C. H. &Bachmann, M. H. Advances in In Vivo Bioluminescence Imaging of Gene Expression. Annu. Rev. Biomed. Eng. 4, 235–260 (2002).
4. Bertrand, J. Y. et al. Haematopoietic stem cells derive directly from aortic endothelium during development. Nature 464, 108–11 (2010).
5. Hsieh, P. C. H. et al. Evidence from a genetic fate-mapping study that stem cells refresh adult mammalian cardiomyocytes after injury. Nat. Med. 13, 970–974 (2007).
6. DeBruyn, T., Fattah, S., Stieger, B., Augustijns, P. &Annaert, P. Sodium fluorescein is a probe substrate for hepatic drug transport mediated by OATP1B1 and OATP1B3. J. Pharm. Sci. 100, 5018–5030 (2011).
7. McArdle, S., Mikulski, Z. &Ley, K. Live cell imaging to understand monocyte, macrophage, and dendritic cell function in atherosclerosis. J. Exp. Med. 213,