The accelerated method for estimating corrosion of reinforced concrete structure in seawater
Wen-Po Tsai, How-Ji Chen, Huang-Hsing Pan, and Kung-Chung Hsug Department of Civil Engineering
National Chung-Hsing University Taichung, Taiwan
ABSTRACT
The corrosion of concrete for offshore structures is generally caused by the penetration of chloride ion deriving from the salts in seawater. Up to now, lots of researches have been done concerning the corrosion of concrete by seawater and durability of concrete. However, the investigation for corrosion of reinforced concrete structure by seawater are relatively rare, because of the needs for long term tests (at least 3 to 5 years usually). The structures sited in the intertidal zone always accompany severer deterioration by seawater. Under such environmental conditions, frequent wetting and drying will aggravate the effect of sulfate attack, while the crystallization of sea salts in the concrete on evaporation may also contribute to expansive forces. For these reasons above, the purpose of this paper is to study the corrosion of reinforced concrete structure in the intertidal zone by a accelerated method presented.
The critical variables considered in this research include the temperature and concentration of seawater. During the experimental period (1 year), the specimens were cured in wetting and drying situation (for each circle, submerged by seawater for 24 hours and then drying at 70℃
for the following 24 hours), and this repeatedly cyclic procedures is to accelerate the corrosion of reinforced concrete structure by seawater. According to the experimental results, the increased concentration and temperature of seawater would accelerate deterioration of concrete obviously. The duration of testing could be shortened about 75% by using the sweater with 10 times the concentration. As the curing temperature increased, the corresponding strength concrete at earlier age would increase, and which could reduce the corrosion of reinforced concrete.
Keywords: durability of concrete, the accelerated method to estimate corrosion of concrete, corrosion of concrete by seawater
1. Introduction
For reinforced concrete structures, the major factors against durability could be attributed to the deteriorated concrete quality and corrosion on the embedded reinforcing bars in general.
Those causing decay on concrete properties could be further divided into two aspects
originated from the internal (intrinsic essence of concrete) and external (environmental conditions) effects. The internal factors of concrete include water to cement ratio (w/c), the type of cement, aggregate, and the use of mineral (such as fly ash, silica fume, and blast furnace slag) and chemical admixture, etc. Besides, the external conditions are influenced by the environmental humidity and temperature, concentration of carbon dioxide (CO 2 ), and other detrimental substances, which would lead to certain changes in chemical and physical properties of concrete itself, and thus the expansive cracking and connected porosity are likely to occur inside concrete. On the other hand, the appearance of steel corrosion is primarily in connection with the penetration of chloride ions, carbonation, and oxidation-reduction reaction which will generate the expanded products resulting in cracking in concrete and increase the exposed extent of steels. Under such vicious circles, the likelihood that unfavorable ions penetrating into concrete will be gradually enhanced [1].
2. Experimental programs 2.1 Materials
2.1.1 Cement
ASTM TypeⅠ Portland cement was used. The chemical compositions and physical properties of the cement are given in Table 1.
Table 1 Chemical compositions and physical properties of cement
Chemical composition Physical properties SiO 2 Al 2 O 3 Fe 2 O 3 CaO MgO SO 3 LOI Specific
gravity Specific surface 19.8% 5.88% 3.61% 62.85% 3.64% 2.13% 0.74 3.15 3400 cm 2 /g
2.1.2. Aggregates
The fine aggregates were local natural river sand with fine modulus of 2.88, absorption of 1.28% and density (SSD) of 2.61 g/cm 3 . The coarse aggregates were crushed quartzite with
maximum nominal size of 20 mm, absorption of 1.12%, and density (SSD) of 2.62 g/cm 3 .
2.1.3. Artificial seawater
In this study, the chemical compositions of artificial seawater compounded conform to the specification of ASTM D1141-90 summarized in Tables 2. There were three types of concentration of artificial seawater (1, 5 and 10 times) used for the subsequent tests.
Table 2 Chemical composition of artificial seawater
Compound NaCl MgCl 2 Na 2 SO 4 CaCl 2 KCl NaHCO 3 KBr H 3 BO 3 SrCl 2 NaF Concentration
(g/L) 24.53 5.20 4.09 1.16 0.695 0.201 0.101 0.027 0.025 0.003
2.2. Mixture proportions
As shown in Tables 3, two target strengths of 20 and 35 MPa (210 and 350 kgf/cm 2 ) at 28 days with the target slump of 120 mm were decided for mixture proportions. The criteria for mix proportioning selection were that the concrete should be readily available, and not require any reactive admixtures to reach the target strength and slump both.
Table 3 Mixture proportions (kg/m 3 )
Aggregate Batch Air content w/c Cement Water
Fine Coarse N20* 1.5% 0.68 300 203 718 1078 N35* 1.5% 0.50 390 195 645 1078
*20 and 35 designates the target strength of 20 MPa and 35 MPa respectively.
2.3. Curing conditions
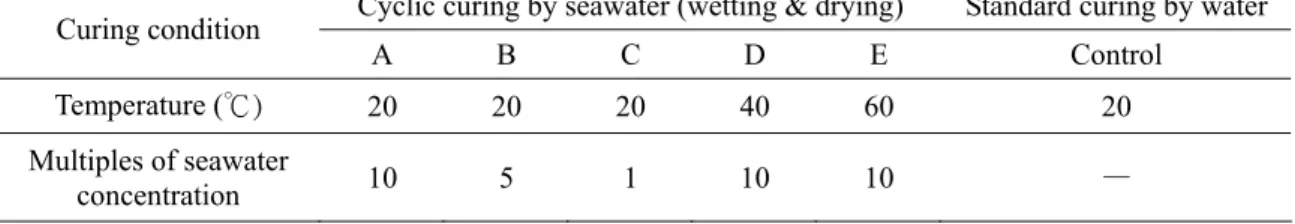
The curing conditions for all specimens exposed were shown in Table 4. After casting, all specimens were left in molds for 24 hr. After 24 hr, the specimens were demolded and moved into a curing pool. The temperature of water in the curing pool was maintained at 20 ℃.
After 7-day water curing, partial specimens (except for control ones still left behind) were changed to be cured in seawater by repeatedly wetting and drying circles (curing condition A~E). For each circle, the specimens were submerged by seawater for 24 hours and then drying at 70℃ for the following 24 hours.
Table 4 Curing conditions
Cyclic curing by seawater (wetting & drying) Standard curing by water Curing condition
A B C D E Control
Temperature (℃) 20 20 20 40 60 20
Multiples of seawater
concentration 10 5 1 10 10 —
2.4. Specimen dimensions and testing details 2.4.1. Compressive strength test
Compressive strength tests were performed on Φ100×200 mm concrete cylinder at age of 28, 56, 90 and 180 days. For each age, the compressive strength was averaged from three specimens tested.
2.4.2. Electric resistance test
Electric resistance tests were also performed on concrete cylinders at the same age of
compressive strength tests. The electric resistance values were measured by a resistivity
meter on the specimen surface.
2.4.3. Permeability test
For permeability tests, the testing specimens (Φ100×200 mm concrete cylinder) and ages (28, 56, 90 and 180 days) were identical with compressive strength and electric resistance tests. The period during test would take one hour and the pressure of water applied on specimens was 0.1 MPa (1 kgf/cm 2 ). All specimens should be treated as oven dry at 80℃ and weighted before permeability tests. Then the permeability of specimens could be determined by the extent of increased weigh measured after testing from the initial oven-dry condition.
2.4.4. Carbonation test
The carbonation tests were conducted on the split concrete cylinder specimens by seawater curing at the tested ages. The phenolphthalein solution (1% phenolphthalein in alcohol) was sprinkled on the broken surface of specimens. The color of phenolphthalein solution would change to be purple-red if the carbonation occurring in concrete. The degree of carbonation for specimens could be obtained by measuring the depth from the broken surface of specimens (with purple-red color) to the interface without being colored.
3. Results and discussion 3.1. Compressive strength
The compressive strengths of concrete with varied curing situation are shown in Figs.1 and 2. From Fig.1(a) and (b), after the age of 90 days, the compressive strength of specimens cured by seawater were lower than that by standard-water curing about 25%~40%. This strength reduction could be attributed to that the chemical compounds in seawater (such as NaCl, MgCl 2 , MgSO 4 , and CaSO 4 ) would decompose the C-S-H gels in cement paste, reduce the pH values of concrete (with CH crystals separated out), and cause the secondary expansion (with ettringite formed). However, for curing temperature of 20℃, there were no obvious differences between the development of compressive strength and seawater concentration could be found in Fig.1(a).
In Fig.2, for the specimens cured by high temperature seawater (40 and 60℃), the compressive strength are close to that with standard-water curing until the age of 90 days.
However, after 90 days, the 180-day compressive strength of specimens cured by high temperature seawater compared with those with standard-water curing reduced to only 70%.
This is probably because the high curing temperature would increase the rate of hydration to
form the hydration products incompletely in cement paste and make concrete tend to possess
higher strength at earlier age. Nevertheless, this tendency is harmful to the long-term strength
development of concrete because the rapid initial hydration and the formation of defective
hydration products will bring about the larger amount of capillary pores existing in cement
paste.
N21 (20℃)
0 100 200 300 400 500
0 7 14 28 56 90 180
Ages(Days) C om pr es si ve st re ngt h( kgf /c m
2)
water curing 10 times 5 times 1 times
f
N35 (20℃)
0 100 200 300 400 500
0 7 14 28 56 90 180
Age(Days) C om pre ss iv e st re ng th (k gf /c m
2)
water curing 10 times 5 times 1 times
(a) N20 specimen (b) N35 specimen Fig.1 The development of compressive strength for cured at 20℃
with varied seawater concentrations (1, 5 and 10 times)
N21 ( concentration of 10 times)
0 100 200 300 400 500
0 7 14 28 56 90 180
Age(Days) Co m pr essi ve tr en gt h( kgf /c m 2)
water curing 20℃
40℃
60℃
N35 ( concentration of 10 times)