The Design of Control System and Power
Conditioning System for a 25-kW Active-control Based Wind Turbine System
Yung-Ruei Chang, Chen-Min Chan, and Chin-Jen Chang Engineering Technology & Facility Operation Division
Institute of Nuclear Energy Research Taoyuan, Taiwan (R.O.C.)
Abstract—This paper focuses on the design and technical specifications of 25-kW PMSG wind turbine system, INER-C25A, which has been undergoing field-testing since March, 2009. Three major parts of INER-C25A including the infrastructure of control system, wind turbine control strategy, and the power conditioning system will be illustrated in this paper. With the LabVIEW (Laboratory Virtual Instrument Engineering Workbench) graphical interface software tool, the embedded control system, the CompactRIO system with NI I/O modules, links sensors and drivers of sub-systems (Pitch, Yaw, and Brake) to obtain instant data and precisely control these sub-systems. By analyzing all sensor signals such as wind direction/speed, rotor speed, and temperature, the control system drives the wind turbine to trace the wind direction and to regulate the optimal pitching angle for MPPT (Maximize Power Point Tracking). The electric power generated from a PM generator is delivered to the utility grid by a 36 kW grid-tied inverter with an output voltage of 220 V/380 V (60 Hz, 3φ). The development of the control system is not only beneficial for the next generation of a new 150- kW wind turbine system, but also for establishing the design capability for the control system of large wind turbine system in Taiwan.
Keywords-Active-control; Wind Turbine System; Embedded Control System; Grid-tied Inverter.
I. INTRODUCTION
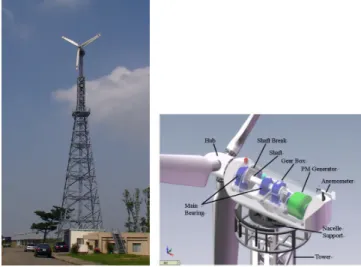
Based on system integration capability in nuclear technology, the Institute of Nuclear Energy Research (INER) has turned his research direction from nuclear area into renewable energy area since 2005. On March 2009, a 25-kW PMSG wind turbine system (INER-C25A) was set up successfully at the energy park of INER (as shown in Fig. 1) and has been undergoing field-testing. This paper focuses on the design and technical specification of INER-C25A including the infrastructure of control system, the wind turbine control strategy, and the power conditioning system. With the LabVIEW (Laboratory Virtual Instrument Engineering Workbench) graphical interface software tool, the embedded control system, the CompactRIO system with NI I/O modules, links sensors and drivers of sub-systems (Pitch, Yaw, and Brake) to obtain instant data and precisely control these sub- systems. By analyzing all sensor signals such as wind direction, wind speed, rotor speed, and temperature, the control system drives the wind turbine to trace the wind direction and to
regulate the optimal pitching angle for MPPT (Maximize Power Point Tracking). The electric power generated from a PM generator is delivered to the utility grid through a 36 kW grid-tied inverter with an output voltage of 220 V/380 V (60 Hz, 3φ). The development of the control system is not only beneficial for the next generation of a new 150-kW wind turbine system, but also for establishing the design capability for the control system of large wind turbine system in Taiwan.
In this paper, Section II describes the hardware and the control strategy of the wind turbine control system. A back-to-back power conditioning system with MPPT is illustrated in Section III. Section IV depicts a 200-kW ground test platform and field test results. Section V gives some conclusions and future works.
Figure 1. A 25-kW PMSG wind turbine system (INER-C25A) at the energy park of INER.
II. THE INFRASTRUCTURE OF CONTROL SYSTEM This section introduces the safety and control design of the INER-C25A wind turbine system, which is expected to fulfill the requirements of IEC-WT-01 Section 12.2.2 under the design compliance of IEC-61400-2. The main hardware infrastructure of the control system is as shown in Fig. 2. A control strategy is well developed based on this infrastructure.
The purpose of the control strategy is to harvest maximum wind energy and, meanwhile, to control the action of
mechanical subsystems including blade pitch, yaw and brake, to precisely response to the operation conditions. Two procedures (Fig. 3) are specified for the wind turbine control—
Normal procedure (automatic mode) and Exceptional procedure (manual mode), these procedures serve as the basis of system operation. Normally, the system is placed at
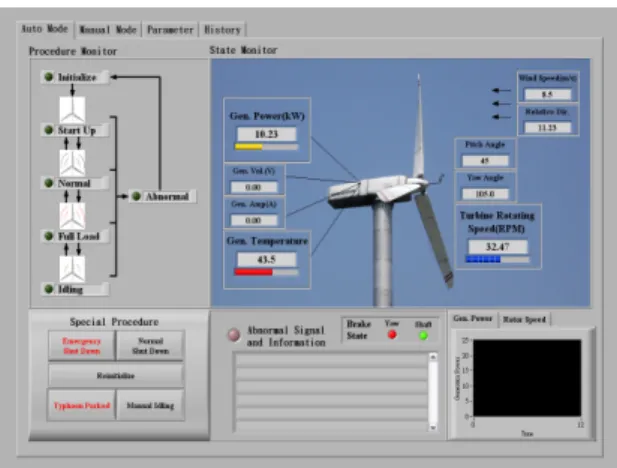
automatic mode. In some certain circumstances, such as typhoon, maintenance, and emergency, the control system can be switched to manual mode to make wind turbine operate at the exceptional procedure for secure operations or maintenances. The control and monitoring architecture uses the CompactRIO hardware [1] and the LabVIEW graphical software as the control interface (Fig. 4), and enables INER- C25A to receive all sensor signals including wind direction, wind speed, rotor speed, and temperature, and to appropriately control the subsystems to response to highly changeable wind conditions for obtaining the maximum wind energy [2]. Fig. 5 shows the primary parts of the control system.
III. POWER CONDITIONING SYSTEM
In this section, we introduce the 25-kW PM generator and the 36-kW three-phase grid-tied power conditioning system of INER-C25A.
For the PM generator (Fig. 6), the specification is as followings: 1) outer rotor structure, 2) 42 poles and 45 slots, 3) rated speed: 300 rpm, 4) line-to-line output voltage: 380 Vrms, 5) 350 kg. The efficiency of this PM generator is 93.4% at rated speed of 300 rpm. Fig. 7 shows the efficiency curves under different load conditions. Most of the efficiency is more than 91% when the speed is above half of the rated speed.
A survey of recent literatures [3][4] shows many three- phase grid-tied back-to-back converters with MPPT algorithm were proposed. In addition, low voltage ride through (LVRT) technology [5] even for zero voltage ride through (ZVRT) technology are also actively under development. In the power
cRIO-9 211 CRIO- 9211 Tem per ature
( 3)
CRIO- 9201 Wind Speed Wind Di recti on
Pitch
cRIO -9401
Yaw
FPGA cRIO-9104 (or FPGA cRIO-9102
Relay ( 2)
Ya w Br ake
RT-Con tro ller cRIO-9 002 RT-Con tro ller cRIO- 9004 PCI Bus CRI O-94 81
PC cRIO -94 01
CRIO-9 263
Limit Switches (2)
Relay ( 2)
Shaft Brake Pressure
(4)
Low Oil Ov er Oil T emp.
CRI O-94 01 CRIO -940 1 CRIO- 9401
CRIO- 9401 Pitch
Encoder Yaw
Encoder Blade Encoder F ilter
Et her net cRIO-9 211
CRIO- 9211 Tem per ature
( 3)
CRIO- 9201 Wind Speed Wind Di recti on
Pitch
cRIO -9401
Yaw
FPGA cRIO-9104 (or FPGA cRIO-9102
Relay ( 2)
Ya w Br ake
RT-Con tro ller cRIO-9 002 RT-Con tro ller cRIO- 9004 PCI Bus CRI O-94 81
PC PC cRIO -94 01
CRIO-9 263
Limit Switches (2) Limit Switches
(2)
Relay ( 2)
Shaft Brake Pressure
(4)
Low Oil Ov er Oil T emp.
CRI O-94 01 CRIO -940 1 CRIO- 9401
CRIO- 9401 Pitch
Encoder Yaw
Encoder Blade Encoder F ilter
Et her net
Figure 2. Control and Monitoring Architecture of INER-C25A.
(Note-1) A permanent resident progrm enables frequently check the following abnorml events : Event 1: Controller Abnormal Signals Event 2: Position Abnormal Signals Event 3: Loss of Grid Power Event 4: Temperature Abnormal Signals Event 5: Rotor Over Speed Signals Event 6: Reserved . Event 99: User Interuption Va ve< Vcut-in
System Initialization System Startup
Normal Operation
Rated Power Operation
System Idling
Abnormal (Note-1) Enables「Abnormal Flag」
Abnormal Condition Released
Abnormal Vave > Vcut-in
Vave< Vrated Vave > Vrated
Vave< Vcut-out Vav e > Vcut-out
Normal Stop
Normal Procedure
Exceptional Procedure
Emergency Stop (Scram + Break)
Typhoon
Mode Manual
Idling Normal Stop
(+Break)
Reinitializing System
Initialization
Figure 3. The control flow diagram of Normal Procedure and Exceptional Procedure.
Figure 4. User interface for Normal Procedure.
Anemometer
CompactRIO Hydraulic
PLC
Encoder Limit Switch
Monitoring PC
Anemometer
CompactRIO Hydraulic
PLC
Encoder Limit Switch
Monitoring PC
Figure 5. Laboratory installation to authenticate each critical sensor.
Figure 6. The prototype and stator structure of the 25-kW PM generator.
conditioning system of INER-C25A system, for cost down reason, we choose three tiers for power conversion (Fig. 8).
The first tier is only a three-phase rectifier for ac/dc conversion.
The second tier is a booster for regulating dc bus at 600V. The last tier is a three-phase grid-tied dc/ac inverter. The closed- loop control methodology of the compensator we chose is voltage feed-forward and current-loop control [6]. The control block diagram is as shown in Fig. 9, where, from (1) to (4), Gc(s) is the compensator, Fm(s) is the gain between the value of
DSP duty-control register to the duty of PWM, Gid(s) is the plant transfer function, and Hi(s) is the gain of sensor circuits.
The overall simulation result [7] is as shown in Fig. 10. The specification of main components in the power conditioning system is as followings: 1) IGBT: Mitsubishi, CM299DY-24H, 200A, 1200V; 2) Rectifier: NELL, NKD90/16, 90 A, 1600 V;
3) Hall CT: LEM, HAS100-S, 100 A/4V; 4) DSP: Microchip, dsPIC30F4011, 5) LC filter: 0.8 mH, 30 uF.
s K K s
Gc( )= p + i (1)
d to cmpr ratio
m r
F
_ _ _
= 1 (2)
i id dc
sL R s V
G ( )= + (3)
gain DSP ratio CT
i s G G
H ( )= _ × _ (4)
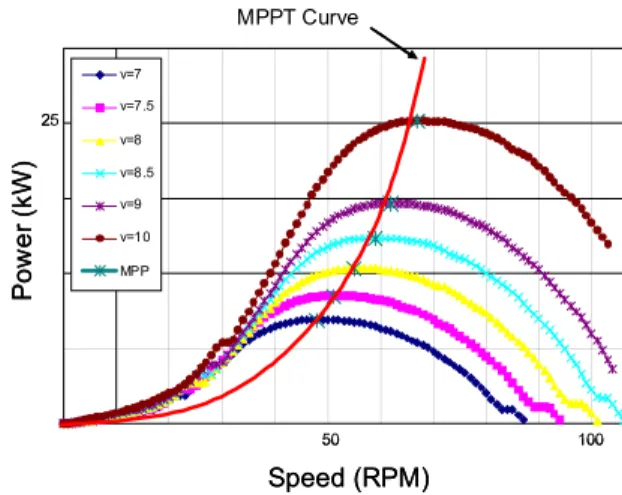
The MPPT control curve (power v.s. rotor speed) strongly depends on wind speeds and the aerodynamics of wind blades [8]. Fig. 11 depicts the MPPT control curve which is obtained from CFD calculation results under different wind speeds and rotor speeds. Therefore, for appropriately matching the characteristic between rotor speed and power converter, we use a I-V curve (current v.s. voltage, as shown in Fig. 12) lookup table for MPPT control strategy, where voltage is proportional to the generator rotor speed and current is proportional to the output power that we plan to extract by the power converter, respectively.
IV. GROUND TEST AND FIELD TEST RESULTS
To verify the performance and important design parameters of the wind turbine before real field testing, a 200-kW ground
Speed (rpm)
Efficiency (%)
75 80 85 90 95
0 5 0 1 0 0 15 0 2 00 25 0 3 00 35 0
3 0 k W 2 5 k W 2 0 k W Load
Speed (rpm)
Efficiency (%)
75 80 85 90 95
0 5 0 1 0 0 15 0 2 00 25 0 3 00 35 0
3 0 k W 2 5 k W 2 0 k W Load
Figure 7. The efficiency curve of 25-kW PM generator under different load condition.
dc/dc ac/dc dc/dc dc/ac
ac/dc dc/ac
Figure 8. Schematics and product of the 36-kW three-tier three-phase grid- tied power conditioning system.
Gc(s) Fm(s) Gid(s)
Hi(s) ug(t)
vd(t) d Ierr
Ifb Iref
+- ++
Io Gc(s) Fm(s) Gid(s)
Hi(s) ug(t)
vd(t) d Ierr
Ifb Iref
+- ++
Io
Figure 9. Block diagram of control system of INER-C25A.
Figure 10. Simulation result of power conditioning system.
v=7 v=7.5 v=8 v=8.5 v=9 v=10 MPP
Speed (RPM)
Power (kW)
MPPT Curve
100 50
25 v=7 v=7.5 v=8 v=8.5 v=9 v=10 MPP
Speed (RPM)
Power (kW)
MPPT Curve
100 50
25
Figure 11. The MPPT control curve which is obtained from CFD calculation results.
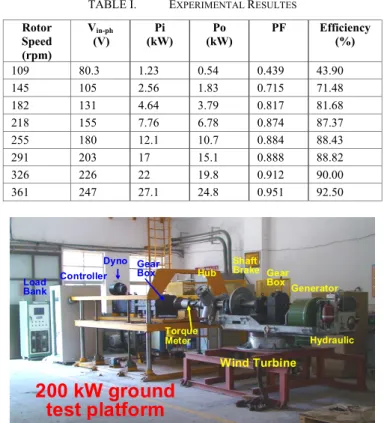
test platform (or Dyno) is built up at a machine shop of INER.
Once we have finished the assembling of wind turbine system excluding blades, we directly connect the rotor shaft of the wind turbine system with this Dyno (Fig. 13) and then, perform system functionalities and power performance tests. Different from traditional ground test platforms which can only provide fixed rotor speed or fixed torque testing, our Dyno can provide specific wind blade output behavior (rpm v.s. N-m) [9][10]
with respect to different wind speeds calculated from CFD. The output torque of the Dyno is set to be dependent on rotor speed at any presumed wind speed. It means the test platform can simulate variable wind speed conditions or even a gust.
Moreover, if we put different parameters calculated from CFD according to different blade shapes, we can simulate the blade output belonging to that blade shape. That means we can test different kinds of blade performances in this ground test platform. It is very helpful for the design and test of the MPPT algorithm of power conditioning system under different wind speed conditions. The control system of the test platform is implemented by MATLAB/Simulink with a µ-box hardware which can be easy for modeling and integrating dynamic behaviors of blade and system. Fig. 14 illustrates the user interface of the control system at fixed wind speed mode and gust mode, respectively. In Fig. 14(b), we can see the power conditioning system makes the wind turbine operate at red points under variable wind speeds, which means it operates at maximum power point and fits the MPPT control curve well.
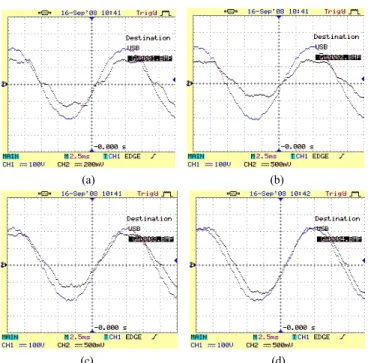
Fig. 15 shows the measured output voltage and current curve under 9 kW, 18 kW, 27 kW, 36 kW load conditions by connecting wind turbine system with the ground test platform.
The THD decreases with the increase of load. The THD and the efficiency are 3.84% and 92.5% at rated power of 25 kW, respectively. The experimental results of output power, power factor, and system efficiency under different rotor speeds are illustrated in Table 1.
Since March 2009, INER-C25A has practically been tested at the energy park of INER. Fig. 16 depicts the measured data of wind speed, generator power and rotor speed in Phase I of field tests. It should be noted that the peak output power achieves 25 kW at 58 rpm rotor speed and around 10 m/s averaged wind speed, which broadly meets what we designed and expected. In Phase II of field tests, we will raise up the rotor speed limitation to 65 rpm to perform larger power testing and verify the functionality of the protection mechanism.
0 5 10 15 20 25 30 35 40
0 50 100 150 200 250 300 350 400 450 500
Output Voltage (V)
Output Current (A)
0 5 10 15 20 25 30 35 40
0 50 100 150 200 250 300 350 400 450 500
Output Voltage (V)
Output Current (A)
Figure 12. I-V control curve corresponding to the MPPT control curve.
TABLE I. EXPERIMENTAL RESULTES Rotor
Speed (rpm)
Vin-ph
(V)
Pi (kW)
Po (kW)
PF Efficiency (%)
109 80.3 1.23 0.54 0.439 43.90
145 105 2.56 1.83 0.715 71.48
182 131 4.64 3.79 0.817 81.68
218 155 7.76 6.78 0.874 87.37
255 180 12.1 10.7 0.884 88.43
291 203 17 15.1 0.888 88.82
326 226 22 19.8 0.912 90.00
361 247 27.1 24.8 0.951 92.50
Wind Turbine Hub
Generator GearBox Shaft Brake
Torque Meter GearBox
200 kW ground test platform
Load Bank
Dyno Controller
Hydraulic Wind Turbine
Hub
Generator GearBox Shaft Brake
Torque Meter GearBox
200 kW ground test platform
Load Bank
Dyno Controller
Hydraulic
Figure 13. The 200-kW ground test platform.
(a)
(b)
Figure 14. The user interface of the control system in (a) fixed wind speed mode and (b) gust mode.
Although, it still needs efforts to improve the system performance and the THD reduction by adjusting the parameters of the MPPT control curve, however, we believe the success of INER-C25A brings us great encouragement and experiences for designing and testing a wind turbine system in the future.
V. CONCLUSIONS AND FUTURE WORKS
The control system and control strategy are the core technologies for a wind turbine system. Different control strategies should be applied on different wind turbine systems to maximize wind energy extraction and to optimize the protection of mechanical structures during operation. The success of INER-C25A represents not only a well established system design capability of medium size wind turbine in Taiwan, but also the possibility for designing a large wind turbine system in the future. In conclusion, the collection and analysis of the operational data will be the focus in the near future and therefore, how to design the effective way to feedback these operational data into early design phase will be the important issue in upcoming works.
REFERENCES [1] http://www.ni.com.tw.
[2] Z. XinfangDaping, X. Daping, and L. Yibing, "Intelligent control for large-scale variable speed variable pitch wind turbines", Journal of Control Theory and Applications, vol. 3, pp. 305–311, 2004.
[3] Blaabjerg, F., Chen, Z., and Kjaer, S.B. ‘Power electronics as efficient interface in dispersed power generation systems’, IEEE Trans. on Power Electronics, vol. 19, no. 5, pp. 1184–1194, 2004.
[4] N. Mohan, T.M. Undeland, and W.P. Robbins, Power electronics:
converters, applications, and design, John Wiley & Sons, New York, 1995.
[5] M. Molinas, Jon Are Suul, T. Undeland, ” Low Voltage Ride Through of Wind Farms With Cage Generators: STATCOM Versus SVC”, IEEE Trans. on Power Electronics, vol. 23, no. 3, pp. 1104-1117, May 2008.
[6] M. Kazmierkowski, R. Krishnan, F. Blaabjerg, Control in Power Electronics, Selected Problems, Academic Press 2002, ISBN 0-12- 402772-5.
[7] H. M. Kojabadi, L. Chang, and T. Boutot, “Development of a novel wind turbine simulator for wind energy conversion systems using an inverter-controlled induction motor”, IEEE Trans. on Energy Conversion, vol. 19, no. 3, pp. 547–552, 2004.
[8] Q. Wang and L. Chang, “An intelligent maximum power extraction algorithm for inverter-based variable speed wind turbine systems”, IEEE Trans. on Energy Conversion., vol. 19, no. 5, pp. 1242–1249, 2004.
[9] D. C. Quarton, G. Hassan, and P Ltd, “The evolution of wind turbine design analysis-a twenty year progress review”, Wind Energy, vol. 1, pp.
5–24, 1998.
[10] Z. Chen and E. Spooner, “Grid Power Quality with Variable Speed Wind Turbines,” IEEE Trans. on Energy Conversion, vol. 16, no. 2, pp.
148–154, 2001.
(a) (b)
(c) (d)
Figure 15. The measured output voltage and current curve under (a) 9 kW, (b) 18 kW, (c) 27 kW, and (d) 36 kW load condition.
0 250 500 750 1000 1250 1500
0 5 10 15
Wind Speed (m/s)
0 250 500 750 1000 1250 1500
0 10 20 30
Generator Power (kW)
0 250 500 750 1000 1250 1500
0 20 40 60
Rotor Speed (RPM)
Time (s)
Figure 16. The measured data of wind speed, generator power and rotor speed in Phase I of field tests