行政院國家科學委員會專題研究計畫 成果報告
磁振造影肺部微灌流影像在先天性心臟病患者之定量分析 研究成果報告(精簡版)
計 畫 類 別 : 個別型
計 畫 編 號 : NSC 98-2221-E-011-094-
執 行 期 間 : 98 年 08 月 01 日至 99 年 07 月 31 日 執 行 單 位 : 國立臺灣科技大學電子工程系
計 畫 主 持 人 : 林益如 共 同 主 持 人 : 吳銘庭
計畫參與人員: 碩士班研究生-兼任助理人員:張家榮 碩士班研究生-兼任助理人員:陳星儒 碩士班研究生-兼任助理人員:盧勁佑
報 告 附 件 : 出席國際會議研究心得報告及發表論文
處 理 方 式 : 本計畫可公開查詢
中 華 民 國 99 年 10 月 31 日
行政院國家科學委員會補助專題研究計畫 ■ 成 果 報 告
□期中進度報告
磁振造影肺部微灌流影像在先天性心臟病患者之定量分析 計畫類別:■ 個別型計畫 □ 整合型計畫
計畫編號:NSC 98-2221-E-011-094
執行期間: 98 年 08 月 01 日至 99 年 07 月 31 日
計畫主持人:林益如 共同主持人:吳銘庭
計畫參與人員: 盧勁佑 張家榮 陳星儒
成果報告類型(依經費核定清單規定繳交):■精簡報告 □完整 報告
本成果報告包括以下應繳交之附件:
□赴國外出差或研習心得報告一份
□赴大陸地區出差或研習心得報告一份
■出席國際學術會議心得報告及發表之論文各一份
□國際合作研究計畫國外研究報告書一份
處理方式:除產學合作研究計畫、提升產業技術及人才培育研究 計畫、列管計畫及下列情形者外,得立即公開查詢 □涉及專利或其他智慧財產權,□一年□二年後可公開查詢
執行單位:
中 華 民 國 99 年 10 月 20 日
前言
The accurate assessment of lung perfusion is important to understand the physiology and pathophysiology of the lung. Changes in regional lung perfusion can be observed in several pulmonary diseases, including lung cancer, pulmonary embolism (1,2). It can also be observed in cardiovacular diseases, such as pulmonary stenosis (3,4). Accurate assessment of pulmonary perfusion is especially important for many cardiopulmonary disorders, especially complex congenital heart diseases that involve complicated interactions between the systemic and pulmonary circulations. For example, in patients with tetralogy of Fallot, presurgical detection of the major aortopulmonary collateral arteries is critical for surgical planning.
研究目的
At present, measuring regional pulmonary perfusion in clinical practice traditionally uses radioactive isotopes such as the technetium-99m (99mTc)-labeled macroaggregated albumin (MAA) (1, 2). The scintigraphic method is a well-established clinical tool; however, poor spatial resolution and overlap due to projection remains a major limitation of this method. This study aims to investigate a method with better resolution and noninvasive properties to quantitative evaluate pulmonary perfusion condition. Here we adopt dynamic contrast enhanced MR imaging.
文獻探討
In recent years, MR imaging has become a competitive technique for pulmonary imaging (3-6). MR imaging has the advantage of simultaneous acquisition of high spatial resolution anatomical images, multiple functional information to assist diagnosis, and no ionization radiation exposure. Dynamic contrast-enhanced MR image (DCE-MRI) using intravenous injection of contrast material has been shown to be able to detect pulmonary embolism (3, 7) and low perfusion in chronic obstructive pulmonary disease (COPD) (7). It is also been demonstrated that MR perfusion imaging can be potentially be used to quantitatively evaluate regional pulmonary perfusion (8). The accuracy of measuring lung perfusion of DCE-MRI has been validated by experiment studies using animal models using invasive microsphere measurements as the standard (9, 10).
Research studies have shown that MR imaging provides consistent information as compared with perfusion scintigraphy (PS) on subjects with pulmonary embolism,
emphysema (11), bronchogenic carcinoma (12), and lung cancer (13). However, the particle size of contrast agent could cause a difference between lung perfusion scintigraphy and DCE-MRI. For scintigrphy, Tc99m-MAA is a large aggregate that the particle size is on the order of hundred micrometers. The mechanism of the contrast agent is to trap in the pre-capillary intravascular space and temporarily obstruct in approximately 1% of the total pulmonary capillary bed. On the contrary, the most often used contrast agent for dynamic contrast-enhanced MR imaging is Gd-DTPA, which is several nm and will flow through capillary.
The mechanism of Tc99m-MAA implies that PS method provides perfusion information supplied by pulmonary artery only. There will be no contrast agent contained in the recirculation or collateral blood flow. On the contrary, the signal intensity (SI)-time curves of dynamic contrast-enhanced MRI may be influenced by the recirculation or blood supply other than pulmonary artery. Usually the recirculation could be removed using gamma variate fitting. However, it may be not possible to distinguish first-pass from second-pass and collateral blood flow for patients with complex pulmonary perfusion. The calculated relative pulmonary blood flow (rPBF) or relative pulmonary blood volume (rPBV) therefore contains signal from blood supply other than pulmonary artery.
Consequently, we hypothesize that the conventional approaches to obtain lung perfusion information from PS and DCE-MRI may result in considerable disagreements in subjects with complex pulmonary circulations, such as those encountered in pediatric patients having congenital heart disease. We further hypothesize that, by narrowing down the analysis region on the SI-time curve of DCE-MRI to the wash-in period of the pulmonary arterial phase, the influence from recirculation and collateral flow could be avoided to lead to DCE-MRI analysis results similar to that obtained with perfusion scintigraphy.
研究方法
The wash-in integration method for DCE-MRI analysis
In the conventional indicator dilution theory, the perfusion parameters can be derived from the series of dynamic images acquired throughout the first-pass contrast agent passage(14). In particular, the relative pulmonary blood volume (rPBV) is given by the integration of the gamma-fitted first-pass SI-time curve, s(t), after subtraction of the baseline signals (8):
0
( ) rPBV s t dt
∞
=∫ [1]
assuming that the concentration of the contrast agent is proportional to the signal enhancement. The relative mean transit time (rMTT) can be computed as the normalized first moment of the SI-time curve:
0
0
( )
( ) t s t dt rMTT
s t dt
∞
∞
⋅
= ∫
∫
[2]
And the relative pulmonary blood flow (rPBF) is obtained using the central volume principle:
rMTT
rPBF= rPBV [3]
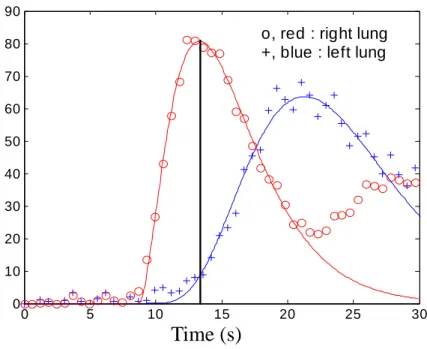
In reality, however, the conventional definition of first-pass transit may encounter difficulty in the case of complex pulmonary circulation. Examples include residual pulmonary stenosis after total surgical correction for tetralogy of Fallot where delayed contrast accumulation could obscure the separation of first-pass transit and recirculation (Fig.1), Fontan surgery where the shape of the SI-time curve deviate substantially from the gamma variate function due to atypical vasculature, or sequestration spectrum where the blood supply actually originates from the aorta rather than pulmonary arteries. In order for the DCE-MRI analysis results to be compatible with those obtained with perfusion scintigraphy, we propose the following modification on the perfusion analysis method for DCE-MRI. Instead of performing integration throughout the entire first-pass transit as in Eqs.[1]-[3], the integration range in the new method is restricted to the wash-in portion only. We shall term the new parameter as rPBVwi, namely,
∫
=
max
0
) (
t
wi s t dt
rPBV [4]
where tmax, the upper bound of integration, is chosen in this study as the time that the normal lung parenchyma shows maximum signal intensity, which is often referred to as the time-to-peak (Fig.1). One can see that if the integration upper bound is chosen instead to approach infinity, rPBVwi would reduce to the conventionally defined rPBV as in indicator dilution theory (8). The rationale for choosing the time-to-peak as the integration upper bound was to ensure inclusion of the wash-in portion of the pulmonary arterial phase only, which is anticipated to give DCE-MRI results similar to those from PS. Validation of the choice of tmax will be illustrated in a later section.
0 5 10 15 20 25 30 0
10 20 30 40 50 60 70 80 90
o, red : right lung +, blue : left lung
Time (s)
Fig 1. The representive figure of wash-in calculation method.
Subjects
A total of 22 patients with complex pulmonary circulation, including tetralogy of Fallot, sequestration spectrum, Swyer-James syndrome, and so forth, were included in our study. The details of patients' clinical profiles and perfusion ratios to the left lung measured by PS were shown in Table 1.
These patients underwent both DCE-MRI and lung perfusion scintigraphy to observe the complex cavopulmonary circulation and possible perfusion deficts.
Patients with Fontan or Hemi-Fontan surgery received two injections from the upper and lower limbs on two different days for perfusion scintigraphy, and with an interval of 20 minutes for DCE-MRI. The perfusion data with injections from different limbs were analyzed and compared independently, hence making the total number of cases 26.
Data acquisitions
Lung perfusion scintigraphy
Pulmonary perfusion scintigraphy was performed after intravenous injection of 99mTc-MAA. Six static views with anterior, posterior and right-left lateral oblique posterior and anterior projections were obtained with a dual head gamma camera (Siemens E-Cam, Erlangen, Germany). In both anterior and posterior images, manually selected regions of interest (ROIs) were drawn over the left and right lungs.
The percentage of perfusion of the lungs was calculated by dividing the mean radioactivity of the left lung measured from anterior and posterior views, and divided
by the mean radioactivity of the whole lungs ( ). To obtain regional perfusion ratios, both lungs were divided to six ROIs in the upper right, middle right, lower right, upper left, middle left, and lower left lungs. And the percentage perfusion ratio for each regional ROI was calculated separately.
PS
RLeft
Contrast-enhanced 3D MR angiography
For some patients, contrast-enhanced 3D MR angiography was acquired before perfusion imaging. The MR angiogram was acquired in coronal orientation using elliptical k-space gradient-echo imaging with TR/TE = 4.8ms/1.5ms, flip angle = 15°, matrix = 256 × 160, and field of view = 150~320 mm after the injection of gadopentetate dimeglumine 0.1 mmol/kg (Magnevist, Schering, Germany).
Multiplanar reconstruction with maximal intensity projection was done for the interrogated vessels to evaluate the vascular morphology together with anatomical spin-echo images.
Dynamic contrast-enhanced MR imaging
DCE-MR images were acquired by using an inversion-recovery-prepared segmented EPI technique (16) with cardiac gating. The subjects were in supine position throughout the entire examinations. Imaging parameters, adjusted dependent on individual heart rates, were usually TI/TR/TE/ETL = 180/6.5/1.2/4, matrix = 128x128, and interpolated to 256x256 for display. Slice thickness was 8~12mm, with coronal slices acquired. Cardiac gating was used to avoid image mis-registration, particularly for lung parenchyma near the border of mediastinum and the heart where the blood flow was relatively large and could have strong impact on pulmonary perfusion parameters. The number of slices acquired in one cardiac cycle is dependent on the heart rate: about three slices in one R-R interval or about seven slices in two R-R intervals (16). A bolus of 0.05-0.1 mmol/Kg Gd-DTPA (Magnevist, Schering, Germany) was injected intravenously after the image acquisition started, using either an MR-compatible power injector at a speed of 3 ml/sec or rapid hand injection with a Y connector at roughly the same speed. A total of 40~60 frames, separated by one or two R-R intervals from one another, were obtained at each coronal slice locations. Hence the total imaging time for DCE-MRI was less than a minute. Patients were asked to hold their breath during scans if possible. Some patients were unable to hold their breath during the first-pass transit of the contrast agent due to poor pulmonary condition. Patients younger than 5 years old were sedated and consequently were imaged during free breathing. For these patients, the SI-time curves showed respiration-induced fluctuations which could
nevertheless be smoothed via gamma variate fitting as stated in the next section. In regions near the diaphragm where respiratory motion caused computational errors, the impact was minimal due to relatively small blood flow.
DCE-MRI data analysis
In order to compare results with projection pulmonary scintigraphy, the analysis of DCE-MRI data was accomplished based on ROI selections as close as possible to that employed in PS, and averaged over all coronal slices to yield results as in projection view. For this purpose, a dedicated software program was developed to define each lung on each slice as an unit of ROI, with the heart and major vasculature in the lungs excluded (17). Following ROI selections, their SI-time curves were baseline-intensity-subtracted and gamma-fitted to obtain the first enhancing contrast agent passage (ideally the first-pass transit). The conventional perfusion parameters were thus derived according to Eqs.[1] to [3], assuming that the changes in signal intensity were approximately proportional to contrast concentration. The percentage perfusion ratios of the left lung, similar to the as defined in perfusion
scintigraphic scans, could then be derived ( and ). The ROIs of left and right lungs were further divided into six regional ROIs as upper right, middle right, lower right, upper left, middle left, and lower left lung fields, again analogous to that used in nuclear medicine scans, in order to compare DCE-MRI with PS on regional perfusion.
PS
RLeft
RLeft PBV
RLeft PBF
In addition to the DCE-MRI perfusion parameters obtained using conventional indicator dilution theory as stated above, rPBVwi was also obtained using Eq.[4] for both left lung perfusion ratio and regional analysis, with identical ROIs.
Statistical analysis
The overall agreement between PS and DCE-MRI was assessed using the intraclass correlation coefficient (18) which produces measures of consistency or agreement of values within cases. In addition, graphical visualization of the agreement between perfusion ratios of PS and DCE-MRI was assessed using the Bland-Altman analysis (19).
結果與討論
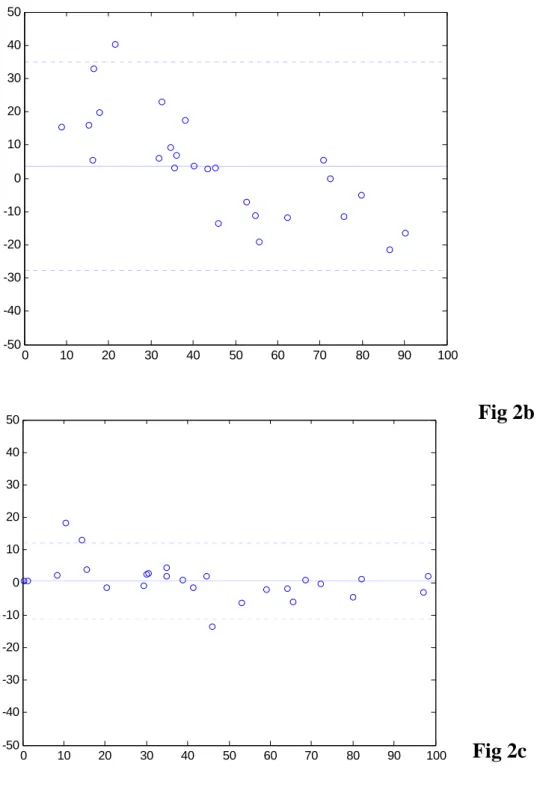
The Bland-Altman plots (19) in Figs.2a and 2b show the overall agreement between the percentage perfusion ratios of the left lung derived from perfusion
scintigraphy ( ) and that from conventional rPBV and rPBF of DCE-MRI
( and ), respectively. For rPBV versus PS (Fig.2a), the mean difference was 4.01%, with upper and lower limits of two standard deviations at 50.37% and –42.26%, respectively. The intraclass correlation coefficient (18) between these two methods was R
PS
RLeft
PBF
RLeft
of R
PBV
RLeft
I = 0.49 (95% confidence interval [0.13, 0.73]).
For rPBF versus PS (Fig.2b), the mean difference was 3.33% (upper and lower limits at 35.48% and –28.82%, respectively), with intraclass correlation coefficient RI = 0.77 and 95% confidence interval [0.56, 0.89]. These results suggest that both rPBV and rPBF show substantial discrepancy with PS in our subjects with complex pulmonary circulation. With wash-in analysis for DCE-MRI (Fig.2c), the upper and lower boun -RLeftPS agreement reduced to 12.85% and –12.67%, respectively. Mean difference was 0.09%. Intraclass correlation coefficient became as high as R
ds
terval [0.96, 0.99]).
PBVwi Left
I = 0.98 (95% confidence in
0 10 20 30 40 50 60 70 80 90 100
-50 -40 -30 -20 -10 0 10 20 30 40 50
Fig 2a
0 10 20 30 40 50 60 70 80 90 100 -50
-40 -30 -20 -10 0 10 20 30 40 50
0 10 20 30 40 50 60 70 80 90 100
-50 -40 -30 -20 -10 0 10 20 30 40
50 Fig 2b
Fig 2c
Fig 2. Bland-Altman analysis plots of the percent flow to the left lung. (a) PBV (b) PBF (c) wash-in, using same scale.
The results from this study agree well with our hypothesis that the conventional approaches to obtain lung perfusion information from DCE-MRI have led to substantial discrepancies with the analysis from pulmonary scintigraphy on patients with complex pulmonary circulation. The discrepancies are anticipated to originate
from the difference in particle sizes of the contrast agents used in the two imaging modalities, which results in distinct characteristics in terms of the wash-out behaviors.
In previous investigations comparing DCE-MRI and PS in human subjects (1, 11-13, 20), such inconsistencies were not found because only patients with pulmonary embolism, emphysema, COPD, and lung cancer were recruited. For the diseases mentioned above, the pulmonary circulations are relatively simple, involving merely a decrease or increase in blood volume. Neither recirculation nor collateral flow is associated with these diseases in a diagnostically essential manner.
For complex pulmonary circulation such as those encountered in congenital heart diseases, the situation becomes prominently different from the diseases mentioned above. In our data, both rCBV and rCBF derived from DCE-MRI could lead to disagreements with PS on the order of ±30–50% in the estimation of the left lung perfusion ratio. Note that the strong inter-modal disparity is not a unique finding in our institute. One comparative investigation examining patients with malignant stenosis concluded that a statistically significant correlation exists between PS and contrast-injected projection MR angiography (21). A closer inspection on the published data, however, reveals that about one third of their patients showed rather discrepant perfusion ratios by about 40% between PS and MR angiography (21).
Considering that stenosis of upstream vessels could very likely lead to delayed wash-in and wash-out, and hence an overlap of the second-pass recirculation with first-pass transit in the SI-time curves, the PS-MR disagreements found on these patients are in close analogy to our findings from the Tetralogy of Fallot patients with post-surgical residual stenosis. Similar findings regarding non-negligible disagreement between PS and DCE-MRI were also reported in another study combining patients with different pulmonary diseases, although without possible mechanisms explained in detail (22).
The phenomena of inter-modal disparity between DCE-MRI and PS raise the important issue regarding the use of PS as the clinical standard for lung perfusion estimation for patients with complex pulmonary circulation (23). The fact that pulmonary PS with 99mTc -MAA administration contains only wash-in information clearly shows its deficiency in revealing collateral flows such as that encountered in sequestration spectrum. In this regard, it is perhaps more appropriate to refer to the PS perfusion as the "pulmonary arterial flow" to specifically exclude the effects from systemic aortic flow. Moreover, in an earlier study specifically focused on patients with Fontan circulation, it was further pointed out that perfusion PS is problematic due to preferential draining of the venae cavae to one lung (23). Although in that study the velocity mapping method with phase-contrast MRI was suggested to lead to more accurate measurements in blood flow than PS (23), phase-contrast MRI is
known to offer information on total blood flow only, as opposed to regional perfusion that can be assessed using DCE-MRI. In addition, technical errors in phase-contrast MRI analysis possibly related to the presence of regurgitation (24) and the corresponding modifications in the derivation of blood flow parameters (25) must be taken into account in order for phase-contrast MRI to be clinically helpful.
Therefore, in situations where regional pulmonary perfusion is of diagnostic value, DCE-MRI with wash-in analysis should be superior to PS and provides complimentary information to phase-contrast MRI for patients with complex pulmonary circulation.
Regardless of the potential pitfalls of PS in complex pulmonary circulation, our study shows that the MR-PS agreement can be prominently improved by using the wash-in analysis specifically modified for DCE-MRI. By integration to the enhancement peak of normal lung parenchyma, the analysis of DCE-MRI was constrained to the first-pass transit of the pulmonary arterial supply, hence offering better correlation with PS results. Therefore, neither the systemic collateral flow nor the second-pass recirculation arising from severe stenosis was included in the DCE-MRI wash-in analysis results.
Considering that PS with 99mTc-MAA is currently the most widely used noninvasive imaging technique for measuring pulmonary perfusion, the capability of our wash-in analysis allowing DCE-MRI to provide information equivalent to PS would make DCE-MRI an ideal candidate for evaluating complex pulmonary circulation. Especially for pediatric patients having congenital heart diseases, the absence of ionizing radiation provides a further advantage suitable for longitudinal follow-up (26). More importantly, the information contained in the wash-out portion of the SI-time curve may potentially provide diagnostically helpful information such as the presence of systemic collateral flow, although implications regarding the wash-out were not investigated in this current study.
One limitation of our DCE-MRI study for lung perfusion is that the physiological meaning of the wash-in integration remains unclear. Although we attempted the wash-in integration for the purpose of excluding systemic collateral circulation and recirculation, currently we do not have a physiological model supporting the use of integration to the enhancement peak to solely represent the pulmonary arterial flow.
Further investigations on suitable modeling are currently underway.
參考文獻
1. Amundsen T, Torheim G, Kvistad KA, et al. Perfusion abnormalities in pulmonary embolism studied with perfusion MRI and ventilation-perfusion scintigraphy: an intra-modality and inter-modality agreement study. J Magn Reson Imaging 2002;
15:386-394.
2. Dessy H, Hermus JP, van den Heuvel F, Oei HY, Krenning EP, Hess J.
Echocardiographic and radionuclide pulmonary blood flow patterns after transcatheter closure of patent ductus arteriosus. Circulation 1996; 94:126-129.
3. Pruckmayer M, Zacherl S, Salzer-Muhar U, Schlemmer M, Leitha T. Scintigraphic assessment of pulmonary and whole-body blood flow patterns after surgical intervention in congenital heart disease. J Nucl Med 1999; 40:1477-1483.
4. Amundsen T, Kvaerness J, Jones RA, et al. Pulmonary embolism: detection with MR perfusion imaging of lung--a feasibility study. Radiology 1997; 203:181-185.
5. Roberts DA, Gefter WB, Hirsch JA, et al. Pulmonary perfusion:
respiratory-triggered three-dimensional MR imaging with arterial spin tagging--preliminary results in healthy volunteers. Radiology 1999; 212:890-895.
6. Uematsu H, Levin DL, Hatabu H. Quantification of pulmonary perfusion with MR imaging: recent advances. Eur J Radiol 2001; 37:155-163.
7. Hatabu H, Gaa J, Kim D, Li W, Prasad PV, Edelman RR. Pulmonary perfusion:
qualitative assessment with dynamic contrast-enhanced MRI using ultra-short TE and inversion recovery turbo FLASH. Magn Reson Med 1996; 36:503-508.
8. Levin DL, Chen Q, Zhang M, Edelman RR, Hatabu H. Evaluation of regional pulmonary perfusion using ultrafast magnetic resonance imaging. Magn Reson Med 2001; 46:166-171.
9. Hatabu H, Tadamura E, Levin DL, et al. Quantitative assessment of pulmonary perfusion with dynamic contrast-enhanced MRI. Magn Reson Med 1999;
42:1033-1038.
10. Chen Q, Levin DL, Kim D, et al. Pulmonary disorders: ventilation-perfusion MR imaging with animal models. Radiology 1999; 213:871-879.
11. Berthezene Y, Croisille P, Wiart M, et al. Prospective comparison of MR lung perfusion and lung scintigraphy. J Magn Reson Imaging 1999; 9:61-68.
12. Iwasawa T, Saito K, Ogawa N, Ishiwa N, Kurihara H. Prediction of postoperative pulmonary function using perfusion magnetic resonance imaging of the lung. J Magn Reson Imaging 2002; 15:685-692.
13. Ohno Y, Hatabu H, Higashino T, et al. Dynamic perfusion MRI versus perfusion scintigraphy: prediction of postoperative lung function in patients with lung cancer.
AJR Am J Roentgenol 2004; 182:73-78.
14. Thompson HK, Jr., Starmer CF, Whalen RE, McIntosh HD. Indicator Transit Time Considered as a Gamma Variate. Circ Res 1964; 14:502-515.
15. Geva T, Greil GF, Marshall AC, Landzberg M, Powell AJ. Gadolinium-enhanced 3-dimensional magnetic resonance angiography of pulmonary blood supply in patients with complex pulmonary stenosis or atresia: comparison with x-ray
angiography. Circulation 2002; 106:473-478.
16. Slavin GS, Wolff SD, Gupta SN, Foo TK. First-pass myocardial perfusion MR imaging with interleaved notched saturation: feasibility study. Radiology 2001;
219:258-263.
17. Lin YR, Wu MT, Huang TY, et al. Comparison of arterial spin labeling and first-pass dynamic contrast-enhanced MR imaging in the assessment of pulmonary perfusion in humans: the inflow spin-tracer saturation effect. Magn Reson Med 2004; 52:1291-1301.
18. Williamson JM, Lipsitz SR, Manatunga AK. Modeling kappa for measuring dependent categorical agreement data. Biostatistics 2000; 1:191-202.
19. Bland J, Altman D. Statistical methods for assessing agreement between two methods of clinical measurement. Lancet 1986; 1:307-310.
20. Ohno Y, Koyama H, Nogami M, et al. Postoperative lung function in lung cancer patients: comparative analysis of predictive capability of MRI, CT, and SPECT.
AJR Am J Roentgenol 2007; 189:400-408.
21. Lehnhardt S, Thorsten Winterer J, Strecker R, et al. Assessment of pulmonary perfusion with ultrafast projection magnetic resonance angiography in comparison with lung perfusion scintigraphy in patients with malignant stenosis. Invest Radiol 2002; 37:594-599.
22. Molinari F, Fink C, Risse F, Tuengerthal S, Bonomo L, Kauczor HU. Assessment of differential pulmonary blood flow using perfusion magnetic resonance imaging:
comparison with radionuclide perfusion scintigraphy. Invest Radiol 2006;
41:624-630.
23. Fratz S, Hess J, Schwaiger M, Martinoff S, Stern HC. More accurate quantification of pulmonary blood flow by magnetic resonance imaging than by lung perfusion scintigraphy in patients with fontan circulation. Circulation 2002;
106:1510-1513.
24. Roman KS, Kellenberger CJ, Farooq S, MacGowan CK, Gilday DL, Yoo SJ.
Comparative imaging of differential pulmonary blood flow in patients with congenital heart disease: magnetic resonance imaging versus lung perfusion scintigraphy. Pediatr Radiol 2005; 35:295-301.
25. Wu MT, Huang YL, Hsieh KS, et al. Influence of pulmonary regurgitation inequality on differential perfusion of the lungs in tetralogy of Fallot after repair: a phase-contrast magnetic resonance imaging and perfusion scintigraphy study. J Am Coll Cardiol 2007; 49:1880-1886.
26. Tsai SY, Wu MT, Lin YR, et al. Temporal correlation-based dynamic contrast-enhanced MR imaging improves assessment of complex pulmonary circulation in congenital heart disease. Magn Reson Med 2006; 56:517-526.
1
國科會
補助出席國際會議報告
Joint Annual Meeting ISMRM-ESMRMB 2010
“國際醫用磁共振學會暨歐洲醫用磁共振學會 2010 年聯合會議”
會議報告
林益如 台灣科技大學電子系 九十九年五月十九日
2
行政院國家科學委員會出席國際會議補助報告
國際醫用磁共振學會暨歐洲醫用磁共振學會
2010 年聯合會議
Joint Annual Meeting ISMRM-ESMRMB 2010 2010/5/1~2010/5/7, Stockholm, Sweden
林益如 台灣科技大學電子系 [email protected]
一、參加會議經過
國 際 醫 用 磁 共 振 學 會 ( International Society for Magnetic Resonance in Medicine;ISMRM)之年會一向以匯集各項先進磁共振(magnetic resonance;
MR)技術發展的論文報告而著稱,每隔三年 ISMRM 會將開會地點選於歐洲,
並與歐洲醫用磁共振學會(ESMRMB)共同舉辦會議,今年正逢與 ESMRMB 合辦 會議,地點則是在瑞典斯德哥爾摩市。前往瑞典之旅途遙遠,單程飛行時間長達 十五小時,而且多半需要轉機,但國內前往的參與人數仍然不少,包含台灣大學、
台大醫學院、陽明大學、臺北榮民總醫院、三軍總醫院、台中榮民總醫院、中央 研究院、清華大學、長庚大學、林口長庚醫院、中國醫藥大學、高雄醫學大學、
中山大學、台灣科技大學、逢甲大學、以及台灣奇異鼎眾醫療公司與西門子醫療 系統公司皆有人員前往。
會議於斯德哥爾摩市的 Convention Center 舉行,地點位於市郊,議程共分五 天進行,之前再外加兩天的 educational courses。論文總數較之去年更加成長,
包括 oral presentation、traditional poster、E-poster presentation,首次超過五千篇!
單是五天內的 Scientific Meetings 總共有將近九百場的 oral presentations、約兩 千兩百篇 traditional posters、以及一千七百個 E-poster presentations,參加人數約 七千人。演講集中在兩個區塊,不需花太多腳程便可聆聽不同演講。壁報展示的 空間相當集中,並且與 E-posters 位於同一區域,以增高閱覽次數。會場附近旅 館價格均甚昂貴,為節省公帑,仍舊比照去年模式租用 weekly rental 的一般公 寓,在人數眾多的情形下也得以節約住宿支出,另外一同前往參加的學生因為經 濟考量,則選擇住在青年旅館。由於公寓和青年旅館內廚房器具一應俱全,在三 餐上亦可選擇自行烹煮,進一步節約經費。
3
圖為本人與一同前往開會之學生於開會會場合照,包括三名碩士班學生與一 名大學部專題學生。
二、與會心得
今年大會特別邀請到瑞典皇后來演講做為揭開會議的序幕,顯示了瑞典隊於 本次會議的重視程度;今年的演講主題在磁振頻譜方面,有相當多的進展,尤其 有多篇文章是關於頻譜影像的技術發展,這表示此領域相當受到重視,另外有多 篇 關 於 頻 譜 編 譯 的 技 術 , 值 得 參 考 。 肺 部 相 關 的 研 究 , 今 年 仍 然 集 中 在 hyperpolarized gas上的技術及應用,焦點還是在於氣體分配的分布,很可惜此項 研究在國內,缺乏相關的設備技術,引此一直難以推展進行。
三、考察參觀活動
此次 ISMRM 對於學生有較多的活動,包括提供給參與學生跟大師對談的機 會,另外在舉辦諾貝爾獎晚宴的相同場所舉辦了一場專門讓學生參加的活動,雖 然本人無法與會,但一同前往的研究生就有幸能在這個特殊的場合見到多位磁共 振領域的大師。在開會間的空閒時間,本人也利用機會參觀了斯德哥爾摩市,這 個城市與水的關係非常密切,市區包含了數個大小島嶼,因此城市交通中,船舶 變成另外一個特別的選項。
4
四、建議
近幾年來,基於拓展視野、與國際交流的角度,本人的研究生有相當比 例都有意願與本人一同參加國際會議,但因為開會地點多在美洲歐洲,路途遙遠 飛機票價昂貴且生活費也相當驚人,有些學生礙於經濟考量便無法一同前往,本 人雖很願意幫助學生減少支出,但因為計畫所獲得的國際差旅費原本就已經不 多,在支付完本人之註冊費及機票後便已告罄,難以幫助學生,雖有部分學生成 功申請到學生參與國際會議之補助,但仍然相當不足;希望未來能夠增加此方面 的經費。
五、攜回資料名稱及內容
本次參加會議共攜回 ISMRM 2010 Proceeding CD-ROM 一片、以及廠商提 供產品訊息等等。
六、其他
1. Chin-Yu Lu, Yi-Ru Lin, Stefan Posse, Shang-Yueh Tsai, “An Investigation of the Acceleration Factor in TE-Averaged Data-Sharing Radial Proton Echo Planar Spectroscopic Imaging (DsrPEPSI)”, Proceedings of International Society for Magnetic Resonance in Medicine, Stockholm, Sweden, 2010
2. Jia-Shuo Hsu, Shang-Yueh Tsai, Yi-Ru Lin, Hsiao-Wen Chung, “On Accelerated Dynamic Contrast-Enhanced Lung Perfusion Using K-T BLAST”, Proceedings of International Society for Magnetic Resonance in Medicine, Stockholm, Sweden, 2010
An Investigation of the Acceleration Factor in TE-averaged Data-Sharing Radial Proton Echo Planar Spectroscopic Imaging (dsrPEPSI)
C-Y. Lu1, Y-R. Lin2, S. Posse3,4, and S-Y. Tsai5
1Biomedical Engineering, National Taiwan University of Science and Technology, Taipei, Taiwan, 2Eletronic Engineering, National Taiwan University of Science and
Technology, Taipei, Taiwan, 3Department of Neurology, University of New Mexico School of Medicine, Albuquerque, Albuquerque, New Mexico 87131, United States,
4Electrical and Computer Engineering Department, University of New Mexico, Albuquerque, NM, United States, 5Electrical Engineering, Chang Gung University, Taoyuan, Taiwan
Introduction
TE-averaged technique is a general application to measure Glutamate (Glu) [1], one primary excitatory neurotransmitter of the central nervous system on the 1H MR spectrum at 2.35 ppm. For obtaining TE-averaged MRSI data sets using multiple TEs was time consuming. Previous study had shown that radial proton echo planar spectroscopic imaging (rPEPSI) [2] and data-sharing radial PEPSI (dsrPEPSI) [3] were feasible to measure Glu, and the scan time could be reduced from 16 minutes to 1 minute by dsrPEPSI.
However, the reduced scan time will decrease both SNR and spectrum quality. This study was conducted to investigate and optimize the spectral quality versus scan time.
Material and Methods
The experiment was performed at 3T MR system using 32-channels array head coil (Trio, Siemens Medical Solutions, Erlangen, Germany). rPEPSI were collected in the range of 0≤φ<π with 32 views and 5.7° rotation angle. The imaging parameters are TR
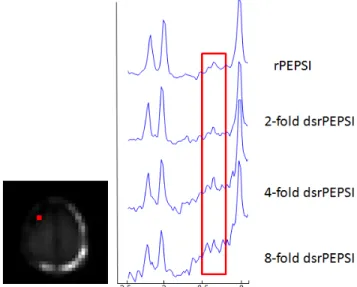
= 2000ms, readout point = 32 with over-sampling, FOV = 224mm, slice thickness = 15mm, NEX = 1. Complete 8-slice outer volume suppression was applied along the border of brain to reduce the extra cranial signal especially lipid. For TE-averaging, data were acquired with rPEPSI and 16 different TEs ranging from 15ms to 165ms. dsrPEPSI were simulated from full-sampled rPEPSI. A equally distributed subset of K-space lines were chose from full-sampled data for each TE, and the information of empty K-space lines was covered by data from other TEs. Figure 1 shows the diagram of radial trajectory of a 4-fold dsrPEPSI. The reconstruction of rPEPSI and dsrPEPSI were re-sampled into Cartesian grid using Kaiser-Bessel kernel [4] following with spectra post processing.
Results and discussion
The result was showed in Figure2. Glu at 2.35 ppm can be clearly seen in the TE-averaged rPEPSI data. When the acceleration factor was small, such as 2-fold dsrPEPSI, there was no obvious difference between the accelerated spectrum and the original one. But when the acceleration factor exceeds 4, SNR lost will affect the visibility and quantization of Glu. The baseline drift also increased as the acceleration factor increased, which may be resulted from the extra cranial lipid signal. From our result, 4-fold dsrPEPSI is feasible to acquire Glu at a 3T system while maintaining spectral quality. And
the scan time can be reduced to 4 minutes, which is a reasonable length for clinical use.
References
1. Hurd R., et al., Magn Reson Med, 2004, 51: p. 435-440.
2. Lin YR., et al., ISMRM, Toronto, 2008 3. Kuo KT., et al., ISMRM, Honolulu, 2009
4. Dale B., et al., IEEE Trans Med Imaging, 2001, 20: p 207-17
Figure 1. The K-space trajectory of dsrPEPSI for (a) TE=15ms, (b) TE=25ms, (c) TE=35ms, (d) TE=45ms and so on. For a 4-fold dsrPEPSI, 8 K-space lines were used for each TE, and the required total scan time is 4 minutes.
Figure 2. Comparison of spectrum of TE-average rPEPSI and dsrPEPSI
(a) (b) (c) (d)
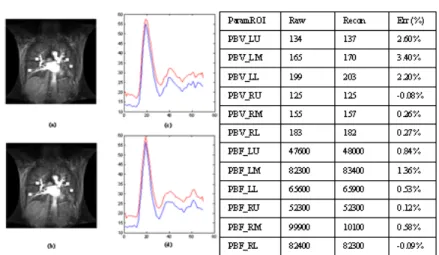
Figure 1: (a) Raw and (b) reconstructed images of a normal subject. (c)(d) Time-intensity curves from raw (blue) and recon (red) dynamic sets from right/left lung. (e) Perfusion parameters (LU: left-upper, LM: left-middle, LL: left-lower, RU: right-upper, RM:
right-middle, RL: right-lower) from raw and recon images and their disagreements.
Figure 2: (a) Raw and (b) reconstructed images of a patient. (c)(d) Time-intensity curves from raw (blue) and recon (red) dynamic sets from right/left lung. (e) Perfusion parameters (LU: left-upper, LM: left-middle, LL: left-lower, RU: right-upper, RM: right-middle, RL:
right-lower) from raw and recon images and their disagreements.
On Accelerated Dynamic Contrast-Enhanced Lung Perfusion Using k-t BLAST
J-S. Hsu1, S-Y. Tsai2, Y-R. Lin3, and H-W. Chung1
1Institute of Biomedical Electronics and BioInformatics, National Taiwan University, Taipei, Taiwan, 2Dept. of Electrical Engineering, Chang-Gung University, Taoyuan, Taiwan, 3Dept. of Electronic Engineering, National Taiwan University of Science and Technology, Taipei, Taiwan
INTRODUCTION: k-t BLAST [1] may accelerate dynamic contrast-enhanced (DCE) lung imaging with only limited penalty in RMS error [2]. Yet the algorithm’s known restrictions including initial-overshooting and temporal-smoothing cast uncertainties on perfusion quantifications for disease studies. In this work, we show that while these restrictions are present along accelerated DCE lung images, the tissue perfusion parameters remain highly consistent with those derived from fully-sampled images on both normal subjects and patients, suggesting feasibility of accelerated lung images in clinical examinations.
THEORY AND METHODS: k-t BLAST is a dynamic imaging acceleration technique in which the k-t undersampling is maneuvered to minimize the corresponding aliasing in the spatiotemporal domain [3]:
(1)
in which a finite and compact enhances reconstruction performance by further reducing the degree of aliasing. DCE lung imaging, shown to be compatible with k-t BLAST [1] for its resemblance to cardiac cine imaging in terms of compact temporal variation [2], could be prone to k-t BLAST’s restrictions such as initial-overshooting and temporal-smoothing resulting in deviated estimations of mean-transit time and blood flow. Hence the presence of these restrictions and their impact to quantification require validation as done in this
study. DCE lung images were obtained using IR-prepared, segmented EPI technique with TI/TR/TE/ETL =180/6.5/1.2/4, 256x256, 40-60 frames, slice thickness =10~12 mm, with seven coronal slices reconstructed using 5-fold acceleration including 18 fully-sampled low frequency ky-lines for conservation of fast varying contrast. 6 normal subjects and 3 patients were examined. ROIs were manually selected and divided into 6 regions (left upper, left middle, left lower, right upper, right middle, and right lower lungs). Signal-time curves were calculated and fitted to a gamma variate function. Relative perfusion parameters including pulmonary blood volume (PBV) and flow (PBF) were calculated [4].
RESULTS AND DISCUSSION: Fig 1. depicts the
time-intensity curve and corresponding perfusion quantification of the normal subjects. It can be seen that both the curve and the tissue quantifications of accelerated dataset (table in Fig.1, parameters in relative units) remain highly consistent with those from fully-sampled images. Such performance in normal studies can be attributed to the finiteness and compactness of dynamic lung spatiotemporal spectrum as predicted in theory section. The acceleration also benefits from the relative long duration of lung imaging (~70sec) compared with blood circulation (~22sec for one cycle of transit). This alleviates the demand toward temporal resolution hence finiteness of the spatiotemporal spectrum.
For patient studies, the turbulent time-intensity variation due to inability of long breath-holding as often encountered in patients results in smoothened time-intensity estimation after the first pass of contrast agent (Fig 2), likely due to widened spatiotemporal spectrum (hence increased aliasing) caused by turbulence and branching morphology in parenchyma. The tissue parameters however remain closed to true values, for the standard pre-processing of lung quantification involves fitting hence temporal smoothing of intensity curve does not exhibit prominent influences. Therefore temporal smoothing and initial overshooting, while being a restriction of k-t BLAST, inflicts little impact on tissue perfusion quantifications. All nine subjects included in this study showed similar error levels less than 4% (mostly around 2% or less) for relative PBV and PBF.
CONCLUSION: This abstract demonstrates consistency of tissue parameters between fully-sampled and k-t BLAST
accelerated DCE lung imaging in both normal subjects and patients. While restrictions of k-t BLAST are present and influence intensity estimation on patient images as predicted, little impact is inflicted on the corresponding perfusion quantification.
REFERENCES: [1] Tsao et al. MRM, 50:1031-1042, 2003 [2] Hsu et al. ISMRM 2007 [3] Tsao et al. MRM, 53:1372-1382, 2005 [4] Levin et al. MRM 2001;
46:166-171
無衍生研發成果推廣資料
98 年度專題研究計畫研究成果彙整表
計畫主持人:林益如 計畫編號:98-2221-E-011-094- 計畫名稱:磁振造影肺部微灌流影像在先天性心臟病患者之定量分析
量化
成果項目 實際已達成
數(被接受 或已發表)
預期總達成 數(含實際已
達成數)
本計畫實 際貢獻百
分比
單位
備 註 ( 質 化 說 明:如 數 個 計 畫 共 同 成 果、成 果 列 為 該 期 刊 之 封 面 故 事 ...
等)
期刊論文 0 0 100%
研究報告/技術報告 0 0 100%
研討會論文 0 0 100%
論文著作 篇
專書 0 0 100%
申請中件數 0 0 100%
專利 已獲得件數 0 0 100% 件
件數 0 0 100% 件
技術移轉
權利金 0 0 100% 千元
碩士生 3 3 100%
博士生 0 0 100%
博士後研究員 0 0 100%
國內
參與計畫人力
(本國籍)
專任助理 0 0 100%
人次
期刊論文 0 1 100%
研究報告/技術報告 0 0 100%
研討會論文 2 2 100%
論文著作 篇
專書 0 0 100% 章/本
申請中件數 0 0 100%
專利 已獲得件數 0 0 100% 件
件數 0 0 100% 件
技術移轉
權利金 0 0 100% 千元
碩士生 0 0 100%
博士生 0 0 100%
博士後研究員 0 0 100%
國外
參與計畫人力
(外國籍)
專任助理 0 0 100%
人次
其他成果
(無法以量化表達之成
果如辦理學術活動、獲 得獎項、重要國際合 作、研究成果國際影響 力及其他協助產業技 術發展之具體效益事 項等,請以文字敘述填 列。)
協助醫院對肺部微灌流影像之分析了解
成果項目 量化 名稱或內容性質簡述
測驗工具(含質性與量性) 0
課程/模組 0
電腦及網路系統或工具 0
教材 0
舉辦之活動/競賽 0
研討會/工作坊 0
電子報、網站 0
科 教 處 計 畫 加 填 項
目 計畫成果推廣之參與(閱聽)人數 0
國科會補助專題研究計畫成果報告自評表
請就研究內容與原計畫相符程度、達成預期目標情況、研究成果之學術或應用價 值(簡要敘述成果所代表之意義、價值、影響或進一步發展之可能性)、是否適 合在學術期刊發表或申請專利、主要發現或其他有關價值等,作一綜合評估。
1. 請就研究內容與原計畫相符程度、達成預期目標情況作一綜合評估
■達成目標
□未達成目標(請說明,以 100 字為限)
□實驗失敗
□因故實驗中斷
□其他原因 說明:
2. 研究成果在學術期刊發表或申請專利等情形:
論文:□已發表 □未發表之文稿 ■撰寫中 □無 專利:□已獲得 □申請中 ■無
技轉:□已技轉 □洽談中 ■無 其他:(以 100 字為限)
3. 請依學術成就、技術創新、社會影響等方面,評估研究成果之學術或應用價 值(簡要敘述成果所代表之意義、價值、影響或進一步發展之可能性)(以 500 字為限)
在此計畫中,我們以自行發展之視窗圖形介面程式,進行針對肺部血流的分析,程式包括 磁振影像之使用對比劑動態微灌流參數、相位對比影像流速流量分析以及核子醫學影像的 分析。我們利用磁振影像之使用對比劑動態微灌流影像來觀測患有先天性心臟病患者之複 雜的肺部血流情形。因為先天性心臟病患者的肺部時常出現特殊的血流供應現象,我們發 現如果使用一般微灌流參數估算方法來分析這種病患,會與核子醫學影像之分析結果有差 異。我們提出一限制範圍積分法,測量結果與核子醫學的結果十分相似。我們認為此研究 可以提供在患者上更完整的動態微灌流影像定量分析,包括單只考慮肺動脈血供應的灌流 分析,以及考慮包括其他血流供應的總灌流分析。