(三) 探討國內優秀高爾夫球選手從事揮桿動作,不同時期足部力量之變化情形。 (四) 比較並描述出不同等級選手不同時期之上述參數的差異。
(一) 探討國內一般高爾夫球選手雙手各關節等速肌力特徵:相對體重力矩峰值 (relative peak torgue)、動力(power)、功(work)。(暫時刪除)
度下所產生的峰值轉矩,並以腕關節橈側偏移(radial deviation)、肘關節屈曲 (flexion)和肩 關節後挺(away)動作方向作為上桿的方向和腕關節尺側偏移(ulnar deviation)、肘關節伸展 (extension)和肩關節前伸(toward)動作方向作為下桿的方向,藉由上桿和下桿的方向來比較 男、女峰值轉矩的比值。結果為男選手的平均等速肌力較女選手大,且發現等速肌力較大 的選手有延遲釋放手腕動作的現象,此延遲釋放手腕現象會使得手腕在擊球前產生快速 度,此速度能夠給予桿頭很大的貢獻;在動力學方面,Kreighbaum & Katharine (1996)提出 肢段所產生的力矩在互相連結中,近端肢段會做出減速動作以傳遞到遠端肢段,且肌肉力 矩所產生的角速度會連續且不斷累加,最後在桿頭速度上,得到最大的角速度,並在最快 的桿頭速度下揮擊球,以至於能夠得到最遠的距離。從以上的理論可以知道,肢段速度在 連結傳遞過程中,近端肢段會經過最大肢段速度後,為了要將角速度傳遞給遠端肢段,往 往會做出減速的動作。 在上肢關節對於揮桿期球桿揮擊的表現研究中,多數學者認為手腕關節的釋放動作對 於桿頭速度大小有很大的影響。Cahalan 等人 (1991)以職業選手為受試對象,在下桿初期 測得球桿力矩為20 磅,但擊球時因為手腕的釋放動作,球桿力矩增加到 70-79 磅。Cahalan 等人指出如果過早釋放手腕動作,在擊球時可能無法增加手腕帶動球桿所產生的角動量。 顯示桿頭速度;而McLaughlin & Best 於 1994 年曾於立體空間中做過一個實驗,以兩台 攝影機與受試者的角度呈90 度角,同步化拍攝揮桿動作方式,以 PEAK 軟體作數據資料 分析,比較優秀選手與非優秀選手在 11 個運動學參數中的差異,其結果發現到優秀選手 的左手臂與桿身的夾角不僅比非優秀選手的夾角小且造就在桿頭上有較快的速度產生,同 樣地,他們也提出手腕太早釋放會減少桿頭速度,適當的手腕延遲釋放點,對於桿頭速度 的增加有正面的影響;此外,Suzuki et al. (2000)創造一套新的模型,具有肘關節和腕關節 的揮桿動作系統,其結論與McLaughlin & Best 於(1994)一樣,使用腕關節力矩確實能夠 對桿頭有較佳的貢獻,前提是必須是適時的介入腕關節力矩。 早期的學者單純認為非慣用手(前導手)手腕的曲腕動作(橈側偏移)能夠增加桿頭速度 (Cochran&Stobb, 1968);然而隨著科技的進步,可以測量上肢的更進一步認為非慣用手手 腕應該要釋放才能夠使桿頭加速,而至目前為止,使用電腦模擬的方式,提出手腕的釋放 動作不僅應該需要延遲,而且還要在適當的時機作手腕釋放動作,才能對桿頭有最大的貢 獻。 其中值得一提的是,有些學者在經過對非慣用手手腕的實驗後,卻不認同非慣用手腕 關節因曲腕動作到釋放之間所產生的力矩能夠增加桿頭速度。Jorgensen(1970)使用模擬單 手複擺的模型展現出在下桿過程中慢慢延遲前導手(非慣用手)手腕曲腕時的時間並同時觀 測桿頭速度的變化圖,這個模擬的研究顯現出腕關節所產生的力矩,對於桿頭速度並沒有 顯著的幫助。而有此結果產生,有可能是腕關節無法獨自完成最佳化的動作,因腕關節與 手臂相連,所以腕關節產生的力矩要抵抗旋轉時的離心力時須有手臂的參與,如此才能在 末端產生最大速度。除此之外,Jorgensen 在 1970 年以手臂和球桿兩個部份所組成的模型, 使用電腦模擬的方式,在平面上產生動作,以慣性滑行(freewheeling)的理論,勘查揮桿動 作的過程,於模擬結果中顯示,在下桿時,高爾夫選手會利用曲腕動作以減少手腕與前臂 的夾角角度(decrease the wrist-cock angle),而由此表現出在擊球時的桿頭速度會比高爾夫 球員自然地使用腕關節還具有較少的桿頭速度。因此,他分析出在下桿期間手腕所產生的
力矩是沒有作用的。對於會有這個結果產生,可能是因為 Jorgensen 忽略到腕關節且將手
1. 等速肌力訊號處理與分析:經 Biodex 等速測力機取得雙手肩、肘、腕關節活 動方向的力矩峰值(peak torque)、相對體重力矩峰值(relative peak torque)、動力 (power)、功(work)。
動作分析訊號處理與分析:Motion 攝影機拍攝所得資料經由 EVART4.6 版動作分析軟體處
理,擷取揮桿各時期,雙手肩、肘、腕關節X、Y、Z 三軸向之位移、速度、加速度、角度、
角加速度、作用力、力矩等數值。
高爾夫球揮桿動作測試配置圖如圖三所示。重要儀器介紹如下: 一、Biodex 等速測力機(Biodex Medical System, Shirley, NY ):
(一) 可調整座椅、靠背的傾斜角度、座椅深度,及調整水平位移,可達到任何所需要 的量測位置。 (二) 測試臂可調整與受試者的肢段長度一樣,利用測試臂設定其量測範圍角度。 (三) 由兩個測試臂所組合成連接點需對準所要施測的關節點。 (四) 測試椅可繞旋轉軸旋轉,可調整座椅、靠背的傾斜角度、座椅高低和深度,及調 整水平位移,可達到任何所需要的量測位置。 (五) 利用控制馬達的速度快慢,且在支點處設有一個感應器,可探測出受試者在身體 上肢的關節處(肩關節、肘關節和腕關節)在不同角速度下所產生的最大力矩。 二、Motion 動作分析系統
高爾夫揮桿動作拍攝是透過 Motion Analysis 所開發的 Eagle Digital System 來進行
拍攝。Eagle Digital System 是由數位攝影機 (Eagle Digital Camera) 、集線器 (Eagle Hub)
及Evart 即時軟體套件所組成,可絕對精準地捕捉多樣且複雜的動作。即時捕捉分析的 能力讓使用者能看到和受試者表現出的特殊動作相同的的立即捕捉結果。主要相關元 件則包括: (一)集線器:集線器是由多埠的網路開關組成(傳輸速度 100Mbps) 並提供電源給攝 影機。單一的網路傳輸線 (最長 150 呎) 用來在攝影機與集線器之間傳輸所有訊 號與電源。
由德國 Biovision 公司製造。實驗過程中使用九個頻道。其中一頻道接收分期器所 施放之電訊號,另外八個頻道則用來接收受測肌群之電訊號。主要收集左右兩手之肱 二頭肌、肱三頭肌、伸腕肌以及屈腕肌的肌電訊號,實驗過程中將兩片表面電極片貼
於受測肌群之肌腹位置,兩電極片之間相隔1 公分。
(一) 分期器:為一手動控制之電訊號發送器,可藉由按下按鈕來發送電訊號。此
電訊號可同步傳送至Biovision 頻道中以及 Motion Analysis 動作分析系統的類
下桿期 N A 伸腕肌 B 屈腕肌 C 肱二頭肌 D 肱三頭肌 F 前導手 120 51.13±43.941 42.91±24.77214.72±17.013 47.98±24.98 45.84* 後繼手 120 35.9±28.6378 25.77±16.399 8.99±6.39 52.82±25.43456 133.035* *p<.05 註:1(p<.05)表示 A>D,2(p<.05)表示 B>D,3(p<.05)表示 C>D,4(p<.05)表示 D>A,5(p<.05)表示 D>B, 6(p<.05)表示 D>C,7(p<.05)表示 A>B,8(p<.05)表示 A>C,9(p<.05)表示 B>C (三) 下桿加速期 表5 顯示前導手與後繼手肌電振幅平均數的差異達顯著水準,表示在下桿加速期中, 前導手與後繼手不同部位肌肉呈現的肌電振幅的確有所不同。透過事後比較可以看出,前 導手肌電振幅平均數的兩兩比較,除了屈腕肌、肱二頭肌以及肱三頭肌之間相比不顯著之 外,伸腕肌與這三部位肌群相比均達顯著。觀察平均數則發現前導手伸腕肌在下桿加速期 呈現較高之平均肌電振幅。屈腕肌、肱二頭肌以及肱三頭肌呈現的平均肌電振幅則較為相 近。而後繼手肌電振幅平均數的兩兩比較,除了屈腕肌以及肱三頭肌相比不顯著之外,其 餘均達顯著。進一步檢視平均數發現後繼手屈腕肌呈現最高之肌電振幅,肱三頭肌居次, 其次為伸腕肌,肱二頭肌呈現的肌電振幅則是最低的。 表5 前導手後繼手下桿加速期肌電振幅(Mean±SD) 下桿加速期 N A 伸腕肌 B 屈腕肌 C 肱二頭肌 D 肱三頭肌 F 前導手 120 101.63±56.68123 51.29±34.65 43.49±21.34 50.97±34.42 53.118* 後繼手 120 44.61±29.162 63.81±57.824524.06±23.49 56.53±31.336737.387* *p<.05
註:1(p<.05)表示 A>B,2(p<.05)表示 A>C,3(p<.05)表示 A>D,4(p<.05)表示 B>A,5(p<.05)表示 B>C, 6(p<.05)表示 D>A,7(p<.05)表示 D>C (四) 收桿前期 表6 可看出選手前導手四個肌群活化程度平均數的差異達顯著水準,顯示前導手肌群 之間在收桿前期的活化程度確實有所差異。透過事後比較可以看出,前導手活化程度平均 數的兩兩比較除屈腕肌以及肱三頭肌互相比較不顯著之外,其餘均達顯著。觀察平均數可 看出前導手伸腕肌在收桿前期有相當高的肌電振幅,肱三頭肌及屈腕肌次之,肱二頭肌的 肌電振幅則是較低的。此外後繼手的肌電振幅平均數的兩兩比較,除伸腕肌與肱三頭肌相 比不顯著之外,其他均達顯著。觀察平均數則發現參與者後繼手伸腕肌及肱三頭肌在收桿 前期有較高的肌電振幅,屈腕肌次之,肱二頭肌則顯示較低的活化程度。 表6 前導手後繼手收桿前期肌電振幅(Mean±SD) 收桿前期 N A 伸腕肌 B 屈腕肌 C 肱二頭肌 D 肱三頭肌 F 前導手 120 94.63±63.17123 45.7±24.754 31.8±43.02 47.58±26.605 80.88* 後繼手 120 56.98±39.2613 42.5±37.13 20.28±23.61 54.46±43.545635.13* *p<.05
註:1(p<.05)表示 A>B,2(p<.05)表示 A>D,3(p<.05)表示 A>C,4(p<.05)表示 B>C,5(p<.05)表示 D>C, 6(p<.05)表示 D>B
(五) 收桿後期
表7 顯示選手前導手與後繼手肌電振幅平均數的差異達顯著水準,顯示前導手與後繼
頭肌居次,肱二頭肌則呈現最低的肌電振幅。 表7 前導手後繼手收桿後期肌電振幅(Mean±SD) 收桿後期 N A 伸腕肌 B 屈腕肌 C 肱二頭肌 D 肱三頭肌 F 前導手 120 53.7±34.17123 35.65±28.964513.53±14.12 28.86±22.456 67.398* 後繼手 120 31.38±21.963 27.20±24.255 9.18±11.39 40.64±36.16678 46.985* *p<.05
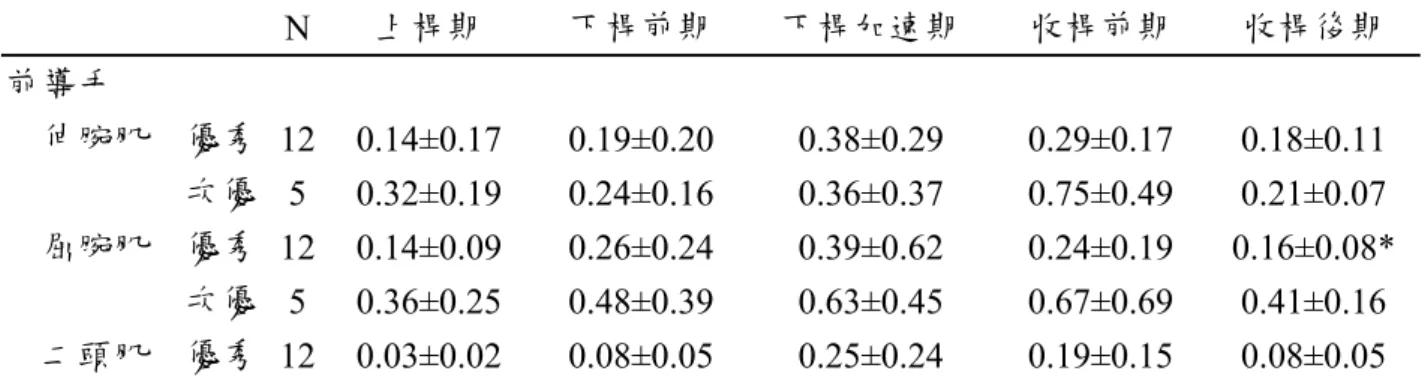
註:1(p<.05)表示 A>B,2(p<.05)表示 A>D,3(p<.05)表示 A>C,4(p<.05)表示 B>D,5(p<.05)表示 B>C, 6(p<.05)表示 D>C,7(p<.05)表示 D>A,8(p<.05)表示 D>B 三、參與者前導手與後繼手各肌群在不同動作時期活化程度的變化 因應高爾夫揮桿動作的特性,參與者手臂單一肌群在不同的動作時期下往往有著不同 的活化型態。因此本研究利用相依樣本單因子變異數分析比較手臂單一肌群在不同動作時 期下的活化程度(%MVC)的差異(p<.05)。手臂肌群則以前導手以及後繼手作為區分。 (一) 伸腕肌在不同動作時期活化程度 表8 顯示參與者前導手與後繼手伸腕肌在不同動作分期下,其肌電振幅的確有所改 變,透過事後比較,前導手五個時期肌電振幅平均數的兩兩比較,除了下桿期與收桿後期 以及下桿加速期與收桿前期相比不顯著之外,其他均達顯著。顯示前導手伸腕肌在下桿期 與收桿後期,以及下桿加速期與收桿前期有著相近的肌電振幅。觀察平均數則發現前導手 伸腕肌的肌電振幅由上桿期持續上升至下桿加速期呈現最高的活化程度。此外,後繼手伸 腕肌五個時期肌電振幅平均數的兩兩比較,除了上桿期與收桿後期、下桿期與收桿後期相 比不顯著之外,其他均達顯著。且肌電振幅平均數呈現逐步增高至收桿前期為最高,顯示 後繼手伸腕肌配合揮桿動作肌電振幅有逐漸向上提升的趨勢並在收桿前期達到最高的肌電 振幅。 表8 男性伸腕肌揮桿動作過程肌電振幅(Mean±SD) 伸腕肌 N A 上桿期 B 下桿期 C 下桿加速期 D 收桿前期 E 收桿後期 前導手 120 33.62±36.39 51.13±43.947 101.63±56.68123 94.63±63.17456 53.70±34.17 後繼手 120 29.08±18.16 35.9±28.63 44.61±29.16123 56.98±39.264569 31.38±21.96 *p<.05
註:1(p<.05)表示 C>B,2(p<.05)表示 C>E,3(p<.05)表示 C>A,4(p<.05)表示 D>B,5(p<.05)表示 D>E, 6(p<.05)表示 D>A,7(p<.05)表示 B>A,8(p<.05)表示 E>A,9(p<.05)表示 D>C。
表9 屈腕肌揮桿動作過程肌電振幅(Mean±SD)
屈腕肌 N A 上桿期 B 下桿期 C 下桿加速期 D 收桿前期 E 收桿後期
前導手 120 28.14±19.33 42.91±24.7756 51.29±34.651234 45.7±27.7578 35.65±28.969
後繼手 120 7.62±4.69 39.75±38.0956 67.81±57.821234 42.5±37.1378 27.2±24.259
*p<.05
註1(p<.05)表示:C>B,2(p<.05)表示 C>D,3(p<.05)表示 C>E,4(p<.05)表示 C>A,5(p<.05)表示 B>E, 6(p<.05)表示 B>A,7(p<.05)表示 D>E,8(p<.05)表示 D>A,9(p<.05)表示 E>A
五、 桿頭速度上,優秀選手只有在下桿前期慢於次優秀選手, 其他時期皆是比較快的, 可能推測是次優秀選手在下桿時過早增加速度,導致過早桿頭速度峰值,無法像優秀 選手在擊球瞬間(Impact)產生較快的桿頭速度。 在下桿加速期的左肩與右肘是優秀選 手產生較快速度的關節位置,進而幫助再擊球瞬間產生較快的桿頭速度。 六、 次優秀選手在上桿時有個突然的加速度產生,可能推測是過度使用手部去抬拉,而產 生不穩定的上桿方式,進而影響擊球準確性。而優秀選手的收桿後期加速度較大可能 推測是有完整的釋放動作,產生加快的加速度,而在接近結束動作肩膀與手腕有較快 的加速度。 下桿前期次優秀選手有較大的加速度可能推測是過早加速導致在擊球瞬 間時能有最快的桿頭速度去擊球。 七、 優秀選手在整個揮桿過程中是呈現圓周運動的情形,所以相較於次優秀選手會有較大 的角度產生。 希望透過本研究對於優秀與次優秀選手的雙手臂揮桿分析後,可以提供教練選手了解 高爾夫揮桿中雙手臂的技術,幫助高爾夫選手或一般球友了解在揮桿過程中雙手臂的肌肉 活化情形與控制機制。進而幫助所有層級選手建立正確的揮桿模型。 主要參考文獻 中文部份: 1.王順正(1997):運動技術分析-運動生物力學研究。復文圖書出版社,高雄。 2.坎貝爾(2003):高爾夫學習百科。城邦文化,台北。 3.楊佳元(2004):比較優秀大專男女高爾夫選手腕部等速肌力與下桿之運動學特 徵。國立體育學院教練研究所碩士論文,龜山,桃園。 4.藍于青、林德嘉(2000):高爾夫揮桿動作之力學應用。大專體育,第51 期,129-134 頁。 5.許樹淵(1986):運動技術指導原理,協進圖書有限公司,台北市。 6.楊佳元、湯文慈(2005):優秀大專女子高爾夫選手其上肢等速肌力與桿頭速度之相 關探討,大專體育學刊,第七卷,第一期,191-199 頁。 7.湯文慈、楊佳元(2005):優秀大專女子高爾夫選手其等速肌力特徵表現,大專體育 學刊,第七卷,第一期,201-208 頁。 8. 胡正明(2006):優秀大專高爾夫選手揮桿動作過程手臂肌肉活動模式探討 。國立體育學 院教練研究所碩士論文,龜山,桃園。(support by NSC95-2413-H-179-012-MY2) 英文部分:
1. Bechler, J. R., Jobe, F. W., Pink, M. & Perry J. (1995). Electromyographic Analysis of the Hip and Knee During the Golf Swing. Clinical Journal of Sport Medicine. 5:162~166. 2. Cahalan, T. D., Cooney, W. P. 3rd., Tamai, K., Chao, E. Y. (1991). Biomechanics of the golf
swing in players with pathologic conditions of the forearm, wrist, and hand. Am J Sports Med. 19(3):288-293.
3. Cochran, A. & Stobbs, J. (1968). The research for the perfect swing. Grass Valley:the Booklegger, p8-147.
4. Jorgensen, T. P. (1970).On the dynamics of the swing of a golf club. Am. J. Physics,38(5):644-651.
Studying Human Movement. Human Kinetic.
6. McLaughlin,P. A. & Best, R. J. (1994).Three-dimensional kinematic analysis of the golf swing. Science and golf II, p12-13.
7. McCarroll (1996). The frequency of golf injuries. Clin Sports Med. 15(1):1-7
8. Pink, M., Peter, J., & Jobe, F. W.(1993). Electromyographic analysis of the trunk in golfers. The American Journal of Sports Medicicne.21(3):385-388.
9. Sprigings, E. J. &Neal, R. J. (2000). An insight into the importance of wrist torque in driving the golfball : A simulation study. Journal of Applied Biomechaics, 16(4):356-362.
10. Sprigings, E. J. & Mackenzie, S. J . (2002).Examining the delayed release in the golf swing Using computer simulation. Sports engineering Oxford England, 5(1):23-32. 11. Suzuki M, Yamazaki Y, & Matsunami K. (2000). Simplified dynamics model of planar
two-joint arm movements. J Biomech. 33(8):925-31.
12. Tang W. T. (2002). Relationship Among Arm Strength, Wrist Release, and Joint Torque During the Golf Downswing. Doctoral dissertation of The University of Texas at Austin. Texas, USA.
13. Watkins, R. G., Uppal, G. S., Perry, J., Pink, M., & Dinsay, J. M. (1996). Dynamic electromyographic analysis of trunk musculature in professional golfers. Am J Sports Med. 24(4):535-538.
14. Wen-Tzu Tang, Cheng-Ming Hu(2007).The muscle activation pattern and coordination of leading arm and trailing arm of elite players during golf swing. Journal of
Biomechanical Science and Engineering,2,(S1),p.S240. (NSC95- 2413- H-179
-012- MY2)
15. Chen J.H., Lee, Y.H. , Yang C.J., Tang W.T (2009). The distribution and the pattern of the
golf grip pressure during the golf putting stroke for expert and novice players, 4th Asia-Pacific Conference on Exercise and Sports Science & 8th International Sports Science Conference, ota Bharu, Kelantan, Malaysia (NSC95-2413-H-179-012-MY2)
運動學的資料上顯示,優秀選手的加速節奏型態不同於次優秀選手組。以較晚的加速及教 的加速度值的技巧來產生擊球揮桿速度。本研究可提供教練選手了解高爾夫揮桿中雙手臂 的技術,幫助高爾夫選手或一般球友了解在揮桿過程中雙手臂的肌肉活化情形與控制機 制,以提供教練技術調整之參考。 關鍵詞:高爾夫、前導手、後繼手、模型、動作分析、肌電
Abstract(修改)
The investigation of bilateral upper extremities coordination and the modeling of golf swing optimization with bilateral upper extremities are important for understanding the mechanism of movement control in golf swing for distal segments. The data collection in this study includes kinetics, kinematics and EMG measurements which provide the input of the modeling. This research are going to recruit 20 golf players (10 low handicapped player, 5 intermediate handicapped, 10 high handicapped players) for data collection and the comparison between different levels and genders. Then, the optimization model of golf swing with bilateral upper extremities will be built to investigate the mechanism of coordination in accuracy and speed performance. The project is executed through three years. Building force measurement system for club holding and the measurement of kinematic, kinetic, EMG, isokinetic parameters will be performed in the first year. However, due to no equipment supporting of force sensor system for the hand from NSC grant, we postponed the force measurement until we found the match grant from different place. I am going to buy hand force sensors and build up the measurement system by September, and measure holding force afterwards. The golf swing of different levels and genders will be measured for the second year through Motion Analysis System. The timing of different phases during the movement (from different phases) were compared between different level and gender golfers. Isokinetic system is used to measure the strength of players after force sensor system is built. Three-dimensional kinematics analysis is used to recorded bilateral shoulders, elbows and wrists motion by motion analysis system during golf swing. Kinematics and EMG data are collected at different phases. The result indicated that the college golf players presented the time domain firing pattern through take away to forward swing. The muscle activation of the muscle at wrist joint and elbow joint also presented the role of cocking wrist, releasing wrist, and maintaining the stability of moving arm. Besides, for player
出席國際學術會議心得報告
計畫編號 NSC 95-2413-H-179-012-MY2
計畫名稱 不同等級、性別高爾夫球選手雙手臂揮桿協調機制之研究與模型建立
出國人員姓名
服務機關及職稱 詹智能;國立台灣體育大學(桃園)教練研究所;研究助理。
會議時間地點 2009/7/15 至 2009/7/17,馬來西亞,哥打巴魯 Grand Riverview Hotel。
會議名稱 APISSC2009第四屆亞太運動科學與第八屆國際運動科學研討會
時進行表演,在晚宴中因為每桌作的成員都是同一個國家的人,所以當中也認識了來自 師大、成大、彰師大、文大…等的教授與學生,因為在異鄉中能夠透過中文侃侃而談感 覺特別開心,從各學校的研究方向聊到來馬來西亞的旅程中一些有趣事情等等的,感覺 有很多說不完的話。2008/7/17 為研討會的第三天,同行的同學有另一篇口頭發表,一樣 與其他同學一起去聽講座,聽完後接近中午時段,大會就舉辦了閉幕典禮,大夥就開心 的一邊用著小點心與互相聊天與拍照各告別了,並且彼此承諾希望可以在下次的研討會 見面。
二、
與會心得
教練所同行研究生
2009/7/15 第一天海報發表與韓國 Kim 與日本 Kazuhiko 教授合照
2009/7/15 第一天海報發表
2009/7/16 第二天晚宴民俗舞團表演
2009/7/17 第三天與工作人員合影
The Control of Club Head in Short Putting after Rhythm Training
Chih-Neng Chan1,Jia-Hong Chen2, and Wen-Tzu Tang2,3
1
Chang Gung University
2
National Taiwan Sport University
3
[email protected] Introduction
Good setup, alignment, touch, feel, green-reading, and stroke mechanics are all necessary for good putting. But without a constant and repeatable rhythm, preferably one that is in sync with the nature cadence of your body, you will never become a great putter(Pelze,2000). Many golf instructors and pros indicated the importance of rhythm in performing a golf putt, however no research focus on rhythm and the effect of rhythm training in golf putting is not studied yet, according to the studies of Libkuman et al.(2002), it indicate that training in timing can improve accuracy in golf for a swing with an iron club or driver. Therefore, the purpose of the studies is to investigate the effect of rhythm training in putting for both beginning level and recreational level players, and the control of club head by the spatial, tempoal, and kinematic parameters .
Materials and Methods
21 volunteers participated in this study: 14 novices randomly assigned to experimental group(NE) and control group(NC) equally, and 7 high handicap (from 25 to 36 ) recreational players to the other experimental group(RE). A novice and a experienced experimental groups received 10 hours of rhythm training with a metronome at the different pace of 54, 80, 108 bpm and the participants were requires to complete various hand and foot exercise in synchrony with the beat, the objective on the part of the participants is to move his or her limb at the same time as that set on the metronome. In other words, the participant attempts to pat or tap his or her hand or foot at the exact moment of the beat, while the novice control group only read golf instruction literature during 5-week training. Each participant of three groups performed pre- and post- tests as accurately as possible at a target distance of 4 feet. The Motion Analysis System with 8 high speed cameras (Motion Analysis Corporation, Santa Rosa, USA) were used to collect the movement of the club and the ball at 120 Hz, and then the error of the direction and distance will be derived to estimate accuracy in direction and distance. The improvement from the training is examined by mixed design two way ANOVA for novice experimental group, novice control group and experimental group respectively through SPSS 17.0.
Results and discussion
The results showed no interaction of Group x Pre-posttest for all the dependent variables. When the main effect of the group was significant, further analyses were also performed, the means and the standard deviations of variables with
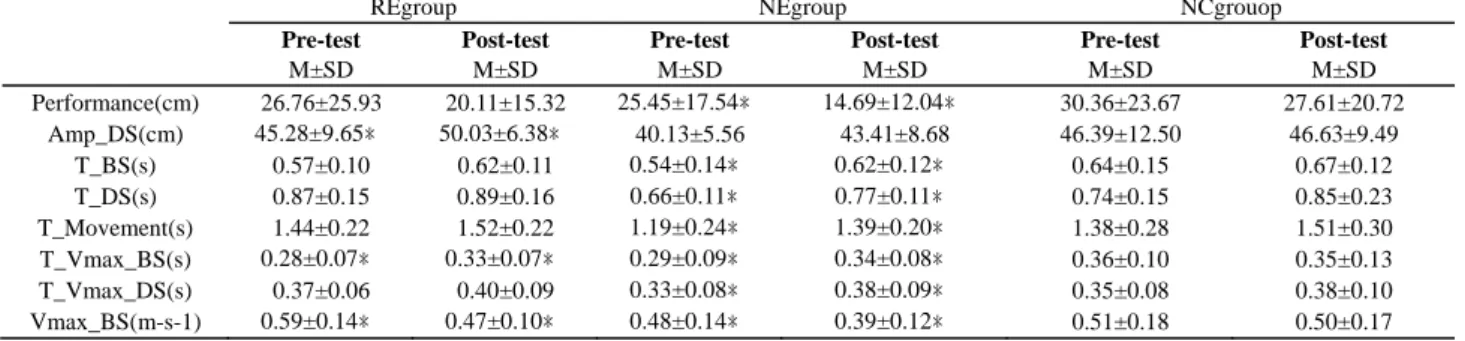
significant difference between pre and post-test were given in Table 1. The performance was significantly decreased only for Novic Experience group (25.45cm vs. 14.69cm, p < 0.05) after training. For the RE and NC group, there showed a nonsignificant difference between pre- and post-test,and further , we investigated the variables related the control of club head as followed.
The amplitude of downswing(Amp_DS) was significantly increased for Recreational Experience group(45.28cm vs. 50.03cm, p < 0.05), and the amplitude of backswing(Amp_BS) showed nonsignificant difference for three groups, but the ratio of Amp_BS over Amp_DS(145:434) of the NE group in posttest was more like the ratio of expert player(roughly 1:3) in the previous research(Delay, 1997) .
The backswing movement time(T_BS), downswing movement time(T_ DS), and the overall movement time(T_Movement) all showed significantly increased only for the NE group (0.54s vs. 0.62s, 0.66s vs. 0.77s, 1.19s vs. 1.39s), these data demonstrated the NE group changed the overall and each phase movement time after rhythm training without any putting instruction, however the RE group did not. In order to investigate the temporal location of peak velocity, we compared the duration of the BS until peak velocity (T_Vmax_BS) in the backswing movement and the duration of DS until peak velocity (T_Vmax_DS). The results showed that T_Vmax_BS was significantly increased for both experienced groups, but T_Vmax_DS was significantly increased only for NE group. The maximum velocity of BS was significantly decreased for the RE and NE groups, but the maximum velocity of DS was nonsignificant different for the subjects.
Conclusions
After ten hours rhythm training in five weeks without any instruction and practice in putting, the novice subjects improved the performance of short putting, and changed the temporal features of the putting movement such as T_BS, T_DS, T_Movement, T_Vmax_BS, and T_Vmax_DS , however the training is hard to change the movement control for the high hadicap experienced players.
References
Delay D, Nougier V, Orliaguet P, et al. Movement control in golf putting. Human Mov Sci 1997; 16 (5): 597-619 Pelz, D. (2000). Dave Pelz’s putting bible.
Libkuman T,Otani H,Steger,N:Training in timing improves accuracy in golf ,J General Psychology,129(2):77-96,2002
Table 1:The comparison of each dependent variable for three groups between pretest and posttest
REgroup NEgroup NCgrouop
Pre-test Post-test Pre-test Post-test Pre-test Post-test
出席國際學術會議心得報告
計畫編號 NSC 95-2413-H-179-012-MY2
計畫名稱 不同等級、性別高爾夫球選手雙手臂揮桿協調機制之研究與模型建立
出國人員姓名
服務機關及職稱 陳家宏;國立台灣體育大學(桃園)教練研究所;任研究助理。
會議時間地點 2009/7/15 至 2009/7/17,於馬來西亞哥打巴魯 Grand Riverview Hotel。
會議名稱 APISSC2009第四屆亞太運動科學與第八屆國際運動科學研討會
發表論文題目
The distribution and the pattern of the golf grip pressure during the golf putting stroke for expert and novice players
優秀高爾夫選手與初學者高爾夫推桿握特徵與型態探討
一、
參加會議經過
很榮幸能夠得到國科會的經費補助,至國外參加研討會並且進行發表。本次參加的
研討會為 APISSC2009(第四屆亞太運動科學與第八屆國際運動科學研討會),於 2009/7/15 至
2009/7/17 於馬來西亞哥打巴魯舉行,會議舉行地點為 Grand Riverview Hotel 的會議廳, 該飯店位於哥打巴魯的郊區,距離市區與哥打巴魯機場差不多要 20 分鐘的車程,由於此 城市比較偏僻並且交通不發達,故都需要搭乘計程車來回各地。
模式是否很不一樣,然後每個人都有拿同一支球桿作實驗嗎?我的回答則是,在優秀選手 中揮桿模式是很接近的,但在初學者則是有許多不同的揮桿策略,並且本實驗每位受試 者都是使用同一支球桿。就這樣我就完成了我的 12 分鐘口頭報告,最後結束直接頒發發 表證明書與大夥一起拍照。下午 4:00~4:45 則是海報時間,我也與同行的同學一起出去觀 賞各個不同主題的海報,也在當中問了六七個有興趣的海報,討論中也了解到各國與各 個實驗室的研究方向與主題,當中也作意見交流,也互留下了 e-mail 希望可以保持學術 上的交流。晚上 8:30 大會還有歡迎晚宴,主辦單位特別安排了中華的傳統美食,供與會 人員品嚐,且還請了當地民俗舞團在用餐時進行表演,在晚宴中因為每桌作的成員都是 同一個國家的人,所以當中也認識了來自師大、成大、彰師大…等的教授與學生,因為 在異鄉中能夠透過中文侃侃而談感覺特別開心,從各學校的研究方向聊到來馬來西亞的 旅程中一些有趣事情等等的,感覺有很多說不完的話。2008/7/17 為研討會的第三天,因 為本人的發表已經完成,所以心情較為輕鬆來到會場,一樣與其他同學一起去聽講座, 聽完後接近中午時段,大會就舉辦了閉幕典禮,大夥就開心的一邊用著小點心與互相聊 天與拍照各告別了,並且彼此承諾希望可以在下次的研討會見面。
二、
與會心得
三、
相關照片整理
研討會飯店 Grand Riverview Hotel 外觀
2009/7/15 第一天海報發表與韓國與日本教授合照
2009/7/15 第一天海報發表與馬來西亞學生交流
2009/7/15 第一天大會註冊處
2009/7/16 第二天口頭報告頒發證書與主持人報告者合影
2009/7/16 第二天口頭報告頒發證書與同行老師同學合影
2009/7/16 第二天晚宴盛況
四、研討會投稿摘要全文
The distribution and the pattern of the golf grip pressure during the golf
putting stroke for expert and novice players
Chen J.H.1, Lee, Y.H 1. , Yang C.J.1, Tang W.T.1, 2
1
National Taiwan Sports University
2
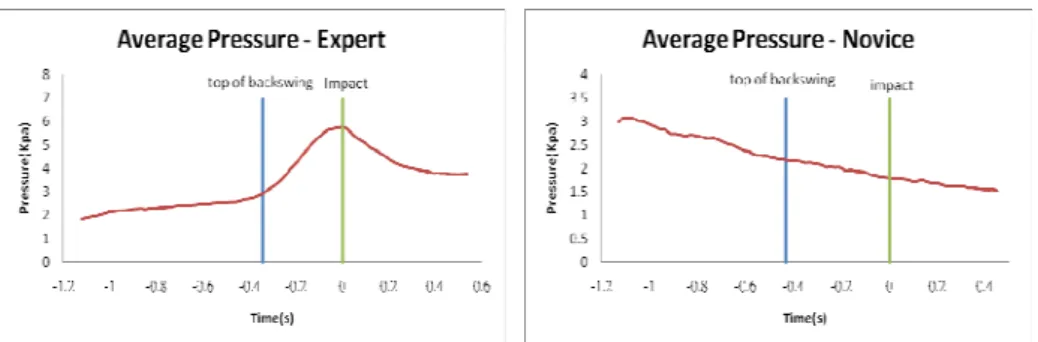
A golf club grip has always been considered as an important fundamental in golf technique (Wiren, 1992). In the previous study of grip force during a golf shot, Komi (2007) point out the subtle differences in grip pressure can affect shot distance and accuracy and may define the difference between the different levels of players. The purpose of the studies is to investigate and quantitatively analyze the difference between expert and novice players' distribution and the pattern of the grip pressure during the putting stroke. 5 male expert and 5 male novice players performed 5 times putting as accurately as possible at a target distance of 12 feet. The putts were performed on a large synthetic grass surface with a phony hole (Pelz, 2000). The grip pressure was measured by Pliance-x System Golf sensor- S2035 with the sensor mat rolled on the putter. The Motion Analysis System with 8 high speed cameras at 150 Hz was used to identify three phases (backswing, downswing and follow-through) of the putting stroke. Main results of the value and grip pressure distribution of the putting stroke are represented by figures. Expert players are showed a consistent low pressure during the backswing, increase beginning from the top of backswing and a peak pressure happening about the impact, decrease quickly after impact and become a consistent low pressure. Novice players have a peak pressure at address, decrease beginning from address to the finish slowly. It was quiet different grip pressure pattern in two groups during putting phases.
KEY WORDS: putting, grip pressure.
INTRODUCTION:
A golf adage suggests "drive for show, putt for dough". Players enjoy the feeling of hitting the ball hard on the range and focus is needed on putting as well. Leadbetter(1997) suggests that Putting is the key to shooting low scores, and the ability to hole putts can turn a good round into a great round, and save a poor ball-striking day with a reasonable score. It has been reported that putting accounts for approximately 40% of all golf shot played (Gwyn & Patch, 1993). Club Grip has always been consider as an important fundamental in golf technique (Wiren 1992, p.73). Cheryl Anderson (2007) indicated that good pressure is the same pressure level you would use when holding a child’s hand. One common drill suggests imagining you are holding a bird or an egg when you swinging the club. Floyd (1998) suggested that the way to hold the putter is “secure”, neither light nor tight. Most of Professional who putt well use very light grip pressure, but few professional, e.g. Tom Watson, has used a very firm grip pressure successfully. Tiger Woods (2007) promoted the importance of grip pressure in putting. He asserted that light, consistent grip pressure is one of the keys to negotiating lightning-fast greens and allows better putterhead release. Many amateurs either grip the putter too tightly from the start or increase grip pressure during the stroke. Either way, they have trouble controlling pace, which is just as important as line. There is limited quantitative research on the optimum grip pressure of putt.
Analysis System to collect the data.
METHOD:
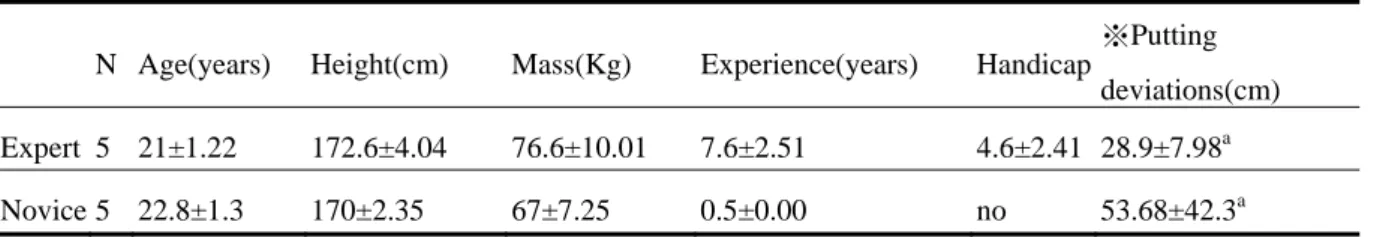
Five expert male collegiate golf players (n=5) and five novice male golf players (n=5) participated in the study (Table 1). Each participant performed 5 times putting as accurately as possible at a target distance of 12 feet putts on a large synthetic grass with a phony hole (Pelz, 2000). The grip pressure was measured by Pliance-x System Golf sensor-S2035 at 50 Hz (1.82cm*1.82cm*64 sensors, Pliance, Novel Inc., St. Paul, MN, USA) with the sensor mat rolled on the putter grip (Figure 1). The Motion Analysis System with 8 high speed cameras at 150 Hz (Motion Analysis Corporation, Santa Rosa, USA) was used to identify each phases of the putting stroke. Phases I, II and III are respectively from the address position to the top of backswing, the top of backswing to impact and the impact to the finish position(Figure 2).
Table 1. Participants Characteristics
※The distance between the hole and the final ball position after the putt
a
: significant difference between two groups (p<.01)
RESULTS:
Main results of the value and grip pressure distribution of the putting stroke are represented in the following figures. Figure 3 were expert players and novice players average grip pressure pattern of putting stroke. In expert N Age(years) Height(cm) Mass(Kg) Experience(years) Handicap
※Putting deviations(cm) Expert 5 21±1.22 172.6±4.04 76.6±10.01 7.6±2.51 4.6±2.41 28.9±7.98a Novice 5 22.8±1.3 170±2.35 67±7.25 0.5±0.00 no 53.68±42.3a
Address Top of backswing Impact Follow through
12ft Phases I Phases II Phases III
Figure 2: Putting phases Figure 1: A: Pliance-x System Golf sensor-S2035; B: Sensor rolls on the putter grip; C: front view
Figure 3. Expert players and Novice players average grip pressure pattern of putting stroke
Figure 4. Five Expert players and five Novice players average grip pressure pattern of putting stroke
players, it showed a consistent low pressure in phase I, in the beginning the pressure about 1.86Kpa and increase slowly to top of backswing about 2.94Kpa.The pressure with a quick leading up in phase II and reaching the peak near the impact about 5.79Kpa. After impact, it showed decrease suddenly in phase III and the finish pressure about 3.78Kpa. In novice players, it showed decrease in phase I, near the beginning it reach a peak pressure about 3.09Kpa, the pressure at the top of backswing about 2.19Kpa.It still decrease in phase II and the pressure at impact about 1.8Kpa, it have similar trend with phase II, it decrease in phase III and have a lowest pressure at finish about 1.53Kpa.
DISCUSSION: Expert
In phase I, the grip pressure showed a consistent low pressure and kept constant. It may related to the skill of stabilizing as indicated by Leadbetter(1997), of minimizing wrist involvement and ensuring that individual putts are performed with the larger muscles of the shoulders.
optimum grip pressure is characterized by low and constant pressure at phase I, increased pressure in phase II and decreased pressure phase III, and maintains the wrist to stabilization.
Novice
In the beginning, the grip pressure reaching the peak pressure and decreased from the start to the finish. Tiger Woods (2007) promoted the importance of grip pressure in putting. Many amateurs either grip the putter too tightly from the start or increase grip pressure during the stroke. Our research had similar point with Tiger Woods (2007) in the beginning; it was tighter than expert players. But it is different with Tiger Woods (2007) decreased from start to the finish. Sander (2003) pointed out increasing club head velocity during the downswing is due to the gravity effect, so the player needs to have a firmer grip. It may stabilize the wrist though the impact in order to control the contact of ball and putter head.
CONCLUSION:
Through this investigation, we can presume the expert players had better putting performance than novice players was low and constant grip pressure in phase I, and increase the grip pressure in phase II to control the club head and stable wrist to get crisp strike at impact. In phase III, the expert players decreased the grip pressure and near the finish kept constant in order to keep the club stability. This study has provided some important quantitative insight into the grip pressure distribution between expert and novice players pattern during putting stroke.
REFERENCES:
Anderson, C., Crowell, B. A.,& Mackin, T. (2007). Teach Yourself VISUALLY Golf. (p. 44) Hoboken, New Jersey: Wiley.
Chen, J.H., Yang C.J., Chan, C.N., and Tang, W.T. (2008). The correlation of golf putting club head velocity and grip force for each phase. Presented in XXVI International Conference on Biomechanics in Sports, Seoul, Korea, July 14-18, 2008.
Floyd, R. (1998). The Elements of Scoring. (p.129) New York: SIMON& SCHUSTER
Gwyn, R.G., & Patch, C.E. (1993). Comparing two putting styles for putting accuracy, Perceptual and Motor Skills, 76(2), 387-390.
Leadbetter, D. (1997). Positive Practice. (p.102) New York: HarperCollins. Pelz, D. (2000). Dave Pelz’s putting bible. New York: Doubleday.
Sanders R.(2003) Seeking Nicklaus-like consistency in putting: an experiment for the BBC. The International Society of Biomechanics in Sport Coaches’Information Service[online]. Available from http://www.coachesinfo.com/category/golf/ 57/
Wood, T. (2007, September). FINDING THE FEEL: Control on fast greens starts with a lighter grip. Golf Digest, 58, 44.
Wiren, G. Golf, building a solid game. Englewood Cliffs, NJ: Prentice-Hall, 1992.