Network Mapping as a Diagnostic Tool
Louise Clark
Network Mapping as a Diagnostic Tool Manual Louise Clark
This publication was made possible with support from the FIT-DFID Programme, Bolivia to the FIT 3 (RedCampo) Project – Boosting the Production and Marketing of High-Value crops through ICT-enabled Information Networks – A project implemented by InforCom of the Centro Internacional de Agricultura Tropical – CIAT, to support the Bolivian Agricultural Technology System – SIBTA (Sistema Boliviano de Tecnología Agropecuaria). The results of this action-research project have demonstrated the utility of social network analysis as a diagnostic tool to improve understanding of how information flows among the different actors involved in agricultural supply chains.
This document is an international public good and any copies made should be distributed free of charge.
© Centro Internacional de Agricultura Tropical – CIAT 2006 ISBN: 958-694-086-1
Printed in La Paz, Bolivia March 2006
English Translation: Alix Shand
Contents
Contents... 2
List of Figures ... 3
1. Who this manual is for... 4
2. Introduction to Social Network Analysis (SNA)... 4
3. SNA as a diagnostic tool ... 5
4. Social Network Analysis: Step by step... 7
Step 1: Survey design ...7
1.1 Open-ended questions...8
1.2 Closed questions ...8
1.3 Defining variables...8
1.4 The survey format ...9
1.4.1 Attributes...9
1.4.2 Ties...9
Step 2: Data collection...10
Step 3: Preparing the database ...11
3.1 Encoding ...11
3.2 Creating a tie database ...11
3.3 Creating a database of the attributes...12
3.4 Making a list of all of the actors appearing in the network ...13
3.5 Filling in the actor’s attributes ...13
Step 4: Preparing the database to be transferred to Netdraw ...14
4.1 Deleting the empty worksheets ...14
4.2 Saving the file as .txt ...14
4.3 Opening the nodes and ties files in Notepad...14
4.4 Putting names with more than one component in quotation marks ...15
4.5 Combining the attribute and node files ...16
Step 5: Using Netdraw ...17
5.1 Opening the file in Netdraw ...17
5.2 Giving structure to the network ...18
5.3 Changing the colour of the nodes ...19
5.4 Colouring the lines ...20
5.5 A first analysis of the network ...21
5.6 Saving charts and files ...23
Step 6: Try for yourself ...24
5. The 2-mode network ... 24
Step 1 Survey structure...24
Step 2: Preparing the database ...25
Step 3: Transferring the data to Ucinet© ...26
Step 4: Visualising 2 mode networks with Netdraw ...28
6. A flexible tool ... 31
List of Figures
Figure 1: Transfer survey data into an excel database Figure 2: Prepare the list of actors for the attributes database Figure 3: Delete repeated actors
Figure 4: Attributes database
Figure 5: Delete the empty worksheets Figure 6: Save as .txt
Figure 7: Prepare the data for the software Figure 8: Prepare the tie data
Figure 9: Combine the attributes and nodes files Figure 10: Open the file in Netdraw
Figure 11: Find the file
Figure 12: Define the type of file Figure 13: The first network Figure 14: Structure the network I Figure 15: Structure the network II
Figure 16: Adjust the nodes in the network Figure 17: Network image
Figure 18: Change the colour of the nodes Figure 19: Select which attribute to show Figure 20: Define the colour of the nodes Figure 21: Change the colour of the lines Figure 22: Select which tie to colour
Figure 23: Network with coloured ties and nodes Figure 24: Show the strength of the ties
Figure 25: Select groups of nodes
Figure 26: The network without one group of actors Figure 27: Select ties
Figure 28: Show individual ties Figure 29: Hide the isolated nodes Figure 30: Save the chart
Figure 31: Save the file
Figure 32: 2-mode network database Figure 33: Organise the database
Figure 34: Encode tie data for a 2-mode network
Figure 35: Transfer the information from the columns to a table Figure 36: A 2-mode matrix in excel
Figure 37: The Ucinet matrix
Figure 38: Copy the excel matrix to the Ucinet matrix Figure 39: The Ucinet matrix
Figure 40: Fill in the empty cells Figure 41: Save the Ucinet file
Figure 42: Open the Ucinet file in Netdraw Figure 43: Find the Ucinet file
Figure 44: The 2-mode network Figure 45: Add the attribute data Figure 46: Find the correct file
Figure 47: Change the colour of the nodes Figure 48: Choose the colour of the nodes Figure 49: Hide groups of nodes
Figure 50: Change the colour of the ties Figure 51: Select the ties
Figure 52: Network structure showing only one type of tie
1. Who this manual is for
Of the inherent challenges faced by development projects when establishing new activities in an unfamiliar location, one of the greatest obstacles is a lack of knowledge of the existing social system or local network which is necessary to understand the structure and characteristics of the relationships local people and institutions have with their surroundings.
Researchers must understand this social system to identify who they are going to work with and how, as well as understanding the relationships that exist among these different actors. There is a high risk of taking uninformed decisions when working within unknown social structures and so it is important to invest time in identifying key actors and understanding the social relationships among them.
Projects are more likely to succeed if researchers establish partnerships with actors who are already well-established and accepted in the sector and area of intervention.
This manual will be a useful tool for identifying these ideal partners and visualising the complex social network that exists in any region, in the hope that being better informed will lead to better planning by development projects.
The manual is written for organisations, research centres, professionals, academics or anyone with prior knowledge of information technology interested in social networks and working in rural development. It gives step-by-step instructions on how to map social networks in order to provide a general picture of the social context which should help project planning by identifying key actors within a specific social setting.
2. Introduction to Social Network Analysis (SNA)
Social network analysis (SNA) is a methodology with increasing applications within the social sciences and to date has been applied to areas as diverse as health, psychology, business organisation and electronic communication. Its use in the field of rural development is still relatively recent and it is hoped that this manual will make this tool more accessible for those working in this field.
The concept of networks is becoming ever more obvious in daily life as people are becoming more connected to each other and it is increasingly common for people to work as virtual networks without necessarily having to meet in physical spaces. As these networks expand there is a growing awareness of the importance of social networks in all settings, whether these are virtual networks as used by international companies or the social relationships used by remote communities to identify a new market for their crops.
Social network analysis has been developed to understand these relationships and has two main focuses; the actors and the relationships between them in a specific social context. These focuses help to understand how the actor’s position in a network influences their access to resources such as goods, capital and information.
This infers that economic activity is linked to social structures, which has led to the concept of social capital.
Information is one of the most important resources that flow through networks and so SNA is often applied to identify both information flows and bottlenecks. In theory identifying these flows and bottlenecks should help identify improved strategies to
encourage different actors to share information based on improving flows in the existing social system rather than seeking to create new ones.
As actors create links with other actors to access resources they form clusters in which actors with the best position are better informed. The actors with access to a range of sources of information usually belong to various clusters, which gives them a certain degree of power as they act as intermediaries for those who have fewer contacts and therefore less access to information. It should be pointed out that the flows are not necessarily equitative meaning that hierarchies are formed based on the position of an actor within the network.
Networks do not only provide access to resources but also to other actors who can help to give value to these resources. This suggests that actors can structure their social networks to maximimise their benefits by getting closer to the existing resources and opportunities. The investment in social relationships to access or mobilise resources in order to generate economic income is called building social capital. The concept of social capital is often discussed in an abstract way; SNA is a tool that can be used to better understand how social relationships can influence local development.
While there is still much work to be done to find ways of using SNA as a tool to build social capital, it is hoped that the first step will be the possibility of at least visualising the relationships among the different actors interacting in a certain setting. There is still much work needed to be done to identify how to strengthen these social relationships to create more equitative conditions for those rural communities not well connected to the networks where resources flow and decisions are made. Nevertheless, it is hoped that this tool will help people to understand how these systems work as well as understand their position within the network.
Much has been written on the analysis and theory of social networks but this, while of interest for many people, will not be discussed here. The idea of this manual is to make tools available to those who have no prior experience of the methodology but are interested in the applications of social network analysis and wish to adapt the tool to suit their needs.
3. SNA as a diagnostic tool
Social network studies usually take one of two approaches: the first with a closed group, for example, to look at the relationships among people working in an institution whereas the second focuses on one person and seeks to understand their egonet or the social relationships surrounding them. In rural development neither of these approaches is appropriate as it would be too expensive to interview all of the actors working in a certain zone or on a specific subject and the techniques necessary for studying personal networks do not work well at the institutional level as inter- institutional relationships are not as transparent as those among individuals. The different sorts of relationships between individual people and institutions also need to be analysed and, in order to fully understand innovation processes, it is necessary to visualize the information flows and exchanges between both levels at the same time.
Rural development projects operate within an extremely complex socio-institutional framework where grassroot organisations, non-governmental organisations, public and private institutions all interact at the local, regional, national or international level. This inherent heterogeneity if further complicated by the tendency of
international donor agencies to fund short or medium-term projects encouraging alliances with various partners which can limit the possibilities for continuity and consolidation of successful experiences.
When the social network analysis methodology is applied as a diagnostic tool, it can help address some of the challenges associated with planning and implementing rural development projects, by showing institutional trends and identifying similar initiatives to avoid duplicating efforts and facilitate the construction of social capital among different actors. Visualising community level and organisational networks can help to understand local relationships by demonstrating the interactions between different groups and identifying the most influential actors.
The maps created by this tool have great potential to provide immediate information about what is happening on the ground. The sociograms or visual graphics are able to capture the attention and imagination of rural actors whose literacy levels are sometimes very low, which may act as a disincentive to participate in research projects or read written reports. The maps can help outsiders to identify key actors in the local network, which can be a good guide for deciding who to involve in a project or at least who to consult during the initial stages in the hope that involving them in planning and implementation will lead to better participation and more rapid appropriation of innovations. This visual material is also a good starting point for encouraging key actors to discuss their relationships and the benefits of working together to construct a network based on common needs.
The wide variety of actors and number of topics that interlink in the field of rural development should not be seen as a hindrance for an SNA study but rather what supports the validity and utility of SNA as a diagnostic tool, to provide quick, visual and extremely useful results for those working in this discipline.
4. Social Network Analysis: Step by step
The graphics in social network analysis are based on two types of information:
1) the nodes which represent the people or institutions, and 2) the ties; the different relationships among the actors or nodes.
One of the problems faced in any social context is that the actors are not homogenous meaning it is important to distinguish among different social groups. SNA is able to define between groups using the attributes that represent the different characteristics of the groups being studied. These attributes can refer to the social status (rich, poor), educational level, economic activity, sex, etc. and each can be represented in the maps using different colours or shapes.
The ties show the different types of relationships to be measured. For the purposes of this manual the example used is information flows among the different actors in the coffee supply chain in Bolivia. Nevertheless, it is hoped that this same procedure can be applied to other focuses such as flows of ideas, goods or crops to show the different types of relationships in a range of social settings.
When thinking about doing a network analysis to conduct a diagnostic for a project, it is important to be clear about what information is needed. This tool is very versatile for visualising social relationships but it is also important to recognise its limitations and the usefulness of the results obtained will depend to a great extent on how clear the ideas were from the very beginning. Before beginning it is very important to think about which actors’ attributes we are interested in and the types of relationships that we wish to show in the network maps.
Sample size also needs to be carefully considered. It is important to have a sample that is large enough for a map to show trends and identify the most important actors as well as those who are isolated from the network while ensuring that the sample is not so large that it will lead to very complicated maps that are difficult to interpret.
Once the social relationships and attributes of the actors to be mapped have been defined, a questionnaire is needed to conduct on a representative sample of the different types of actors.
Step 1: Survey design
Keep the questions short and straight to the point, especially if the survey is to be done in rural areas with producers, so that they can give concrete answers, do not become confused by the questions and nor do they take up too much time. Previous experiences with more traditional surveys have shown that people tend to become bored when having to answer too many questions. The aim of this tool is to obtain the maximum amount of information in the shortest possible time to find results that allow the researcher to have an overview of the relationships and activities within that social context.
It is also possible that the social network study will form part of a more traditional study which covers topics other than social relationships and whose results will be analysed separately. As with any survey the researcher should consider how to phrase the questions using simple language so they are not misunderstood by the
respondents. The anticipated answers should also be considered as well as how these will be encoded. Both open-ended questions and closed questions can be used.
1.1 Open-ended questions
There are many advantages to asking open-ended questions where the respondent is free to give a spontaneous response. Using this question type prevents researchers, often foreigners, from bringing their own prejudices or expectations into the study and the results reflect the viewpoints of those being interviewed. However, it should be remembered that analyzing the data from replies to open-ended questions takes more time and that the same researcher will still be imposing their criteria when grouping and encoding the responses.
1.2 Closed questions
Closed questions anticipate all possible responses and these are grouped and encoded before data collection starts, so that when the survey is filled out in the field a simple code is used instead of recording complete responses, which can significantly increase the time needed to conduct the interview. While this method loses some of the detail of the information being gathered, it is also important to recognise that it significantly simplifies the task of conducting the analysis.
Most researchers will have prior experience in compiling surveys and questionnaires and so are able to predict the majority of responses although always including an open-ended category for unexpected responses (Other, please specify).
Which of these methods to use will depend to a great extent on the needs of each researcher and the purpose of their study. It is important to find the correct balance as if this part is badly planned there is the danger that all of the responses will fall into the same category limiting the possibilities for analysis of different tendencies.
The questions on the attributes, just like those to define ties, also need to be thought through carefully.
1.3 Defining variables
It is important to avoid the temptation to ask too many questions for fear of leaving out something that might be relevant. While it is important to recognize the importance of being methodical, often a researcher finds that much of the data collected is of little use when conducting the analysis, due to the sheer quantity of information or because the collected data does not show anything new. It is important to emphasise that this tool is for gaining a diagnostic overview of the social relationships in a certain setting but does not allow for great detail. For this reason it is recommended to limit the number of variables, both for the attributes and the variables, to around two or three per group.
The idea is for the map to serve as a diagnostic tool that can be used later for a more in-depth analysis with the actors themselves. In this way the researcher will be better prepared for conducting interviews and identifying relevant topics for further discussion, assuming of course that the actors are willing to discuss the situation revealed by the maps.
The example used throughout this manual is a coffee supply chain, which includes a wealth of actors. The study focused on the information flows among the different actors in the chain. The key variable of the attributes was each person’s role within the supply chain differentiating between producers, Producer Associations, traders, support services, etc. Two key variables were defined for the ties: the type of information (e.g. crop management, prices, and commercialisation) and the means of communication used to broadcast this information among actors (e.g. telephone, internet, radio, etc.).
1.4 The survey format 1.4.1 Attributes
The attribute information enables us to distinguish among the different types of actors appearing in the map. Examples of attributes that can be used to group people together are their role in the supply chain, level of education, access to resources, etc.
These attributes may be related, for example, area of cultivated land and production volume.
It is important to ensure that the questions are simple and easily encoded.
1.4.2 Ties
It is important to be clear about which relationships are to be mapped in the study. A colour can be assigned to represent the different relationships so that they can be easily distinguished in the network map.
In the example taken in this manual the ties show two different types of flows, information subjects and communication media. Thus, the ties are codified to represent quantitative values. The structure of the survey used to gather this information can be seen in table 1.
Table 1: Survey used to understand information flows
Actor in the chain Type of information Communication media
It should also be pointed out that a numerical value can also be given to the relationships, e.g. how often they are in contact per week, the perceived usefulness or reliability of the information obtained. The structure used by a survey to gather this information can be seen in table 2.
This format corresponds to more traditional uses of SNA, in that the strength of ties is defined by quantitative data.
Table 2: Survey to give a numerical value to the information flows Person, organisation or
institution Type of information
Usefulness of the information
(scale: 1 min. - 5 max.) 1 2 3 4 5 1 2 3 4 5 1 2 3 4 5
A final decision to be taken at this stage is whether or not to limit the number of actors respondents can name. This decision assumes that if people can only name up to five information sources they will name the most important ones; however if they can name more the study will gain a clearer idea of how many information sources that particular respondent thinks are important. The second option offers the advantage of not only identifying which actors are named most often but also identifies respondents who name the most people, suggesting that these are the people who have the most contacts and are more aware of their social environment.
Step 2: Data collection
When the questionnaire is ready, it is time to think about how the information will be collected and who will do the fieldwork. There are many logistical and methodological factors to be considered at this stage.
Among the logistical issues are the human and financial resources available for the study. Time and money are always factors that limit research possibilities and the researcher will have to decide whether to collect data themselves or hire survey teams, which will mean training them to understand the purpose of the survey including a basic orientation on how to use the tool as it is likely the structures of the questions will be new to most people. There are no definite answers to these questions and to a great extent they will vary from study to study.
From a methodological perspective, certain decisions also need to be taken with respect to defining the scope of the study which will have significant implications in defending the accuracy of the study to truly show the social relationships within the setting being studied.
First the geographical boundaries of the study need to be defined, i.e. where the surveys will be carried out. Logistical considerations need to be factored in such as accessing remote communities as well as transport costs. If the study is to be done in various communities or municipalities, it is important to define whether there will be a coordinator or a team divided between different zones.
Then it is necessary to define the sample size. At present there are no set answers concerning the number necessary to conduct a study of this type but once again it should be pointed out that network analysis is a diagnostic tool that gives an idea of what is really happening on the ground and the aim is not to go into more detail. If information is to be gathered from different groups, such as from different communities, or different people in the chain, it is important that the sample represent all of these groups.
Finally the researcher needs to decide where to start. It is a good idea to start the survey with the contact in the area of intervention and from there link up with other contacts working in the same area. The contacts named as information sources in each survey represent other actors who should be interviewed using snowball techniques to slowly build up a map of existing relationships. In order to guarantee that the study has a wider vision of relationships than only those linked to this initial actor, a variety of different starting points should be identified if possible.
When working with producers, who are usually geographically disperse, the researcher should think about the representativity as they have networks within their communities and also belong to other, larger networks where they interact directly with institutions.
This methodological issue is very interesting as this type of study will identify how individuals are linked to or interact with institutions, making it important to decide how to best show the relationships among these two different groups. It is suggested that individuals and institutions are shown by different shapes when plotting the network map.
Step 3: Preparing the database
Once the surveys have been completed the data needs to be transferred into an Excel database. This work needs to be done very carefully (this is where the advantages and disadvantages of open-ended and closed questions will come into play).
Two databases should be created: one with the information on the nodes and their attributes, and the other with the tie information. It is easier to start with the database on the ties as this can then be used to create the database on the nodes.
3.1 Encoding
Every questionnaire will contain a list of names and the corresponding information depending on the data collected in each survey. If open-ended questions were used now is the moment to systematize and codify them. Using over 10 types of information in each category is not recommended.
When using the ties to define qualitative values of relationships, all of the data must be coded and numbered. For example:
Information Communication
Certification 1 Visit 1
Crop management 2 Telephone 2
Irrigation 3 Mobile phone 3
Post-harvest management 4 Fax 4
Climatological conditions 5 Internet 5
Transformation 6 Post 6
Prices 7 Workshop 7
Organisational Strengthening 8 Radio 8
Markets 9 Video 9
Other 10 Poster 10 3.2 Creating a tie database
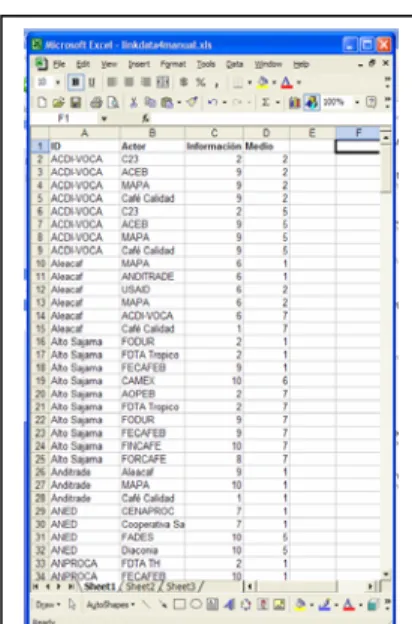
Excel is used to create a four-column database (Figure 1): In this case the four columns are:
1) Actors interviewed (the name of the person interviewed is repeated for each person they have named),
2) Actors named, 3) Type of information
4) Means by which the information was accessed.
The first two columns follow the same format in all social network studies, while the second two columns will vary depending on the variables chosen for the study. It is also possible to have more columns with more data if more variables were defined when the study was designed. It is tempting to try and present more information, but
there is a constant conflict in these studies of trying to go into specific detail and gaining a general picture of the overall context.
It is possible to have more than one tie between the same two actors demonstrating that more than one type of information flows between them.
Figure 1: Transfer the surveys onto an excel database 3.3 Creating a database of the attributes
The tie database contains the names of the actors appearing in the network and can save time in creating the node attributes database (Figure 2), which requires making a list of all of the actors in the network.
Open a new excel spreadsheet. Copy the two lists of actors (interviewed and named) from the tie database.
Paste the two columns into one column to generate a list where many names are repeated.
Figure 2: Prepare the list of actors for the attributes database
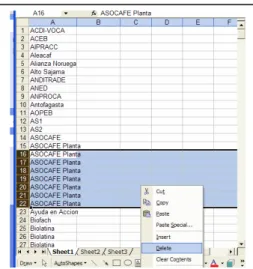
3.4 Making a list of all of the actors appearing in the network
To delete repeated names go to Data – Sort – Ascending.
This will sort the names into alphabetical order where it will be easy to see which are repeated. This also shows actors whose names may vary in the database, usually due to typing errors during data entry. Delete the repeated names (Figure 3) and the result will be a list containing the names of all of the actors in the network.
Figure 3: Delete repeated actors
3.5 Filling in the actor’s attributes
This list of names will form the basis of the node attributes database. Add columns (Figure 4) containing the information collected to define the attributes of each of the actors.
Figure 4: Attributes database In this case there are 4 columns:
1) ID, which is the name that will appear on the chart (and must correspond to the information in the tie database).
2) Full name, of the Producers’ Organisations, for example.
3) Type of actor (producers, associations, institutions, etc.) 4) Geographical location of the actors.
It is worth pointing out that this is a complete list of all of the actors that appear in the network, both those interviewed and those named. Therefore it is possible that there is no attribute information for some of the actors as they may have been named by others but not actually interviewed themselves. One has to decide what to do with the nodes that have no attributes; the attributes can be completed using existing knowledge of these actors or by consulting secondary sources or they can be simply be filled with no_data. No cell should be left empty.
Some other recommendations for your consideration:
• Use short names so as not to complicate the chart.
• Do not leave any spaces between names.
E.g. Local Government = Loc_Gov (this will save a lot of time at the next step)
When the databases are complete they need to be made ready to be transferred to the visualisation software.
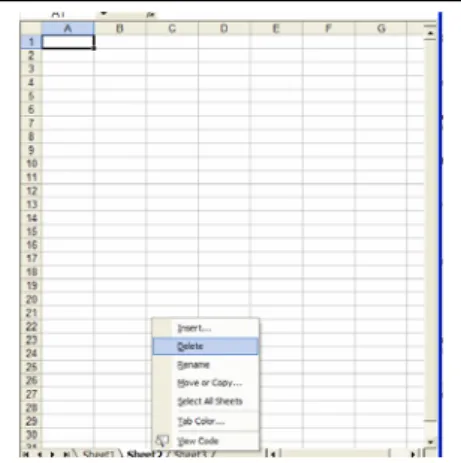
Step 4: Preparing the database to be transferred to Netdraw 4.1 Deleting the empty worksheets
After the previous step is finished, save as a .txt file (Figure 5). Excel only allows a file to be saved as .txt if there is only one worksheet (a new file usually opens with three worksheets; and so the remaining two must first be deleted).
Figure 5: Deleting the empty worksheets 4.2 Saving the file as .txt
Now both of the files (ties and attributes) have to be saved in the .txt format (fig 6).
To do this go to Save as, when the window opens there is the option of saving in a number of formats (Save as type). Give the file a name and choose Text (tab delimited) (*.txt).
Figure 6: Save as .txt
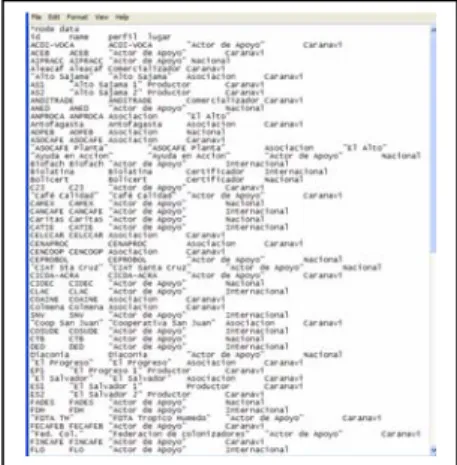
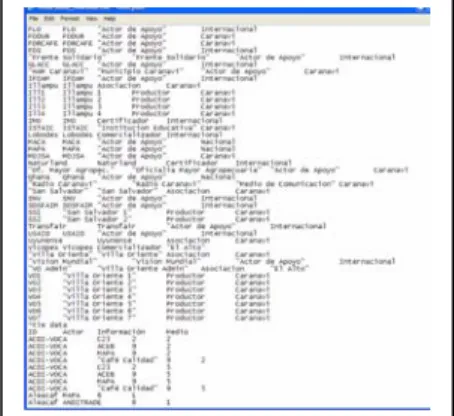
4.3 Opening the nodes and ties files in Notepad.
Once saved as .txt, the file should be opened again in Notepad to make some last adjustments before it can be introduced into the network visualisation programme (Netdraw).
There are two files, one for attributes (Node Data) and the other for ties (Tie Data) (Figure 6). These two files need to be combined. First open the attributes file in notepad and do the following: (This can also be done while still in excel).
In the first line add *Node Data.
Check that the second line contains the names of the columns (the attributes), which in this case are:
ID name “type of actor” location
4.4 Putting names with more than one component in quotation marks
Where there is a space, place names in quotation marks. E.g. “Support Service”. This is painstaking work but very important (Figure 7). If the data are not in quotes the software will take each word as a different piece of information.
Figure 7: Prepare the data for the software
The ties database has to go through the same process (fig 8) so that the Netdraw programme can recognise the data but in this case the first line should be:
*Tie Data.
Likewise in the second row (which will be the relationships) the corresponding relationships should be included:
from to information means
Also those data with multiple words should be put in quotes.
Figure 8: Prepare the tie data
4.5 Combining the attribute and node files
The next step is to combine the node and tie data into one file (copy and paste). The attributes information (*Node Data) should be entered first, followed by the ties information (*Tie Data). No row should be left blank.
It is possible to combine the two into one file when still working with excel depending on the user’s preference.
Sometimes the data has to be adjusted to check for errors and working with the two separate files can sometimes make it easier to find the mistakes in the data.
Figure 9: Combining the node and tie data
When the information is ready it should be saved again under a new name. Now the data is ready for input into Netdraw.
Step 5: Using Netdraw
What is Netdraw♣?
Netdraw© is a software tool used to visualize social networks which can be downloaded free of cost from the internet by going to the following address:
http://www.analytictech.com/netdraw.htm
Netdraw is constantly being updated and improved. This manual is based on version 2.29 (downloaded 9 February 2006).
Netdraw reads files in different formats, this manual uses the .vna format, as this is the simplest way to convert data from an excel spreadsheet.
The programme does not require much file space and so can be downloaded in a short amount of time. The software comes with a basic manual.
5.1 Opening the file in Netdraw
Once it is installed, open the programme and a new window appears. Go to Open where various options will appear. Click on Vna Text File and then Complete (Figure 10).
Figure 10: Open the file in Netdraw
With the tie and node data combined all of the information necessary is in one file. Once the correct file has been found open it in this window (Figure 11).
Figure 11: Find the file
A new window with two columns will appear. In the first column where is says
File format mark .vna, and in the second, Type of File mark Network with Attributes (Figure 12).
Figure 12: Define the type of file
♣ Borgatti, S.P. 2002. Netdraw: Graph Visualization Software. Harvard Analytic Technologies
Then the first image of the network will appear (Figure 13).
Fig 13: The first network
If it does not appear as shown in Figure 13 it means there is an error in the data and it will need to be checked again.
5.2 Giving structure to the network
The next step is to give the network some structure.
Go to Layout → Graph-theoretic Layout → Spring Embedding (Figure 14).
Figure 14: Organise the network I
The window below will appear (Figure 15), click on OK.
Figure 15: Organise the network II
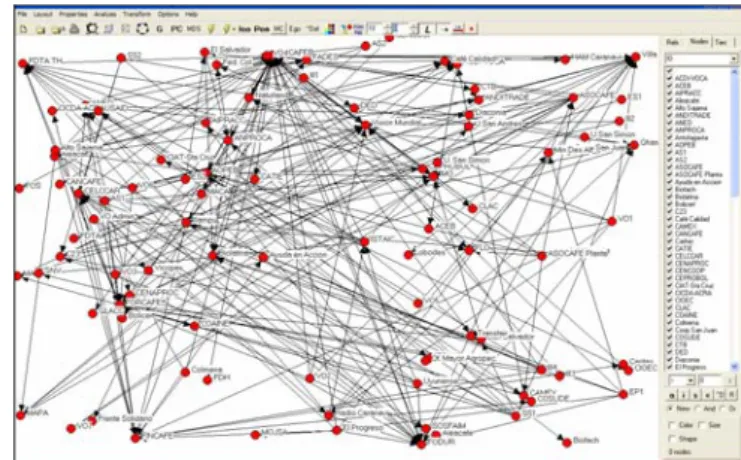
Now the network map is easier to read (Figure 16). This step can be repeated until a clearer network image appears. The reader can also experiment with the other layout possibilities to see if they create network structures more visually pleasing to the purposes of other studies.
It should be mentioned here that this manual does not aim to explain what all of the features mean or how they work but rather it is a simple guide on how to create sociograms without going into unnecessary detail on software functionality.
Figure 16: Adjust the nodes in the network
Some loose nodes may appear (Figure 16). This may be due to a mistake in the data (a comma, a space, an extra letter or one missing, etc.). These nodes may also simply not be connected to any other actor in the network. In order to find out why the nodes are isolated it is important to go back to the .txt file and check everything thoroughly.
These adjustments are normal and it takes patience to obtain the correct chart (Figure 17).
Figure 17: A Network map
5.3 Changing the colour of the nodes To change the colour of the nodes, go to
Properties → Nodes→ Color → Attribute Based (Figure 18).
Figure 18: Change the colour of the nodes
This will open the following window (Figure 19) with a list of the attributes defined in the database.
Figure 19: Select attributes
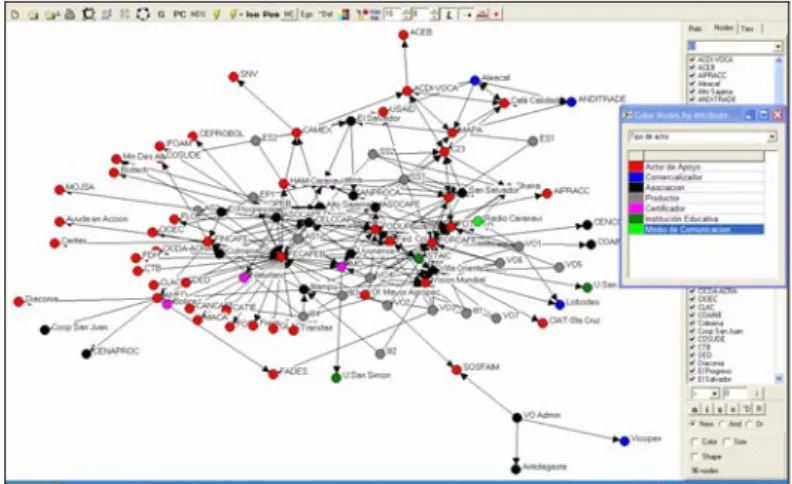
To change the colour of the nodes, select one of the attributes. “Type of actor” was chosen for this example. A window will appear with various colour options (Figure 20) for the different attributes assigned to the actors. Assigning different colours to the nodes makes it easier to identify tendencies from the map. The colours for the different groups can also be changed by double clicking on the type of actor in the
´Color Nodes by Attribute´ window.
Figure 20: Define the colour of the nodes 5.4 Colouring the lines
There is a way of changing the colour of the lines (Figure 21) to differentiate types of relationships (in this case, information).
The step is: Properties → Lines → Color → Tie Strength.
Figure 21: Change the colour of the lines
In the window that appears (Figure 22) choose the information (values) whose colour is to be changed.
Figure 22: Choose which tie to colour
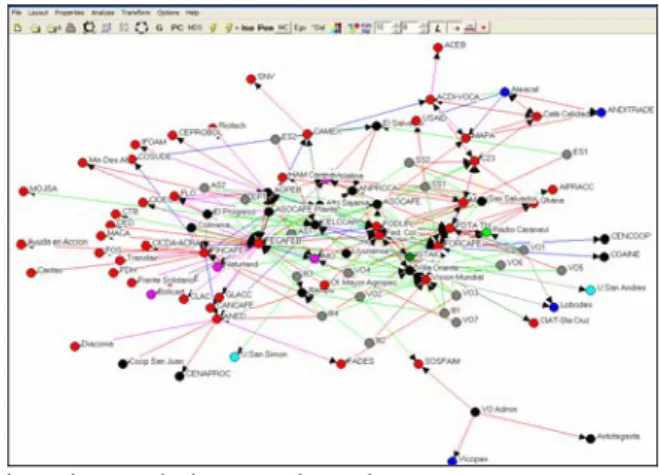
Below is a chart showing the social relationships in the network (Figure 23).
Figure 23: Network with coloured ties and nodes
The thickness of the ties can also be increased but only if they are encoded between 1 and 5 as shown in the second survey above.
Go to Properties→ Lines→ Size → Tie Strength (Figure 24).
Figure 24: Show the strength of the ties 5.5 A first analysis of the network
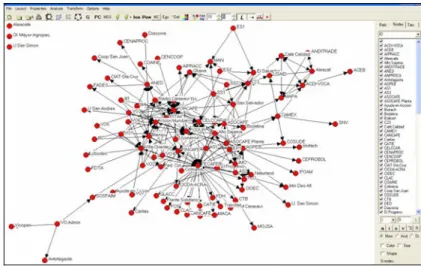
At first sight the network looks very complicated but it is possible to focus on specific groups of actors so that the analysis becomes simpler and tendencies are easier to see.
Go to Nodes in the window on the right-hand side of the screen (Figure 25) where the different agrupations of the actors according to their attributes. For this example we chose “Producers”.
Figure 25 Choose groups of nodes
If groups of actors are unselected in this box, they will temporarily disappear from the map, as seen below with the producers (Figure 26). Using this tool the relationships within and between different groups can be analysed either in isolation or overlapping with other groups depending on the purpose of the analysis.
Figure 26: The network without one group of actors
To bring back the invisible nodes, either tick the empty boxes in the window to the right of the screen or on the ~Del button on the tool bar.
This same procedure can also be repeated with the ties. The steps are similar: In the window on the right where it says relations, tick the type of information that is to be focussed upon (Figure 27).
Figure 27: Choose ties
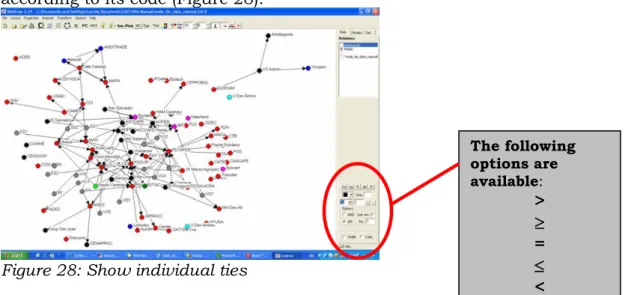
Then in the next window choose the value of the relationship which is to be shown according to its code (Figure 28).
The following options are available:
>
≥
= Figure 28: Show individual ties ≤
When one or more groups of ties are eliminated then some nodes will become isolated from the rest of the network cluster. These can be left in the picture or hidden. To hide isolated nodes go to the tool bar and click on the Iso button (Figure 29).
Figure 29: Hide the isolated nodes
The structure of the network will have changed, creating loose groups separated from the main network cluster meaning that this specific subject of information does not reach the entire network and sub-clusters may have formed with no direct relationship between them.
To return to the complete network map ties click again on the empty boxes in the window, making sure that all ties are visible in the box in lower right hand corner (>0) or on the ~Del button on the tool bar.
This is a basic introduction to the analytical possibilities of this tool but there are many other features. It is important to try out the other options offered by the software.
5.6 Saving charts and files
It is now time to save the work done (Figure 30).
To save go to File → Save Diagram as and choose the file type.
From this programme the maps can be saved in different formats such as jpeg, bitmap or metafile.
Figure 30: Save the chart
In order to save the data that has been worked on so that the next time the file is opened the nodes are the same colour and in the same position, choose the Vna format.
Go to File → Save Data as → Vna → Complete (Figure 31).
Figure 31: Save the file
Step 6: Try for yourself
This manual is a very basic introduction to how to use this software. It is hoped that it will provide a sufficient understanding to give the user confidence to start to experiment with the tool and discover potential applications for their own work.
5. The 2-mode network
The 2-mode network is a more complex way of showing information as it has two different types of nodes, for example to visualize the relationships among actors and their information requests in order to facilitate analysis of often very complex relationships between different social groups and certain subjects.
Below is an exercise which will demonstrate how to use the 2-mode network. 2 modes will be used: the actors themselves and their different information demands to see how they are distributed in the map. Please note the data used in this exercise are simulated.
The Ucinet©∗ programme is needed to create a 2-mode network. This programme is not free and requires a license. It can be downloaded from the internet at the following address: http://www.analytictech.com/ucinet.htm
Step 1 Survey structure
The same considerations as those above apply to preparing a survey to collect information to create a 2-mode network.
The survey structure is a simple table of two columns as seen in table 3. There will be a list of information each actor would like to receive (i.e. the information that they need) and the communication media by which they would like to receive it. The variables suggested in this table can be changed to suit the specific needs of each study.
Table 3: Structure of 2 mode survey
Information demand Communication media by which they would like to
receive it
∗ Borgatti, S.P. , M.G. Everett & L.C. Freeman. 2002. Ucinet 6 for Windows: Software for Social
Step 2: Preparing the database
This produces a three-column database (Figure 32). The first column represents the person interviewed, repeated for each separate demand, the second is the list of the information demands and the third is the means by which the producers wish to receive the information.
It is possible to create a 2 mode network with only the first two columns.
Figure 32: 2-mode network database
This data is then used to create a table. As before all data has to be codified. In this example the desired communication media for receiving information is the tie variable.
Go to Tools → Sort (Figure 33).
Sorting the data in the 3rd variable column makes encoding much easier.
Figure 33: Organise the database
Substitute each different response with a numerical value to make a simpler list.
Remember to make note of which number represents which value.
Figure 34: Encode the tie information for a 2-mode network
Once the information is encoded, it needs to be placed in a matrix (Figure 35). The list of actors is the first column and the list of information demands is the first top row.
The easiest way of doing this is to organize the information demands using the Sort function in excel and one by one fill in the columns of the matrix with codes representing the different communication media, which have already been assigned a numerical value (although if only using the first two columns these will be binary).
Figure 35: Transfer the information from the columns to a table
Once all of the data have been entered the result is a matrix as shown in Figure 36.
Figure 36: A 2-mode table in excel
Step 3: Transferring the data to Ucinet©
The next step is to open Ucinet©. When it opens the screen will be blank.
Go to Data → Spreadsheets → Matrix (Figure 37).
Figure 37: Open a table in Ucinet
Once the Ucinet spreadsheet is open, copy the excel table and paste it into the Ucinet table (Figure 38).
Figure 38: Copy the excel table to the Ucinet table
It is important to check that the dimensions of the matrix as shown to the right of the spreadsheet (Rows / Cols) agree with the values of the matrix that has been imported (Figure 39).
Figure 39: The Ucinet table
All the empty spaces must be filled in with an 0.
To do this go to Fill → Blanks w/0s (Figure 40).
Figure 40: Fill in the empty cells
Save the file as a Ucinet database Go to File - Save as (Figure 41).
Note that all Ucinet files are saved as (.##h).
Figure 41: Save the Ucinet file Now the data is ready to import into Netdraw in order to visualise the network.
Step 4: Visualising 2 mode networks with Netdraw
Using Netdraw to create a 2-mode network is very similar to creating a 1-mode network except that now the data is in a different format.
First open Netdraw,
Go to File → Open → Ucinet Data Set
→ 2 Mode Network (Figure 42).
Figure 42: Open the Ucinet file in Netdraw
In the window that appears search for the name of the file to open (Figure 43).
Make sure the following options are selected:
File format: → Ucinet and
Type of Data: 2 mode network → OK.
Figure 43: Find the Ucinet file
The 2-mode network (Figure 44) chart appears showing how the actors are grouped around different information demands.
Figure 44: The 2-mode network
G Gi
Figure 45: Add the attributes The network map can be enhanced by adding
attribute data. This is done in the same way as before. The .txt files are Ucinet compatible.
Go to File → Open → Vna text file → Attributes (Figure 45).
Ucinet can also be used to create an attributes database. Both sets of nodes can be given attributes but only one attribute database can be used at a time.
A window will open from which to select the attribute file created in the same way as for a 1 mode network (Figure 46).
Make sure to choose:
File form: Vna and Type of data:
Node Attribute(s) → OK.
Figure 46: Find the correct file
Once this information has been added the node colour can be changed in exactly the same way as shown for 1 mode networks.
Go to Properties → nodes → color → attribute based (Figure 47).
Figure 47: Change the colour of the nodes
In the window that appears to the right of the screen select the attribute which will be used to colour the nodes. In the example in Figure 48 the different colours represent the number of cows owned by the producers interviewed.
Figure 48: Choose the colour of the nodes
Groups can be hidden depending upon their attributes to facilitate a more detailed analysis (Figure 49). As for the 1 mode network go to Nodes and unselect the group(s) of actors which should be hidden.
Figure 49: Hide groups of nodes
The programme also allows the colour of the lines to be changed to highlight the different communication media that have been suggested to receive each type of information.
Go to Properties → Lines → Color → Tie strength (Figure 50).
Figure 50: Change the colour of the ties
This function makes it possible to highlight very specific information. For example, if we only want to see what types of information people want to receive from the radio, go again to the window on the right: relationships and chose the number assigned to the radio (which for the purposes of this exercise is the number 6) and only these lines will appear.
Figure 51 shows that some of the information nodes are now isolated from the rest of the network. This means that no one has requested to receive those types of information from the radio. Different combinations of relationships can be selected depending upon the finality of the study in question.
Figure 51: Select tie variables
This new network can be given shape using the same layout tool as for a 1 mode network.
Figure 52 shows the new network structure when looking at requests for information through the radio.
Figure 52: Network structure showing only one type of tie
6. A flexible tool
As stated at the beginning of this text, the aim of this manual is to make social network analysis (SNA) widely available to people working in rural development and other sectors in which there are highly complex social networks, as these can either help or hinder the work of researchers and development projects, depending upon the relations they establish with these existing networks.
This manual can be adapted to the requirements of people and organisations working in many different circumstances. The potential variety of users in different sectors will be fundamental to updating the manual as this is a new tool whose applications still need to be explored and tested. Therefore each user should use this methodology according to their own needs and interests, identifying the how best way to use it to understand the complex social relationships that have an influence on local development. All contributions are welcome to continue streamlining and validating this methodology.
It is hoped that by simplifying SNA more users from different sectors will be able to access it as it is a flexible, practical tool that has a huge potential in the development and research sectors. It is still too early to come to any final conclusions and for the time being it is important to continue to apply this tool in a variety of different situations to further understand and evaluate both the potential and limitations of this methodology.
There is no single answer to explain the ‘why’ of poverty, nor the ‘how’ of development; understanding the combination of factors that lead to the success or failure of development projects requires flexible thinking and the ability to make constant adjustments. This manual seeks to help practitioners and researchers understand the complementarities and conflicts that exist among different actors and initiatives in the development sector in the hope that this tool will eventually take is place among the wide range of methodologies that are used to understand and encourage development processes.
Naturally those using this manual will have a lot of questions about SNA and the results it provides. This manual deliberately does not discuss how to carry out the analysis of results, so that each user is free to draw their own conclusions, reading the maps according to their own points of interest and highlighting the importance of seeing the same reality from different points of view. The concept that supports this idea is that visualising social networks can help people to understand how complex their environment is and use this as a first step towards making positive changes.
It is hoped that this manual will be a starting point which will enable users to understand the practical details of social network analysis, so that they will be free to use their imagination to explore how to use and adapt this tool to their own needs.
Good luck using this tool!