國立臺灣大學醫學院解剖學暨細胞生物學研究所 碩士論文
Graduate Institute of Anatomy and Cell Biology College of Medicine
National Taiwan University Master Thesis
黏液蛋白醣化酵素 GALNT2 經由降低表皮生長因子接受 器的磷酸化抑制胃癌的惡性程度
Mucin glycosylating enzyme GALNT2 suppresses the malignancy of gastric adenocarcinoma by reducing EGFR
phosphorylation 胡椀婷 Wan-Ting Hu
指導教授:賴逸儒 博士 Advisor: I-Rue Lai, MD, Ph.D.
中華民國 105 年 7 月
July 2016
致謝
碩班兩年生活轉眼間就這樣過去了,從連在基本實驗技術方面都毫無基礎到
現在終於完成了碩士論文,這當中有太多太多人需要感謝。首先要特別感謝我的 指導教授賴逸儒老師,總是能在我們實驗遇到瓶頸時,給予我們建議,並提供新 的方向讓我們思考。在生活上則像爸爸一樣會關心我們的近況,並且時常帶著實 驗室的大家去放鬆紓解壓力。也謝謝實驗室的大家,心雲學姐、含貞學姐、爾言 學長、信元學長和助理奕宏,在實驗上總是不藏私且有耐心教導著原本甚麼都不 懂的我。做實驗之餘也還好有大家的陪伴,讓平日生活不會太過於沉悶與沉重。
也謝謝黃老師實驗室的大家,時常得忍受我一天到晚去借東西和問問題。再來也 要感謝我的同學們,碩一一起度過繁忙的課業,碩二也一起分享實驗好的成果抑 或者在實驗撞牆時有能傾訴或討論的對象。因為有你們讓我的研究生活更加多采 多姿。最後,要謝謝我的家人,總是支持我的任何決定,在背後做我最大的後盾,
讓我能毫無顧慮做我想做的事情,謝謝你們。
中文摘要
背景: 胃癌在癌症相關死亡率中高居第三位,雖然其發生率隨時間有逐漸下降
的趨勢,但病人的預後仍然不佳,平均五年存活率只有29%。目前研究觀察到異常 的醣化作用會影響癌細胞的惡性程度。在我們之前的研究發現乙烯半乳糖胺轉移 酶2(Glycosyltransferase N-acetylgalactosaminyltransferase 2, GALNT2)在胃癌病人中 表現量比正常胃腺組織少,其表現降低時會透過活化肝細胞生長因子受體(MET) 而增加胃癌的惡性程度。此外,在受體酪氨酸激酶磷酸化陣列試驗(RTK array)中 則觀察到降低GALNT2的表現量會增加表皮生長因子受體(Epidermal Growth Factor Receptor, EGFR)的活化,但對於GALNT2是否能透過調節EGFR的磷酸化而 影響胃癌的進展依然是未知.
目的: 探討GALNT2是否能透過修飾EGFR醣基構造及調節磷酸化程度進而影
響胃癌的惡性程度。
材料及方法: 以細胞株實驗分析,抑制GALNT2的表現後對於AGS的細胞存活
率(MTT試驗)、轉移 (transwell migration assay) 及侵襲行為(matrigel invasion assay) 的影響。利用Vicia villosa agglutinin (VVA) pull down assay觀察EGFR的醣化作用。
利用臨床胃癌檢體的免疫組織化學染色分析,pEGFR和GALNT2 表現與預後的相 關性。
結果: 抑制GALNT2會增加EGFR和Akt磷酸化但減少EGFR的醣化作用。此外
EGFR及Akt的抑制劑可以有效減少因抑制GALNT2而增加的轉移及侵襲能力,但 細胞存活率在控制組及抑制GALNT2組別間不管是否有加入EGFR抑制劑都無顯 著差異。臨床檢體中,44% (31/70)的病中人有表現pEGFR,且其與GALNT2表現 量呈現正相關,但和其餘臨床病理特徵與預後沒有太大相關性。
結論: 在研究中觀察到GALNT2可以透過修飾EGFR醣化作用及減少其磷酸化 和下游訊息傳遞而抑制胃癌細胞的惡性程度。
關鍵字: 乙烯半乳糖胺轉移酶、表皮生長因子受體、O-醣基化、胃癌.
Abstract
Background: Gastric cancer is the third leading cause of cancer-related deaths
worldwide. Despite a steady decline in gastric cancer incidence and mortality, the
overall 5-year survival rate of patients with gastric cancer is about 29%. Aberrant
glycosylation affects the tumorigenesis and progression of cancers. In our previous
study, we found that down-regulation of GALNT2 enhanced malignancy of gastric
cancer as a result of increasing MET phosphorylation and affected activation of
epidermal growth factor receptor (EGFR). Nevertheless, it remains unknown whether
GALNT2 could regulate the malignancy through modifying EGFR phosphorylation.
Aims: To investigate whether GALNT2 could modify the malignant characteristics in gastric cancer by affecting EGFR phosphorylation and glycosylation.
Materials and methods: Effects of GALNT2 knockdown on cell viability (MTT
assay), migration (transwell migration assay) and invasion (matrigel invasion assay) of
gastric cancer cell line (AGS) were analyzed. The Vicia villosa agglutinin (VVA) pull
down assay was conducted to detect O-glycosylation of EGFR. Immunohistochemistry
was performed to study the correlation of p-EGFR expression with GALNT2 and
prognosis.
Results: Knockdown of GALNT2 in AGS cells decreased the VVA binding to
EGFR, but increased phosphorylation of EGFR and Akt. Furthermore, knockdown of
GALNT2 enhanced the migration and invasion of AGS cells, which were reversed by
treated with EGFR inhibitor (gefitinib) or Akt inhibitor (MK2206). However, there was
no difference on cell viability between siC and siGALNT2-transfected groups, treated
with either DMSO or gefitinib. Clinically, p-EGFR was over- expressed in 44% (31/70)
of gastric cancer tissues. p-EGFR was positively correlated with GALNT2 but not
associated with clinical outcomes.
Conclusions: Our in vitro studies indicate that GALNT2 may suppress the
malignancy of gastric cancer by modifying glycosylation of EGFR and reducing
activation of EGFR-Akt pathway.
Keyword: Glycosyltransferase N-acetylgalactosaminyltransferase 2 (GALNT2), Epidermal growth factor receptor (EGFR), O-glycosylation, gastric adenocarcinoma
Table of contents
審定書………i
致謝... ii
中文摘要... iii
Abstract ... v
I. Introduction ... 1
1-1. Gastric cancer ... 1
1-2. Mucin-type glycosylation ... 2
Introduction ... 2
Role of glycosylation in cancers ... 2
1-3. Epidermal growth factor receptor (EGFR) ... 4
EGFR and cancers ... 4
II. Aims ... 6
III. Materials and methods ... 7
3-1. Cell line ... 7
3-2. Western blot analysis ... 7
3-3. Immunohistochemistry ... 10
3-4. IHC evaluation ... 12
3-5. Real-time reverse transcription PCR (RT-PCR) ... 12
3-6. SiRNA knockdown of GALNT2 expression ... 14
3-7. MTT assay ... 14
3-8. Transwell migration assay ... 15
3-9. Matrigel invasion assay ... 16
3-10. VVA lectin pull down assay ... 16
3-11. Statistic analyses ... 16
IV. Results ... 18
4-1. Knockdown of GALNT2 increased epidermal growth factor receptor (EGFR) phosphorylation and decreased EGFR glycosylation. ... 18
4-2. Knockdown of GALNT2 enhanced the malignant phenotypes of gastric cancer through increasing EGFR phosphorylation in-vitro. ... 19
4-3. Knockdown of GALNT2 enhanced the malignant phenotypes of gastric cancer through
increasing EGFR-Akt pathway in-vitro. ... 20
4.4 Correlation of p-EGFR with GALNT2 and clinico-pathological parameters. ... 21
V. Discussion ... 22
VI. Figures and table ... 27
Figure 1. Efficiency of GALNT2 knockdown. ... 27
Figure 2. Effect of GALNT2 knockdown on EGFR phosphorylation. ... 28
Figure 3. Effect of GALNT2 knockdown on EGFR glycosylation. ... 29
Figure 4. GALNT2 knockdown or gefitinib did not affect cell viability. ... 30
Figure 5. GALNT2 knockdown enhanced cell migration through increasing EGFR phosphorylation. ... 32
Figure 6. GALNT2 knockdown enhanced cell invasion through increasing EGFR phosphorylation. ... 34
Figure 7. Effect of EGFR inhibitor (gefitinib) on Akt and ERK1/2 phosphorylation and total form. ... 35
Figure 8. Inhibition of Akt phosphorylation decreased cell viability. ... 36
Figure 9. GALNT2 knockdown enhanced cell migration through increasing Akt
phosphorylation. ... 38
Figure 10. GALNT2 knockdown enhanced cell invasion through increasing Akt
phosphorylation. ... 40
Figure 11. Correlation between GALNT2 and p-EGFR expression. ... 41
Figure 12. Kaplan-Meier survival analysis of progression-free survival in gastric cancer patients with p-EGFR(+) or p-EGFR(-). ... 42
Table 1. Correlation between p-EGFR and clinico-pathological parameters. ... 43
VII. References ... 44
I. Introduction 1-1. Gastric cancer
Gastric cancer is the fourth most common cancer and the third leading cause of
cancer-related deaths worldwide, with an estimated 951,600 new gastric cancer cases
and 723,100 deaths occurred in 2012.[1,2]. Despite a steady decline in incidence and
mortality of gastric cancer have been observed in past decades, the prognosis in gastric
cancer remains poor, because high proportion of people are diagnosed at late stage. In
gastric cancer, poor prognosis is associated with late TNM stage. The overall
5-year relative survival rate of gastric cancer patients with stage IV in the United States
was only about 4%.
Treatments of gastric cancer are according to stage and patients’ general health. The
major treatment is surgery, but when patients can’t undergo surgery or recurrence
happens after surgery, it needs other treatments, including chemotherapy, radiotherapy
and target therapy.[3]
1-2. Mucin-type glycosylation
Introduction
Glycosylation is the most common post-translational modification of proteins. It
refers to the process that attaches glycans to proteins, lipids, or other organic
molecules. There are two major types of glycosylation: N-linked and O-linked
glycosylation. The most common type of O-glycosylation is mucin-type
O-glycosylation, which forms the GalNAc1-O-Serine/threonine linkage. This process is
initiated by a large family of polypeptide GalNAc transferases (GALNT), consisting of
at least 20 members in humans, namely GALNT1 to 20.[4]
Role of glycosylation in cancers
Glycobiology has become a focus of research in cancer biology.[5] Aberrant
glycosylation may be owing to under-/overexpression of glycosyltransferases or
mislocalization of glycosyltransferases. Glycans have been found to participate in
numerous fundamental biological processes involved in cancer, such as inflammation ,
immune surveillance, cell–cell adhesion, cell–matrix interaction, inter- and intracellular
signaling, and cellular metabolism. [6]
Common feature of tumors is the overexpression of truncated O-glycans, such as the
disaccharide Thomsen–Friedenreich antigen (T antigen) and the monosaccharide
GalNAc (also known as Tn) and their sialylated forms (ST and STn).[7]
Dysregulation of GALNTs has been found in many cancers and plays a critical role
in cancer development. For instance, GALNT3 expression significantly correlated with
shorter progression-free survival (PFS) intervals in epithelial ovarian cancer (EOC)
patients with advanced disease.[8] GALNT6 is upregulated in breast cancer and might
contribute to mammary carcinogenesis through aberrant glycosylation and
stabilization of MUC1[9] In addition, GalNT14 is overexpressed in colorectal
carcinoma and pancreatic cancer and is associated with altered sensitivity to
TRAIL-induced apoptosis through modulation of the O-glycosylation of death
receptors on these tumor cells. It has been reported that GALNT3, GALNT6 and
GALNT10 were biomarkers associated with lymph node metastasis[10], venous
invasion[11] and poor differentiation of gastric cancer[12] respectively. In vitro studies
have shown that knockdown of GALNT2 increases cell proliferation and invasion in
gastric cancer[13] and hepatocellular carcinoma.[14], but decreases migration and
invasion of oral squamous cell carcinoma.[15] In our previous study, we found that low
GALNT2 expression correlated with increased tumor depth, lymph node metastasis, and
TNM stage and shorter disease-free survival and downregulation of GALNT2 enhances
malignancy of gastric cancer through increasing MET phosphorylation. Understanding
the mechanisms and consequences of variations in glycosylation associated with
neoplastic disease will provide important insight into neoplastic progression
1-3. Epidermal growth factor receptor (EGFR)
The epidermal growth factor receptor (EGFR) is a 170 kDa receptor containing
approximately 20% of carbohydrate of its molecular mass and is heavily N-glycosylated.
EGFR is consisting of an extracellular ligand binding domain (domains I-IV), a
transmembrane region, an intracellular domain with tyrosine kinase activity, and a tail
containing tyrosine residues, required for downstream signaling. Ligand binding brings
two receptor monomers together and allows for the dimerization and subsequent
activation of the kinase domain. EGFR activation leads to receptor phosphorylation and
initiates diverse downstream signaling pathways including the RAS/RAF/MAP kinase
and PI3K/Akt/mTOR signaling networks, which play a vital role in several critical
cellular processes including proliferation, motility, and invasion.[16]
EGFR and cancers
Dysregulation of EGFR has been observed in variety of cancer, including breast
cancer, colorectal cancer and non-small cell lung carcinoma (NSCLC), etc. In NSCLC,
overexpression of EGFR or mutations in intracellular EGFR have been observed in
43-89% of cases.[17] In breast cancer, EGFR overexpression is associated with
large tumor size, poor differentiation, and poor clinical outcomes. Many therapeutic
agents targeting EGFR have been under clinical trial.[18-20] Studies observed that
EGFR-positive rate was 14-44% in gastric cancer. However, the correlation between
EGFR and clinic-pathological characteristics was controversial. EGFR-positive was
correlated with advanced TNM stage, lymph node metastasis, vascular invasion and
shorter progression-free-survival (PFS).[21-25], but Fuse et al. found there was no
correlation between EGFR expression and overall survival rate. [26] In vitro
experiments showed that EGFR activation and its downstream signaling PI3K-Akt
pathway were required in gastric cancer migration, and treated with EGFR inhibitor or
PI3K inhibitor could suppress the migration ability.[27] In addition, knockdown of
EGFR suppressed cell growth, invasion and induced cell apoptosis and cell cycle arrest
in gastric cancer through Akt pathway.[28]
Aside from studying expression of EGFR in cancer and its role in cancer progression,
many studies have focused on investigating correlation between
phosphorylated-EGFR(p-EGFR) and clinical outcomes, because EGFR is a receptor
tyrosine kinase, it becomes activated only when it’s phosphorylated. In current studies,
the prognostic significance of p-EGFR on clinical outcomes has been reported in many
cancers, such as breast cancer, NSCLC. [29-31] Zhang et al. reported that p-EGFR was
detected in 83.3% of gastric cancer and it correlated with T stage.[32] The prognostic
impact of p-EGFR remains unknown, so it needs further studies to confirm. These
findings would be beneficial for predicting prognosis or providing new target for
treatment.
II. Aims
In our previous study, the RTK array showed that GALNT2 knockdown increased
phosphorylation of EGFR in AGS cells. This study aims to investigate whether
GALNT2 could modify the malignant characteristics, including proliferation,
migration and invasion in gastric cancer cells by affecting EGFR phosphorylation and
glycosylation. In addition, the correlation of p-EGFR expression with GALNT2 and
clinical outcomes are investigated.
III. Materials and methods 3-1. Cell line
Human gastric cancer cell line AGS was kindly provided by Min-Chuan Huang
(National Taiwan University, Taiwan) in 2010. These cells were grown in 10-cm culture
plates and maintained in RPMI medium with 10% fetal bovine serum, 2% sodium
bicarbonate, 2 mM L-Glutamine, and 1% penicillin, 1% streptomycin, and 1%
amphotericin at 37°C with 5% CO2 in a 95% humidified atmosphere.
3-2. Western blot analysis
Preparation of cell lysates
Total cell lysates from cultured AGS cells were prepared as below. The culture plate
was washed with PBS to remove the residual medium, and the cells were lysed
with 10X RIPA buffer diluted with ddH2O (1:9). Then, cells were scraped from culture
plate and incubated on ice for 15 minutes. Next, extracts were centrifuged at 14,000 rpm
for 10 minutes at 4℃. Finally, supernatant was removed to new eppendorf for use.
Bradford assay
The Bradford assay was used to determine the concentration of proteins. 1µl of
standard protein (BSA) of known concentration (3, 10, 15, 20µg/ml) and tested proteins
were mixed with 199µl 5X Bradford diluted with ddH2O (1:4). Samples were incubated
at room temperature for 5 minutes and the absorbance was measured at 630nm. The
concentration of each sample was calculated by comparing the absorbance with the
calibration curve.
Sample preparation
Protein samples were mixed with 5X sample buffer (1:4) (5% SDS, 20% glycerol,
0.004% bromphenol blue, 125mM Tris-HCl, 10% β-mercaptoethanol, pH 8.0) and
boiled at 100℃ for 5 minutes.
Electrophoresis and electro-transfer
Equal amount (30µg) of extracted protein was loaded into each well and ran at 120V
for about 2 hours. The transfer sandwich was assembled as follows: sponge, filter
papers, gel, PVDF membrane (Millipore, 0.2µm), filter papers. Then the transfer
sandwich was relocated to the transfer apparatus filled with transfer buffer (25Mm Tris,
192mM glycine, 20% methanol.). Protein samples were transferred to PVDF membrane
at 90V for 90 minutes.
Blocking, antibody incubation and detection
The membrane was incubated with 5% BSA in TBST (50mM Tris, 150mM NaCl,
0.05% Tween 20, pH 7.5) at room temperature for 1 hours followed by incubated with
primary antibody against GALNT2 (1:1000, Sigma), EGFR (1:1000, Cell signaling
technology), phospho-EGFR (Try1068) (1:1000, Cell signaling technology), Akt
(1:1000, abcam), phospho-Akt (1:1000, abcam), ERK (1:1000, Cell signaling
technology), phospho-ERK (1:1000, abcam) and GAPDH (1:1000,Novus Biologicals)
diluted in 5%BSA/TBST overnight at 4℃. Next day, the membrane was washed 3 times
with TBST, and then incubated with mouse IgG antibody (HRP) (1:1000, GeneTex) and
rabbit IgG antibody (HRP) (1:1000, GeneTex) at RT for 1 hour. The membrane was
washed 3 times with TBST and developed with Luminata Crescendo Western HRP
Substrate (Millipore).
3-3. Immunohistochemistry
Paraffin sectioning
Paraffin-embedded tissues were sectioned at a thickness of 5 µm. Tissue sections
were stretched in 36.5°C water bath and mounted on slides coated with
3-Aminipropyltriethoxysilane (Sigma). The slides were then placed to dry at 40°C
De-paraffinization
The slides were incubated at 60°C for 30 min. Tissues were deparaffinized in 2
changes of xylene, 10 minutes each, and then rehydrated in 2 changes of 100% ethanol
for 3 minutes each, 90%, 80% and 70% ethanol for 3 minutes respectively. After the
slides were immersed in the above sequence, they were washed twice with PBS for 5
minutes each.
Antigen retrieval
The slides were incubated in sodium citrate buffer (10mM Sodium Citrate, 0.05%
Tween 20, pH 6.0) and heated using Microwave Vacuum Histoprocessor RHS-1
(Milestone) with program GPR100C (20 slides – 250mL). Then the slides were cooling
by running tap water for 20 minutes.
Staining
After antigen retrieval, the slides were washed 3 times in TBS solution then
incubated with 0.3% H2O2 for 10 minutes to block endogenous peroxidase activity
followed by PBS wash for 3 times. Then applying 5% (w/v) BSA/TBS to block
nonspecific binding for 1 hour. The sections were then incubated with anti-GALNT2
polyclonal antibody (1:200, Sigma) and phospho-EGF Receptor (Tyr1068) (1H12)
Mouse mAb (1:250, Cell signaling technology) diluted with 5% BSA/TBS overnight at
4°C. Signals were detected employing UltraVision Quanto Detection System HRP
(Thermo) and visualized by DAB quanto (Thermo). All sections were counterstained
with hematoxylin for 30 seconds and rinsed in running tap water for 2 minutes.
Dehydration and mounting
The tissue slides were dehydrated through 70%, 80% ,90% and 100% ethanol for
30 seconds respectively, and then were immersed in 2 changes of xylene, 30 seconds
each. After the slides were dehydrated in the above sequence, they were mounted with
Micromount Mounting Medium (Leica).
3-4. IHC evaluation
Two pathologists independently quantified staining. Every tumor was given a score
according to the intensity of staining (no staining = 0, weak staining =1, moderate
staining = 2, strong staining = 3) and percentage of stained cells (0% = 0, 1–10% = 1,
11–50% = 2, 50-80% = 3, >80%=4). The score gives a range of 0–12 as the product of
multiplication between stained cells percentage score (0–4) and staining intensity score
(0–3). Scoring was performed for four random distinct fields per slide, and then 4 scores
were averaged. IHC score between 4-12 was defined as phospho-EGFR positive and
score between 0-4 was defined as phospho-EGFR negative .
3-5. Real-time reverse transcription PCR (RT-PCR)
RNA extraction
The total RNA was isolated using Trizol reagent (Invitrogen, Life Technologies).
The isolation procedure was as below. The culture plates were washed three times with
PBS and cells were extracted with 1ml Trizol Reagent. Then, cells were scraped from
culture plates and incubated at room temperature for 15 minutes. Next, the homogenized
samples were mixed with 0.2ml of chloroform and were incubated at RT for 3 minutes.
Then the homogenized samples were centrifuged at 12,000g for 15 minutes at 4°C and
the aqueous phase was placed into a new eppendorf. The RNA was precipitated by
adding 0.5ml isopropanol to the aqueous phase and the mixtures were incubated at RT
for 10 min followed by centrifugation at 12,000g for 10 mins at 4°C. After the
supernatant was removed, the RNA pellet was wash twice with 1ml of 75% ethanol and
air dried. Finally, RNA was resuspended in RNase-free water.
Reverse transcription
The cDNA was synthesized with the High Capacity cDNA Reverse Transcription
Kits (Applied bio-system). 2µg RNA was mixed with RT master mix (2µl of 10X RT
Buffer, 0.8µl of 25X dNTP Mix (100mM), 2µl of 10X RT Random Primers, 1µl of
MultiScribe™ Reverse Transcriptase, 1µl of RNase Inhibitor, 3.2µl of Nuclease-free H2O.) and
then DEPC water was added to bring the total volume to 20µl.
The thermal cycler condition was programmed as followed: 25℃/10 min, 37℃/120
min, 85℃/5 min, and 4℃/∞, and then reverse transcription was performed.
Real-time PCR
The cDNA was subjected to real-time PCR using quantitative PCR System
Mx3000P (Stratagene). Primers for GALNT2 were 5-AAGGAGAAGTCGGTGA
AGCA-3 and 5-TTGAGCGTGAACTTCCACTG-3. Primers for GAPDH were
5-ACAGTCAGCCGCATCTTCTT-3 and 5-GACAAGCTTCCCGTTCTCAG-3.
Relative quantity of mRNA expression normalized to GAPDH was analyzed with
MxPro Software (Stratagene).
3-6. SiRNA knockdown of GALNT2 expression
In transient knockdown experiments, a siRNA oligonucleotides against GALNT2
(5-CAGCAGGGAACUAACUGCCUCGACA-3 and 5-UGUCGAGGCAGUUAGUU
CCCUGCUG)) and a non-targeting siRNA control were synthesized by Invitrogen. The
AGS cells (2 ×10⁵ cells ) were transfected with siRNA using Lipofectamine
RNAiMAX Reagent (Invitrogen) with the final concentration of 10nM for 24hours. The
step-by-step procedure is listed as below. Serum-free RPMI-1640 (500µl) containing
siRNA was mixed with 500 µl serum-free RPMI-1640 containing 10 µl Lipofectamine
RNAiMAX Reagent. The resultant mixture was kept at room temperature for 20 min,
and then was added into the plates. The plates were incubated at 37°C for 24 h.
3-7. MTT assay
The cell viability was assessed by measuring the ability of cells to reduce
3-(4,5-dimethylthiazol-2-yl)- 2,5-diphenyltetrazolium bromide (MTT) to the dark blue
formazan product. AGS cells were seeded at a density of 2 × 10³ cells/200µl per well.
For assessing the effect of gefitinib (ApexBio Technology), cells were incubated with
10% FBS containing DMSO (0.1%, Sigma) or gefitinib(1µM). The effect of MK2206
(AdooQ BioScience) was assessed by adding DMSO (0.1%, Sigma) or MK2206(1µM)
to the 96-wells. Then MTT solution was added to each well and incubated at 37°C for 3
hours. The solution was carefully removed followed by addition of DMSO. Absorbance
of sample was measured at 570 nm at day1, 2, 3, 4 and 5. Results were expressed as
percentage of absorbance compared to the control cells.
3-8. Transwell migration assay
The transfected cells (3 ×10⁴) were re-suspended in 200µl of serum-free RPMI containing gefitinib and EGF(50ng/ml, Sigma) or MK2206 and added to the upper
chamber with an 8-µm pore size membrane (Corning) for assessing effect of gefitinib
and MK2206 on cell migration. 700µl of RMPI with 10%FBS was added to lower
chamber as chemo-attractant. After 24 hours, the non-migrating cells on the upper
surface of the membrane were removed by scrubbing with a cotton-tipped swab, and the
invaded cells on the lower surface of the membrane were fixed with 100% methanol and
then stained with 0.5% crystal violet (Sigma). The number of migrated cells per field
was counted under a phase contrast microscope. Four random fields were examined and
analyzed at 100x magnification.
3-9. Matrigel invasion assay
Procedures were the same as trans-well migration assay, except for the upper chamber
with an 8-µm pore size membrane (Corning) being coated with corning Matrigel Matrix
diluted with serum-free RPMI (1:4) at 37°C overnight the day before experiment.
3-10. VVA lectin pull down assay
Cell lysates (0.5 mg) were incubated with 30µl Vicia Villosa Lectin (VVA)-conjugated
agarose beads (Vector Laboratories) at 4 °C overnight. The lectin/glycoprotein
complexes were collected by centrifugation(10,000 rpm, 1min) and washed twice with
PBS. Glycoproteins were released from the complexes by boiled in 5µl of 5x sample
buffer for 5 minutes. The precipitated proteins were resolved by SDS– PAGE, then
immunoblotted to detect EGFR. EGFR of total lysates were served as internal control.
3-11. Statistic analyses
Data were represented as the mean ± SD. Statistical analyses were performed using Prism6. The Student t test and 2-way ANOVA followed by a Bonferroni post hoc test
were used to compare differences between experimental groups. Chi-square was used to analyze correlation between pairs of categorical variables. The Kaplan-Meier log-rank test was performed to estimate probabilities of progression-free survival. All statistical tests were 2-sided, and P < 0.05 was considered statistically significant.
IV. Results
4-1. Knockdown of GALNT2 increased epidermal growth factor receptor (EGFR) phosphorylation and decreased EGFR glycosylation.
To investigate the effect of GALNT2-knockdown on EGFR phosphorylation, AGS
cells were transfected with siGALNT2 or non-targeting siRNA control (SiC) for 24
hours, and then were starved for 6 hours followed by EGF stimulation for 10 minutes.
The expression of p-EGFR in the treated cells was detected by Western blot analysis.
Efficiency of GALNT2 knockdown was confirmed by western blot analysis and q-PCR.
(Fig. 1A-C). Without EGF, there was no difference between SiC and
siGALNT2-transfected group (p=0.2073). In the presence of EGF, p-EGFR was
significantly increased in siGALNT2-transfected compared to siC group. (p=0.0257)
(Fig. 2A & B)
Since GALNT2 is a mucin glycosylating enzyme, we hypothesized that it could
modify O-glycosylation of EGFR. Thus, VVA lectin pull down was used to detect Tn
antigen (GalNAc-o-Ser/Thr) expression of siC and siGALNT2 group. As shown in Fig.
2, knockdown of GALNT2 reduced VVA binding to EGFR (p=0.0093). Here, EGFR of
total lysate served as internal control.
4-2. Knockdown of GALNT2 enhanced the malignant phenotypes of gastric cancer through increasing EGFR phosphorylation in-vitro.
Knockdown of GALNT2 could enhance cell viability, migration and invasion
abilities in previous studies.[33] Here, we reported that knockdown of GALNT2
increased EGF-induced activation of EGFR. As a result, we investigated whether
GALNT2 knockdown enhanced malignant phenotypes, including cell viability,
migration and invasion by affecting EGFR phosphorylation. SiC and
siGALNT2-transfected groups were starved for 6 hours and then treated with 1µΜ
gefitinib or DMSO.
As shown in Fig. 4, there were no differences during day1-5 on cell viability
between SiC and siGALNT2-transfected group, either treated with DMSO or gefitinib
group. The number of migrated cells of siGALNT2-transfected group were 2.8 fold
higher than that of siC group, the addition of gefitinib markedly suppressed the
migration of siGALNT2-transfected cells (Fig. 5). Furthermore, the invasion abilities of
siGALNT2-transfected cells which was markedly enhanced by knockdown of GALNT2
were suppressed when treated with gefitinib. (Fig. 6)
4-3. Knockdown of GALNT2 enhanced the malignant phenotypes of gastric cancer through increasing EGFR-Akt pathway in-vitro.
Upon phosphorylation of EGFR, diverse downstream signaling pathways initiated,
which play a vital role in several critical cellular processes including proliferation,
motility, and invasion. Previous studies showed that EGFR-ERK and EGFR-Akt
signaling pathways were associated with migration and invasion in gastric cancer. To
explore signalings involved in gastric cancer progression mediated by GALNT2-EGFR
pathway, two target proteins, Akt and ERK, were selected to evaluate EGFR
phosphorylation on their activation. As shown in Fig. 7A&B, gefitinib treatment
significantly decreased phospho-Akt but not affected expression of total Akt. On the
other hands, total ERK and phospho-ERK were unchanged upon gefitinib treatment.
(Fig. 7A&C)
Next, we further verified the role of Akt activation in malignant phenotypes in
gastric cancer. SiC and siGALNT2-transfected groups were treated with 1µΜ MK2206
to inhibit Akt activation or DMSO as control. As shown in Fig. 8, there were no
differences during day1-4 on cell viability between SiC and siGALNT2-transfected
group, but cell viability was lower in groups treated with 1µΜ MK2206 at day 4.
Besides, the number of migrated and invaded cells in siGALNT2+MK2206 group
significantly decreased compared to siGALNT2 +DMSO group. (Fig.9&10)
4.4 Correlation of p-EGFR with GALNT2 and clinico-pathological parameters.
In-vitro experiments demonstrated that GALNT2 knockdown enhanced EGFR
phosphorylation and was associated with malignant phenotypes in gastric cancer.
However, it is still unknown about the correlation between GALNT2and p-EGFR in
clinical samples. In this study, GALNT2 and p-EGFR expression were evaluated by
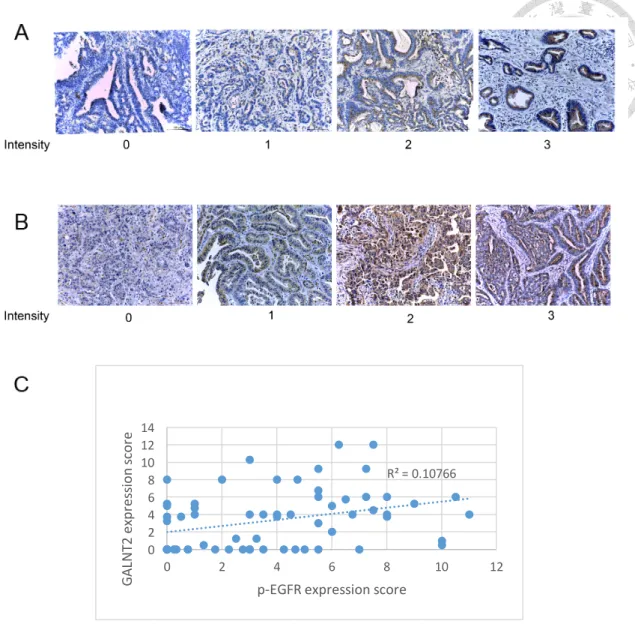
using immunohistochemistry staining (Fig. 11A&B). Result showed the correlation
coefficients (r) between them was 0.3281, p=0.0076, which indicated higher expression
of GALNT2 would have higher expression of p-EGFR and vice versa. (Fig. 11C)
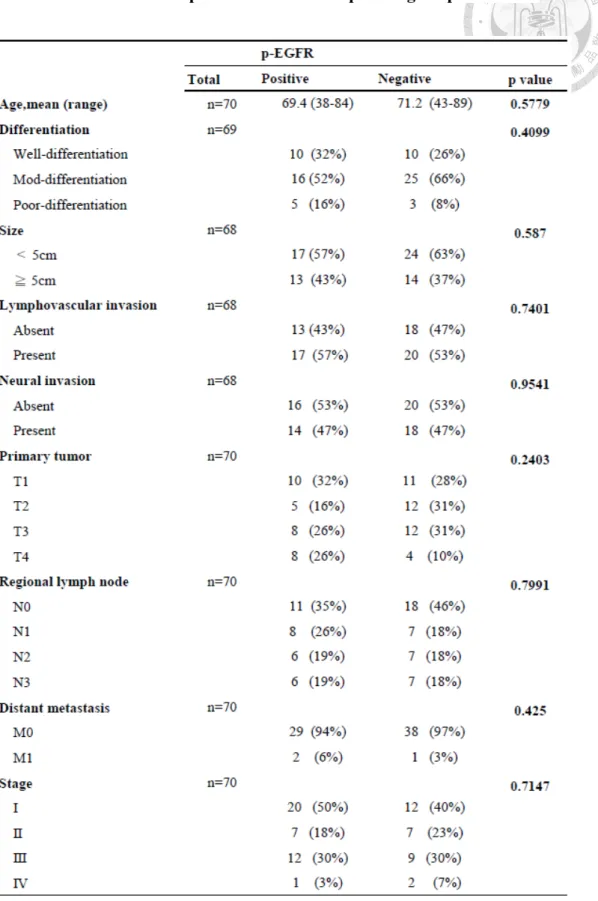
Furthermore, we evaluated the correlation of p-EGFR with clinico-pathological
parameters and progression-free survival (PFS). Of the 70 patients, 31 (44%) were
p-EGFR positive, but the expression of p-EGFR was not significantly correlated with
age, cell differentiation, size, lympho-vascular invasion, TNM stage. (Table. 1) In
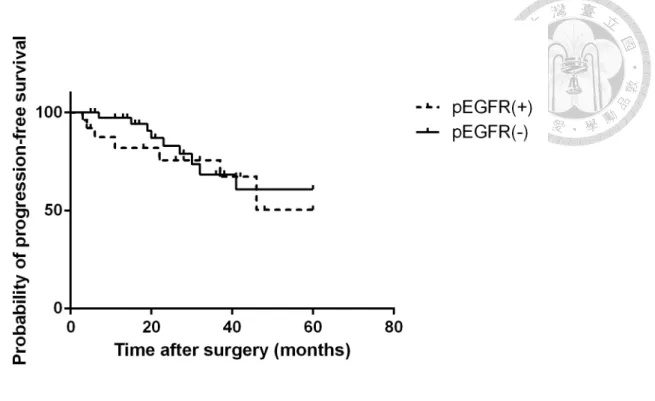
addition, there were no significant differences in progression-free survival among
patients with p-EGFR positive/negative. The 5-year PFS was 50.4% for p-EGFR
positive and 60.3% for p-EGFR negative group. (p=0.2849) (Fig. 12)
V. Discussion
Aberrant glycosylation frequently occurs in cancers and plays a critical role in
cancer progression, angiogenesis and metastasis. Common feature of tumors is the
overexpression of truncated O-glycans, such as the disaccharide Thomsen–Friedenreich
antigen (T antigen), the monosaccharide GalNAc (also known as Tn) and their
sialylated forms (ST and STn). Specifically, STn expression modulates malignant
phenotypes in gastric and breast cancer cells, such as increased migration and
invasion.[6,7,34] Altered expression of glycans can be attributed to abnormal
expression of glycosyltransferases. In previous studies, GALNT2 altered the expression
of Tn antigen on EGFR in oral squamous cell carcinoma and hepatocellular carcinoma
and Tn antigen on MET in gastric cancer. [14,15] GALNT10 modified O-glycosylation
of EGFR and subsequent phosphorylation of Akt in HBV-associated HCC.[35]
Besides, GALNT2 could modify O-glycosylation and activation of IGF-1R, and then
affect the malignant phenotypes of neuroblastoma cells.[36] However, no studies
investigate about the role of GALNT2 in modifying O-glycosylation of EGFR in gastric
cancer. Here, we demonstrated that knockdown of GALNT2 decreased the Tn antigen
on EGFR in gastric cancer. Since alterations in glycosylation can significantly impact
overall glycoprotein charge and conformation and therefore readily alter its biological
activity. For example, aberrant glycosylation of receptor tyrosine kinases (RTKs) could
modulate their activities and signalings. [7] Receptor tyrosine kinase (RTK) -targeted
therapeutic agents are constantly being developed and have been shown to be effective in
various clinical trials. Trastuzumab, an inhibitor of ERBB2, has been approved for the
treatment of gastric cancer.[37] So investigating the roles of other RTKs in gastric cancer
will provide potential targets for the future treatments. In our previous study, we revealed
that GALNT2 knockdown increased EGFR phosphorylation. Constitutive activation of
the EGFR, which can be resulted from ligand depend or ligand independent pathway is
common in cancers [38] Here, we showed that knockdown of GALNT2 enhanced EGFR
phosphorylation in the presence of EGF. On the other hand, without EGF, GALNT2
didn’t affect EGFR phosphorylation. This may indicate EGFR activation modulated by
GALNT2 may dependent on the presence of ligand. Previous researches showed
glycosylation of EGFR might affect their bind affinity to EGF [39,40]. The mechanism
of how GALNT2 affects EGFR phosphorylation needs further study.
Recent studies suggested that GALNT2 regulated the malignant phenotypes by
modifying EGFR glycosylation and phosphorylation in oral squamous carcinoma and
hepatocellular carcinoma.[14,15] This study demonstrated the migration and invasion
abilities of AGS cells enhanced by GALNT2 would be suppressed by inhibiting EGFR
phosphorylation. Subsequently, inhibition of EGFR phosphorylation decreased
expression of phospho-Akt. Previous studies revealed that EGFR promoted gastric
cancer migration and invasion via Akt-activation.[27,28] In this study, cell viability,
migration and invasion abilities of AGS cells were significantly suppressed by inhibiting
Akt phosphorylation. These findings reveal that EGFR-Akt activation plays an important
role in gastric cancer progression.
In present study, cell viability during day1-5 was not affected by GALNT2 and
EGFR activation but Akt activation. In contrast to our previous study, knockdown of
GALNT2 enhanced cell viability.[33] This may be because this difference was
significant at day 6 in previous study, but we only assessed cell viability for 5 days.
Current studies about the effect of gefitinib on cell growth inhibition are controversial.
Gefitinib inhibited proliferation in prostate cancer and lung cancer.[41] However, it was
ineffective against most EGFR wild-type non-small cell lung cancer, but combined
EGFR siRNA or Akt inhibitior showed synergistic growth inhibition. [42,43]
However, there is no research about correlation of GALNT2 and phospho-EGFR in
clinical samples. This is the first study to investigate this relationship, but result showed
p-EGFR positively correlated with GALNT2, which was opposite to in vitro experiments.
The possible reasons may be as followed: first, the limitation of IHC analysis of
detection of two proteins simultaneously, so two sections were used to detect expression
of GALNT2 and phospho-EGFR respectively, which might result in scoring at different
cells. Although, we minimize this limitation by sectioning serially, but the final slide for
evaluated might not from the serial section. Immunofluorescence may serve as method to
solving this problem by double labeling of different proteins in the same slide.[44,45]
Second, downregulation of GALNT2 enhances the malignancy in gastric cancer may
attribute to multiple pathways, not all the patients undergo increasing EGFR
phosphorylation, so it needs further investigation of subgroup analysis, and it might
demonstrate clinical significance.
EGFR becomes activated upon phosphorylated, so increasing numbers of studies on
correlation of p-EGFR with clinical outcomes. Patients with p-EGFR positive exhibited
poorer overall survival.[30,31], but Nieto et al. showed p-EGFR didn’t serve as a
prognostic marker for overall survival.[29] The prognostic role of p-EGFR in gastric
cancer remains unknown. In present study revealed there were no difference in
clinico-pathalogical parameters, such as tumor size, cell differentiation, TNM stage and
progression-free survival between p-EGFR positive and negative. The plausible
explanations for controversial findings are as followed. First, scoring criteria and
threshold for positive and negative applied in each papers are not equal. Second, there
are many phosphorylation sites of EGFR, such as pY845. pY1068 and pY1173 etc., and
initiating distinct downstream signaling pathways. Recent studies detected not the same
site, and it might result in different outcomes. Third, gefitinib inhibit overall
phosphorylation of EGFR, not site specific, so other tyrosine sites may play a more
critical role in enhancing malignancy in gastric cancer. In addition, distinct molecular
drivers and tumor biology, and thus different treatment targets and predictive biomarkers
are implicated in each subtype of gastric cancer, such as intestinal versus diffuse type.
For example, EGFR, HER2 and MET overexpression are more prevalent in intestinal
type, but loss of E-cadherin and FGFR overexpression are more common in diffuse
type.[46,47] In this study, only intestinal type samples were collected for analyzing.
Thus, we will collect diffuse type samples to investigate if p-EGFR serves as a
prognostic marker in this subtype.
In conclusion, our findings of GALNT2 regulating malignancy by modifying
O-glycosylation and phosphorylation of EGFR brings new insights into new therapeutic
strategies. However, the prognostic role of pEGFR needs further investigation.
VI. Figures and table
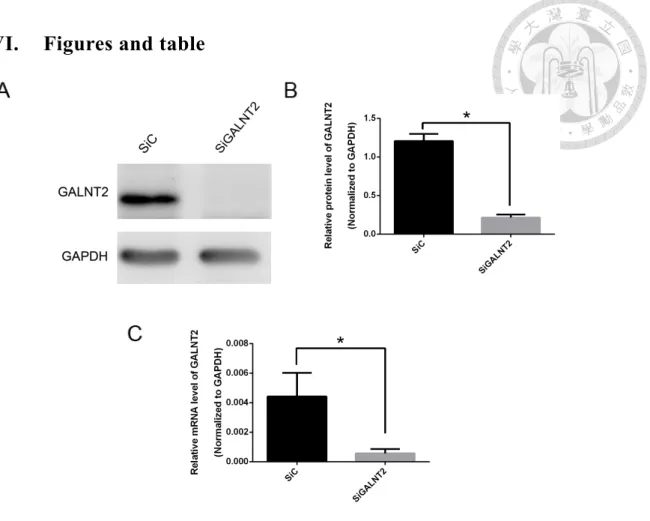
Figure 1. Efficiency of GALNT2 knockdown. (A) After transfected with 10nM
non-targeting siRNA control (siC) or GALNT2 siRNA (siGALNT2) for 24 hours, cell
lysates were collected and the expression of GALNT2 was confirmed by Western blot
analysis. GALNT2 was significantly lower in siGALNT2 group when compared with
siC group. (B) The relative protein level of GALNT2 was quantified and normalized to
GAPDH. (C) The relative mRNA level of GALNT2 obtained from qPCR was
quantified and normalized to GAPDH. Results are represented as mean ± S.D. from
three independent experiments. *P < 0.05.
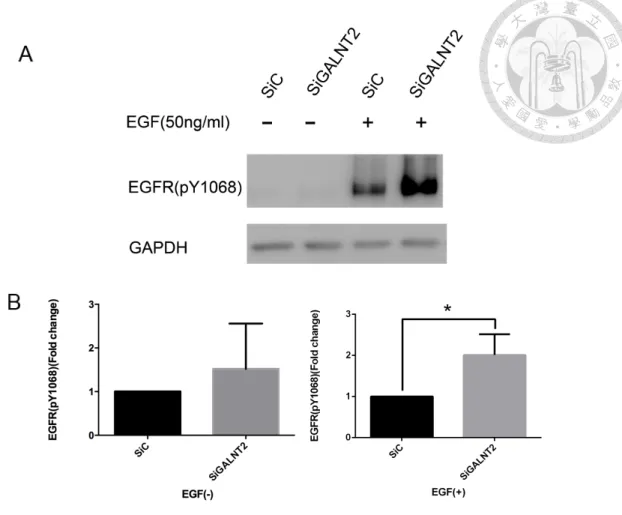
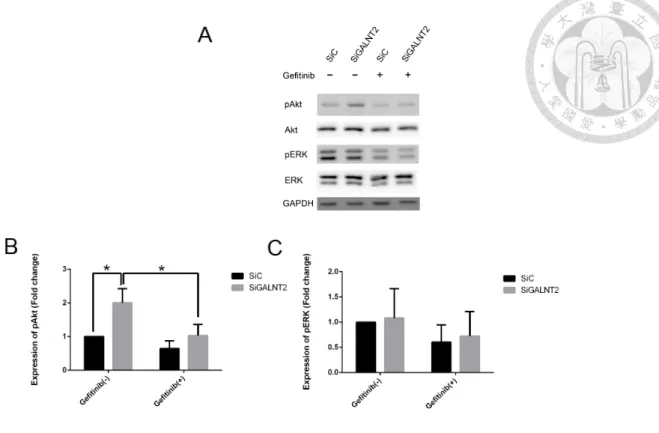
Figure 2. Effect of GALNT2 knockdown on EGFR phosphorylation. (A) After
transfection for 24 hours, cells were starved for 6 hours followed by stimulated with
DMSO or EGF (50ng/ml) for 10 min and then cell lysates were collected for Western
blot analysis. Without EGF, there was no difference between groups. However, in the
presence of EGF, phospho-EGFR significantly increased compared with siC group. (B)
The expression of phospho-EGFR was quantified and normalized to GAPDH. Results
are represented as mean ± S.D. from three independent experiments. *P < 0.05.
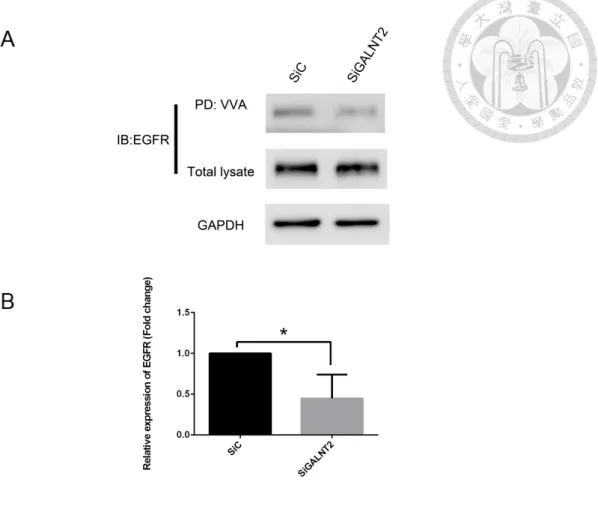
Figure 3. Effect of GALNT2 knockdown on EGFR glycosylation. (A)After
24h-transfection, lysates were pulled down by Vicia Villosa Lectin (VVA)-conjugated
agarose beads. Total lysates and pulled-down lysates were immunoblotted (IB) with
anti-EGFR antibody. (B) VVA-binding EGFR was quantified and normalized to total
EGFR. GALNT2 knockdown decreased VVA-binding to EGFR. This result indicates
that GALNT2 modifies O-glycosylation of EGFR. The results are represented as mean
± S.D. from three independent experiments. *, P < 0.05.
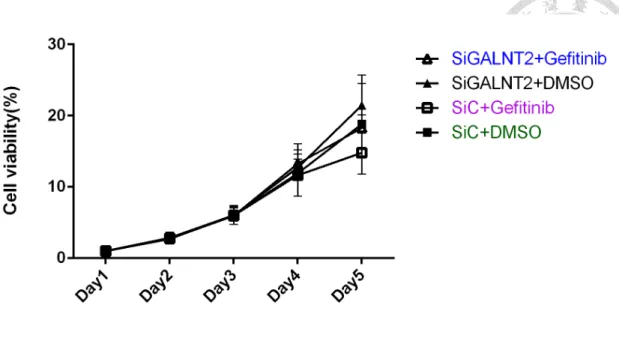
Figure 4. GALNT2 knockdown or gefitinib did not affect cell viability. After
24h-transfection, cells were incubated with 200µl RPMI medium+ 10% FBS treated
with either DMSO or 1µM gefitinib. Absorbance of sample was measured at day1, 2, 3,
4 and 5. There were no differences during day1-5 between siGALNT2 and siC group
treated with DMSO or gefitinib. The results are represented as mean ± S.D. from three
independent experiments. *, P < 0.05.
Figure 5. GALNT2 knockdown enhanced cell migration through increasing
EGFR phosphorylation. (A) After 24h-transfection, cells (3 ×10⁴) were re-suspended
in 200µl of serum-free RPMI containing EGF(50ng/ml) and treated with/ without 1µΜ
gefitinib. The migrated cells were counted after 24h. (A) GALNT2-knockdown
increased the number of migrated cells compared with siC group, but the addition of
gefitinib would abolish this phenomenon. (B) The number of migrated cells was
calculated at 4 random filelds per experiment. (×100) and expressed as fold change of siC without gefitinib treatment. Results are represented as mean ± S.D. from three independent experiments. *P < 0.05.
Figure 6. GALNT2 knockdown enhanced cell invasion through increasing
EGFR phosphorylation.(A) After 24h-transfection, cells (3 ×10⁴) were re-suspended in 200µl RPMI medium+ 10% FBS of serum-free RPMI containing EGF(50ng/ml) and
treated with/ without 1µΜ gefitinib. The invaded cells were counted after 24h. (A)
GALNT2-knockdown increased the number of invaded cells compared with siC group,
but the addition of gefitinib would abolish this phenomenon. (B) The number of
invaded cells was calculated at 4 random filelds per experiment. (×100) and expressed as fold change of siC without gefitinib treatment. Results are represented as mean ± S.D.
from three independent experiments. *P < 0.05.
Figure 7. Effect of EGFR inhibitor (gefitinib) on Akt and ERK1/2
phosphorylation and total form. (A) After 24h-transfection, cells were starved for 6h
and then treated with 1µM gefitinib followed by 10-min stimulation of EGF.
Subsequently, cell lysates were collected for Western blot analysis. Expression of
phospho-Akt significantly increased in the siGALNT2 group compared to the siC goup,
and this phenomenon would be reversed by the addition of gefitinib. However, total
ERK, Akt and phospho-ERK showed no difference between siC and siGALNT2 treated
with/without gefitinib. (B) Expression of phospho-Akt (left panel) and phospho-ERK
(right panel) were quantified and normalized to GAPDH. Results are represented as
mean ± S.D. from three independent experiments. *P < 0.05.
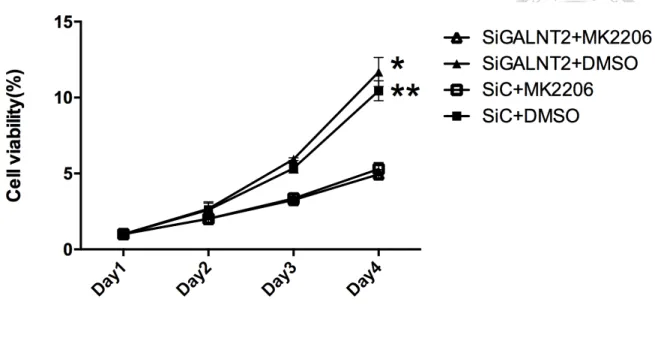
Figure 8. Inhibition of Akt phosphorylation decreased cell viability. After
24h-transfection, cells were incubated with 200µl RPMI medium+ 10% FBS treated
with either DMSO or 1µM MK2206. Absorbance of sample was measured at day1, 2, 3
and 4. There were no differences between siGALNT2 and siC group. However, cell
viability was significantly lower in groups treated with MK2206 than groups treated
with DMSO. Results are represented as mean ± S.D. from three independent
experiments. *P < 0.05, siG2+DMSO compared to siG2+MK2206; **P < 0.05,
siC+DMSO compared to siC+MK2206
Figure 9. GALNT2 knockdown enhanced cell migration through increasing Akt
phosphorylation. (A) After 24h-transfection, cells (3 ×10⁴) were re-suspended in
200µl of serum-free RPMI containing with/ without 1µΜ MK2206. The migrated cells
were counted after 24h. (A) GALNT2-knockdown increased the number of migrated
cells compared with siC group, but the addition of MK2206 would abolish this
phenomenon. (B) The number of migrated cells was calculated at 4 random filelds per
experiment. (×100) and expressed as fold change of siC without MK2206 treatment.
Results are represented as mean ± S.D. from three independent experiments. *P < 0.05.
Figure 10. GALNT2 knockdown enhanced cell invasion through increasing Akt
phosphorylation. (A) After 24h-transfection, cells (3 ×10⁴) were re-suspended in
200µl of serum-free RPMI containing with/ without 1µΜ MK2206. The migrated cells
were counted after 24h. (A) GALNT2-knockdown increased the number of invaded
cells compared with siC group, but the addition of MK2206 would abolish this
phenomenon. (B) The number of invaded cells was calculated at 4 random filelds per
experiment. (×100) and expressed as fold change of siC without MK2206 treatment.
Results are represented as mean ± S.D. from three independent experiments. *P < 0.05.
Figure 11. Correlation between GALNT2 and p-EGFR expression.
(A) Representative IHC staining of GALNT2 (B) Representative IHC staining of
p-EGFR. ; No staining = 0, weak staining =1, moderate staining = 2, strong staining = 3
(C) The expression of GALNT2/p-EGFR equals IHC intensity multiplies staining
percentage. p-EGFR was positively correlated with GALNT2. The Pearson correlation
coefficients (r) was 0.3281, p=0.0076
R² = 0.10766
0 2 4 6 8 10 12 14
0 2 4 6 8 10 12
GALNT2 expression score
p-EGFR expression score
Figure 12. Kaplan-Meier survival analysis of progression-free survival in gastric cancer patients with p-EGFR(+) or p-EGFR(-). Of the 65 patients, 26
(40%) were p-EGFR positive and 39 (60%) were p-EGFR negative. The 5-year PFS
was 50.4% for p-EGFR positive and 60.3% for p-EGFR negative group, and there was
no difference between two groups. (p=0.2849)
Table 1. Correlation between p-EGFR and clinico-pathological parameters.
VII. References
1. Torre, L. A., Bray, F., Siegel, R. L., Ferlay, J., Lortet-Tieulent, J., & Jemal, A. (2015).
Global cancer statistics, 2012. CA Cancer J Clin, 65(2), 87-108.
doi:10.3322/caac.21262
2. Ang, T. L., & Fock, K. M. (2014). Clinical epidemiology of gastric cancer.
Singapore Medical Journal, 55(12), 621-628. doi:10.11622/smedj.2014174 3. Waddell, T., Verheij, M., Allum, W., Cunningham, D., Cervantes, A., Arnold,
D., . . . Oncology. (2013). Gastric cancer: ESMO-ESSO-ESTRO Clinical Practice Guidelines for diagnosis, treatment and follow-up. Ann Oncol, 24 Suppl 6, vi57-63. doi:10.1093/annonc/mdt344
4. Bennett, E. P., Mandel, U., Clausen, H., Gerken, T. A., Fritz, T. A., & Tabak, L. A.
(2012). Control of mucin-type O-glycosylation: a classification of the polypeptide GalNAc-transferase gene family. Glycobiology, 22(6), 736-756.
doi:10.1093/glycob/cwr182
5. Pinho, S. S., Carvalho, S., Marcos-Pinto, R., Magalhaes, A., Oliveira, C., Gu, J., . . . Reis, C. A. (2013). Gastric cancer: adding glycosylation to the equation. Trends Mol Med, 19(11), 664-676. doi:10.1016/j.molmed.2013.07.003
6. Pinho, S. S., & Reis, C. A. (2015). Glycosylation in cancer: mechanisms and clinical implications. Nat Rev Cancer, 15(9), 540-555. doi:10.1038/nrc3982 7. Stowell, S. R., Ju, T., & Cummings, R. D. (2015). Protein glycosylation in cancer.
Annu Rev Pathol, 10, 473-510. doi:10.1146/annurev-pathol-012414-040438 8. Wang, Z. Q., Bachvarova, M., Morin, C., Plante, M., Gregoire, J., Renaud, M.
C., . . . Bachvarov, D. (2014). Role of the polypeptide
N-acetylgalactosaminyltransferase 3 in ovarian cancer progression possible implications in abnormal mucin O-glycosylation. Oncotarget, 5, 544–560.
9. Park, J. H., Nishidate, T., Kijima, K., Ohashi, T., Takegawa, K., Fujikane, T., . . . Katagiri, T. (2010). Critical roles of mucin 1 glycosylation by transactivated polypeptide N-acetylgalactosaminyltransferase 6 in mammary carcinogenesis.
Cancer Res, 70(7), 2759-2769. doi:10.1158/0008-5472.CAN-09-3911 10. Ishikawa, M., Kitayama, J., Nariko, H., Kohno, K., & Nagawa, H. (2004). The
expression pattern of UDP-N-acetyl-alpha-d-galactosamine: polypeptide N-acetylgalactosaminyl transferase-3 in early gastric carcinoma. J Surg Oncol, 86(1), 28-33. doi:10.1002/jso.20042
11. Gomes, J., Marcos, N. T., Berois, N., Osinaga, E., Magalhaes, A., Pinto-de-Sousa, J., . . . Reis, C. A. (2009). Expression of UDP-N-acetyl-D-galactosamine:
polypeptide N-acetylgalactosaminyltransferase-6 in gastric mucosa, intestinal metaplasia, and gastric carcinoma. J Histochem Cytochem, 57(1), 79-86.
doi:10.1369/jhc.2008.952283
12. Gao, Y., Liu, Z., Feng, J., Sun, Q., Zhang, B., Zheng, W., & Ma, W. (2013).
Expression pattern of polypeptide N-acetylgalactosaminyltransferase-10 in gastric carcinoma. Oncol Lett, 5(1), 113-116. doi:10.3892/ol.2012.980 13. Hua, D., Shen, L., Xu, L., Jiang, Z., Zhou, Y., Yue, A., . . . Wu, S. (2012).
Polypeptide N-acetylgalactosaminyltransferase 2 regulates cellular metastasis-associated behavior in gastric cancer. Int J Mol Med, 30(6), 1267-1274. doi:10.3892/ijmm.2012.1130
14. Wu, Y. M., Liu, C. H., Hu, R. H., Huang, M. J., Lee, J. J., Chen, C. H., . . . Huang, M.
C. (2011). Mucin glycosylating enzyme GALNT2 regulates the malignant character of hepatocellular carcinoma by modifying the EGF receptor. Cancer Res, 71(23), 7270-7279. doi:10.1158/0008-5472.CAN-11-1161
15. Lin, M. C., Huang, M. J., Liu, C. H., Yang, T. L., & Huang, M. C. (2014). GALNT2 enhances migration and invasion of oral squamous cell carcinoma by regulating EGFR glycosylation and activity. Oral Oncol, 50(5), 478-484.
doi:10.1016/j.oraloncology.2014.02.003
16. Kanat, O., O'Neil, B., & Shahda, S. (2015). Targeted therapy for advanced gastric cancer: A review of current status and future prospects. World J Gastrointest Oncol, 7(12), 401-410. doi:10.4251/wjgo.v7.i12.401
17. Gupta, R., Dastane, A. M., Forozan, F., Riley-Portuguez, A., Chung, F., Lopategui, J., & Marchevsky, A. M. (2009). Evaluation of EGFR abnormalities in patients with pulmonary adenocarcinoma: the need to test neoplasms with more than one method. Mod Pathol, 22(1), 128-133. doi:10.1038/modpathol.2008.182 18. Yewale, C., Baradia, D., Vhora, I., Patil, S., & Misra, A. (2013). Epidermal growth
factor receptor targeting in cancer: a review of trends and strategies.
Biomaterials, 34(34), 8690-8707. doi:10.1016/j.biomaterials.2013.07.100 19. Siegelin, M. D., & Borczuk, A. C. (2014). Epidermal growth factor receptor
mutations in lung adenocarcinoma. Lab Invest, 94(2), 129-137.
doi:10.1038/labinvest.2013.147
20. Masuda, H., Zhang, D., Bartholomeusz, C., Doihara, H., Hortobagyi, G. N., &
Ueno, N. T. (2012). Role of epidermal growth factor receptor in breast cancer.
Breast Cancer Res Treat, 136(2), 331-345. doi:10.1007/s10549-012-2289-9 21. Lieto, E., Ferraraccio, F., Orditura, M., Castellano, P., Mura, A. L., Pinto, M., . . .
Galizia, G. (2008). Expression of vascular endothelial growth factor (VEGF) and epidermal growth factor receptor (EGFR) is an independent prognostic
indicator of worse outcome in gastric cancer patients. Ann Surg Oncol, 15(1), 69-79. doi:10.1245/s10434-007-9596-0
22. Nagatsuma, A. K., Aizawa, M., Kuwata, T., Doi, T., Ohtsu, A., Fujii, H., & Ochiai, A.
(2015). Expression profiles of HER2, EGFR, MET and FGFR2 in a large cohort of patients with gastric adenocarcinoma. Gastric Cancer, 18(2), 227-238.
doi:10.1007/s10120-014-0360-4
23. Kurokawa, Y., Matsuura, N., Kawabata, R., Nishikawa, K., Ebisui, C., Yokoyama, Y., . . . Doki, Y. (2014). Prognostic impact of major receptor tyrosine kinase expression in gastric cancer. Ann Surg Oncol, 21 Suppl 4, S584-590.
doi:10.1245/s10434-014-3690-x
24. Gao, M., Liang, X.-J., Zhang, Z. S., Ma, W., Chang, Z. W., & Zhang, M. Z. (2013).
Relationship between expression of EGFR in gastric cancer tissue and clinicopathological features. Asian Pacific Journal of Tropical Medicine, 6(4), 260-264. doi:10.1016/s1995-7645(13)60054-1
25. Galizia, G., Lieto, E., Orditura, M., Castellano, P., Mura, A. L., Imperatore, V., . . . Ferraraccio, F. (2007). Epidermal growth factor receptor (EGFR) expression is associated with a worse prognosis in gastric cancer patients undergoing curative surgery. World J Surg, 31(7), 1458-1468.
doi:10.1007/s00268-007-9016-4
26. Fuse, N., Kuboki, Y., Kuwata, T., Nishina, T., Kadowaki, S., Shinozaki, E., . . . Ohtsu, A. (2016). Prognostic impact of HER2, EGFR, and c-MET status on overall survival of advanced gastric cancer patients. Gastric Cancer, 19(1), 183-191.
doi:10.1007/s10120-015-0471-6
27. Duan, H., Qu, L., & Shou, C. (2014). Activation of EGFR-PI3K-AKT signaling is required for M. hyorhinis-promoted gastric cancer migration. Cancer Cell Int., 14, 135.
28. Zhen, Y., Guanghui, L., & Xiefu, Z. (2014). Knockdown of EGFR inhibits growth and invasion of gastric cancer cells. Cancer Gene Therapy, 21(11), 491-497.
doi:10.1038/cgt.2014.55
29. Nieto, Y., Nawaz, F., Jones, R. B., Shpall, E. J., & Nawaz, S. (2007). Prognostic significance of overexpression and phosphorylation of epidermal growth factor receptor (EGFR) and the presence of truncated EGFRvIII in locoregionally advanced breast cancer. J Clin Oncol, 25(28), 4405-4413.
doi:10.1200/JCO.2006.09.8822
30. Wang, F., Wang, S., Wang, Z., Duan, J., An, T., Zhao, J., & Bai, H. (2012).
Phosphorylated EGFR expression may predict outcome of EGFR-TKIs therapy for the advanced NSCLC patients with wild type EGFR. J Exp Clin Cancer Res, 31, 65.
31. Magkou, C., Nakopoulou, L., Zoubouli, C., Karali, K., Theohari, I., Bakarakos, P.,
& Giannopoulou, I. (2008). Expression of the epidermal growth factor receptor (EGFR) and the phosphorylated EGFR in invasive breast carcinomas. Breast Cancer Res, 10(3), R49. doi:10.1186/bcr2103
32. Zhang, F., Tang, J. M., Wang, L., Shen, J. Y., Zheng, L., Wu, P. P., . . . Yan, Z. W.
(2012). Phosphorylation of epidermal growth factor receptor and chromosome 7 polysomy in gastric adenocarcinoma. J Dig Dis, 13(7), 350-359.
doi:10.1111/j.1751-2980.2012.00597.x
33. Liu, S. Y., Shun, C. T., Hung, K. Y., Juan, H. F., Hsu, C. L., Huang, M. C., & Lai, I. R.
(2016). Mucin glycosylating enzyme GALNT2 suppresses malignancy in gastric adenocarcinoma by reducing MET phosphorylation. Oncotarget, 7(10).
34. Loureiro, L. R., Carrascal, M. A., Barbas, A., Ramalho, J. S., Novo, C., Delannoy, P., & Videira, P. A. (2015). Challenges in Antibody Development against Tn and Sialyl-Tn Antigens. Biomolecules, 5(3), 1783-1809. doi:10.3390/biom5031783 35. Wu, Q., Liu, H. O., Liu, Y. D., Liu, W. S., Pan, D., Zhang, W. J., . . . Gu, J. X. (2015).
Decreased expression of hepatocyte nuclear factor 4alpha
(Hnf4alpha)/microRNA-122 (miR-122) axis in hepatitis B virus-associated hepatocellular carcinoma enhances potential oncogenic GALNT10 protein activity. J Biol Chem, 290(2), 1170-1185. doi:10.1074/jbc.M114.601203
36. Ho, W. L., Chou, C. H., Jeng, Y. M., Lu, M. Y., Yang, Y. L., Jou, S. T., . . . Huang, M.
C. (2014). GALNT2 suppresses malignant phenotypes through IGF-1 receptor and predicts favorable prognosis in neuroblastoma. Oncotarget, 5(23), 12247-12259.
37. Morishita, A., Gong, J., & Masaki, T. (2014). Targeting receptor tyrosine kinases in gastric cancer. World J Gastroenterol, 20(16), 4536-4545.
doi:10.3748/wjg.v20.i16.4536
38. Guo, G., Gong, K., Wohlfeld, B., Hatanpaa, K. J., Zhao, D., & Habib, A. A. (2015).
Ligand-Independent EGFR Signaling. Cancer Res, 75(17), 3436-3441.
doi:10.1158/0008-5472.CAN-15-0989
39. Slieker, L. J., Martensen, T. M., & Lane, M. D. (1986). Synthesis of Epidermal Growth Factor Receptor in Human A431 Cell. J. Biol. Chem, 261(32),
15233-15241.
40. Liu, Y. C., Yen, H. Y., Chen, C. Y., Chen, C. H., Cheng, P. F., Juan, Y. H., . . . Wong, C. H. (2011). Sialylation and fucosylation of epidermal growth factor receptor suppress its dimerization and activation in lung cancer cells. Proc Natl Acad Sci U S A, 108(28), 11332-11337. doi:10.1073/pnas.1107385108
41. Zhou, X., Zheng, M., Chen, F., Zhu, Y., Yong, W., Lin, H., . . . Han, X. (2009).
Gefitinib inhibits the proliferation of pancreatic cancer cells via cell cycle arrest.
Anat Rec (Hoboken), 292(8), 1122-1127. doi:10.1002/ar.20938
42. Puglisi, M., Thavasu, P., Stewart, A., de Bono, J. S., O'Brien, M. E., Popat, S., . . . Banerji, U. (2014). AKT inhibition synergistically enhances growth-inhibitory effects of gefitinib and increases apoptosis in non-small cell lung cancer cell lines. Lung Cancer, 85(2), 141-146. doi:10.1016/j.lungcan.2014.05.008 43. Chen, G., Kronenberger, P., Teugels, E., Umelo, I. A., & Grève, J. D. (2012).
Targeting the epidermal growth factor receptor in non-small cell lung cancer cells the effect of combining RNA interference with tyrosine kinase inhibitors or cetuximab. BMC Med, 10, 28.
44. Robertson, D., Savage, K., Reis-Filho, J. S., & Isacke, C. M. (2008). Multiple immunofluorescence labelling of formalin-fixed paraffin-embedded (FFPE) tissue. BMC Cell Biol, 9, 13. doi:10.1186/1471-2121-9-13
45. Bataille, F., Troppmann, S., Klebl, F., Rogler, G., Stoelcker, B., Hofstadter, F., . . . Rummele, P. (2006). Multiple immunofluorescence labelling of formalin-fixed parafffin embedded section. Appl Immunohistochem Mol Morphol., 14, 225-228.
46. H., W., & T., Y. (2013). Molecular targeted therapies in advanced gastric cancer:
does tumor histology matter. Ther Adv Gastroenterol, 6(1), 15-31. doi:10.1177/
47. Atmaca, A., Werner, D., Pauligk, C., Steinmetz, K., Wirtz, R., & Altmannsberger, H. M. (2012). The prognostic impact of epidermal growth factor receptor in patients with metastatic gastric cancer. BMC Cancer, 12, 524.