國立臺灣大學理學院海洋研究所 博士論文
Institute of Oceanography College of Science
National Taiwan University Doctoral Dissertation
溫度對亞熱帶淡水生態系群聚呼吸率的調控
Temperature effects on plankton community respiration in a subtropical freshwater ecosystem
賴昭成 Chao-Chen Lai
指導教授﹕夏復國 博士 Advisor: Fuh-Kwo Shiah, Ph.D.
中華民國 106 年 1 月
誌謝
這本論文能夠產出,首先要感謝我的指導老師夏復國博士,還有口試委員蔣國平 老師,陳仲吉老師,謝志豪老師與柯佳吟老師給我極大容忍與幫助,並且在我最無助 與迷惘的時候扶助我,不只在學業上給予建議,並且日常生活也常關心我。在此也要 特別感謝張正老師義不容辭的擔任我資格考的口試老師。我知道這論文還有很多可以 加強地方,誠如各位老師們所言,這些數據有其獨特的價值,未來的日子,我將會不 斷努力進步並且更加完善的"利用"這些數據,不會辜負大家給我這麼多的機會。
還要感謝翡翠水庫管理局給我們這麼多機會可以採樣,相信這些數據未來將會有 極大的科學用途。也感謝海研1號,2號,3號以及船員們給與的幫助。
十年博士的生活有很大的變化,一個人的日子更是有一言難盡的五味雜陳,幸而 有夏家軍實驗室的眾多學弟妹與學長姊,還有四位口試委員老師蔣家,謝家,阿吉哥 家和柯老師的實驗室,加上中研院環變中心黃天福老師老師實驗室的助理們,不僅只 是在實驗上的幫助,日常需要幫忙得地方也義不容辭得給我協助。其他還有很多關心 我的人,實在太多人要感謝了,我恐怕無法一一列出,不過你們知道的,雖然你們給 我壓力也不小,但我永遠不會忘記朋友得陪伴。
最後感謝我的家人,陪我任性的度過了這幾年,我無以回報,只能抱著大家的期 許繼續奮鬥。
摘要
本研究為了瞭解浮游生物群聚呼吸率(CR)與細菌呼吸率(BR)的調控機制,在一磷限 制的亞熱帶水庫進行為期十年的採樣,頻度為每周~每兩周一次(水溫低於 10℃)。我 們發現在夏季的時候群聚呼吸率和細菌呼吸率皆擁有較高的值與較大的變動。研究結果 顯示,溫度與群聚呼吸率,細菌呼吸率,標準化群聚呼吸率(SCR),標準化細菌呼吸率 (SBR)皆有顯著正相關(p<0.05)。其和溫度的關係可用阿瑞尼斯方程式來表示:
R = 𝑅𝑜𝑒−𝐸𝑎⁄𝑘𝑇
這裡的 Ea 稱為活化能可以表示溫度與呼吸率的相關性,群聚呼吸率為 0.80±0.04, 標準 化群聚呼吸率為 0.34±0.06,細菌呼吸率為 0.93±0.06,而標準化細菌呼吸率為 0.39±0.06。
這顯示了溫度也許是控制群聚呼吸率與細菌呼吸率主要因子。我們亦發現 BR 有較高的 Ea 值,這暗示了在未來環境溫度改變的時候,細菌呼吸率會有較顯著的改變。
為了進一步探究溫度的影響,進行為期2年的溫度操控實驗。我們的結果顯示了,
短期間的溫度改變下,群聚呼吸率活化能為 0.69,細菌為 1.07。而長期得觀測結果總和 群聚呼吸率活化能為 0.67,細菌為 0.94。細菌對於環境溫度的敏感度要高於整個群聚。
我們的結果也顯示了,溫度的改變會增加系統的不穩定。
關鍵字: 群聚呼吸率, 細菌呼吸率, 溫度, 亞熱帶, 水庫, 活化能
Abstract
With a ten-year weekly to biweekly data set taken from a P-limited subtropical reservoir, this study intends to explore the potential mechanisms in controlling the temporal variation of plankton community respiration rate (CR) and bacterial respiration rate (BR). Summer not only had high CR and BR value, but also high variation. The results showed that CR, BR, specific plankton community respiration (SCR), and specific bacterial respiration (SBR) all correlated with temperature significantly (p < 0.05). Activation energy, Ea, of CR is 0.80±0.04, SCR is 0.34±0.06, BR is 0.93±0.06, and SBR is 0.39±0.06. The results also indicated that temperature might be the major controlling factor for CR and BR. We also found that Ea-BR is high than Ea-CR, which indicate that BR was more sensitive to temperature than CR.
Temperature manipulation experiment provide a situation to estimate temperature effect in wilder range. However, the most common characteristic of temperature response, activation energy (Ea), might be more variation. Our result combined two years temperature
manipulation, the result proved that BR is more sensitive than CR either short-term
temperature change (CR:0.69 and BR: 1.07) or long-term seasonal variation(CR: 0.67 ± 0.05 and BR:0.94 ± 0.08). Temperature change would increase system unstability. Two years result comparison showed that environmental condition would affect result warming.
Key words: Community respiration, Bacterial respiration, Temperature, subtropical, reservoir, Activation energy
目錄 Table of Contents
口試委員會審定書………....…i
誌謝………...ii
中文摘要………..iii
Abstract ……….…...iv
List of Tables………...vii
List of Figures……… viii
Chapter1 Introduction………... 1
References………..8
Chapter2 Decadal variation of plankton community respiration………..11
Abstract………....12
Introduction………..13
Materials and methods……….…….15
Results……….…….18
Discussion and conclusion………..20
References………...22
Chapter3 Decadal variation of bacterial respiration……… ………34
Abstract………35
Introduction………..36
Materials and methods………..37
Results………..40
Discussion and conclusion………41
References………42
Chapter4 Temperature manipulation of community respiration and bacterial respiration……….47
Abstract………...48
Introduction……….49
Materials and methods………51
Results……….53
Discussion and conclusion………..55
References………57
Chapter5 Conclusion……...……….. .62
References………... 64
List of Tables
Table 1. Average, standard deviations, maximums, and minimums of measured parameters in Fei-tsui reservoir………25 Table 2. Correlation matrix of all measured parameters……… 26 Table 3. Correlation matrix of measured parameters about BR………...43 Table 4. Activation energy (Ea) of CR and BR in all treatments of temperature manipulation experiment………...58 Table5. Ea of CR and BR for the literature and this study………..65
List of Figure
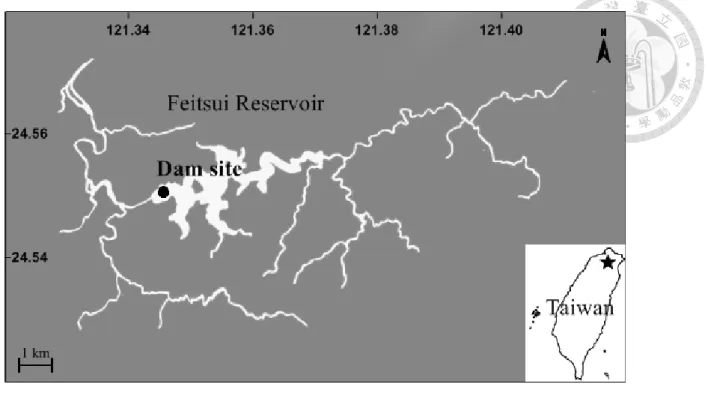
Figure 1. Study site, Fei-tsui reservoir, showing the dam site……….…27
Figure 2. Decadal variation of measured parameters………..……….…28
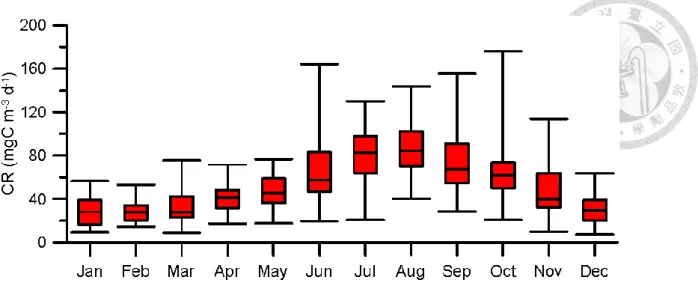
Figure 3. Box plot for monthly variation of CR……….……….…31
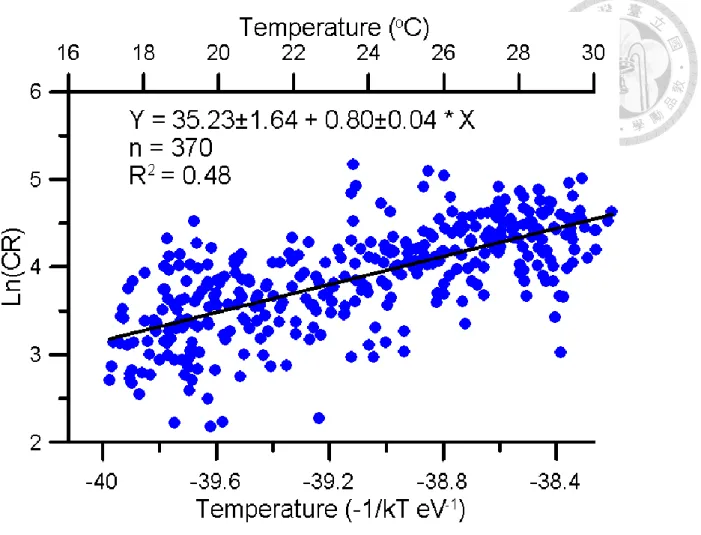
Figure 4. Relationship between of Temperature and CR……….…………32
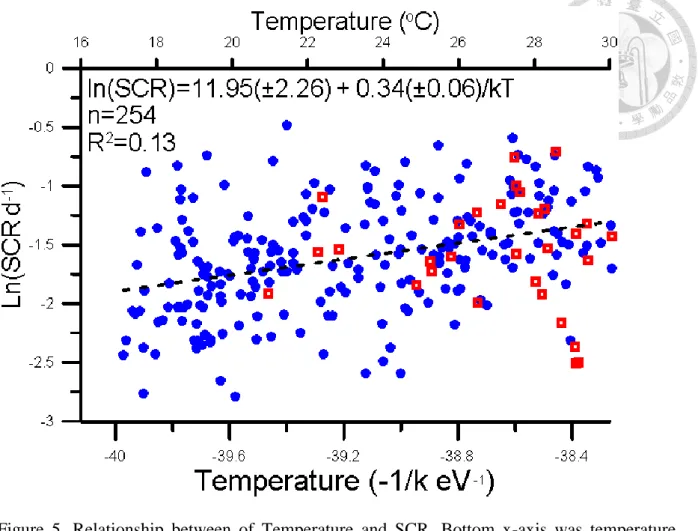
Figure 5. Relationship between of Temperature and SCR……….………..33
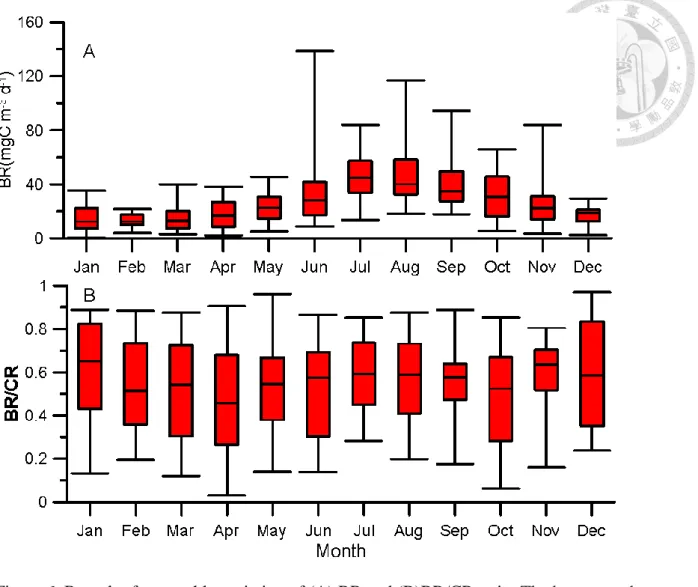
Figure 6. Box plot for monthly variation of (A) BR and (B) BR/CR ratio……...44
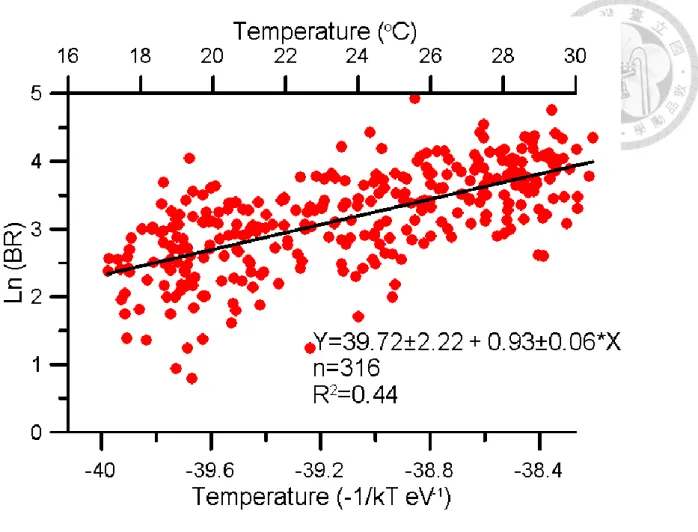
Figure 7. Relationship between of Temperature and BR……….……….45
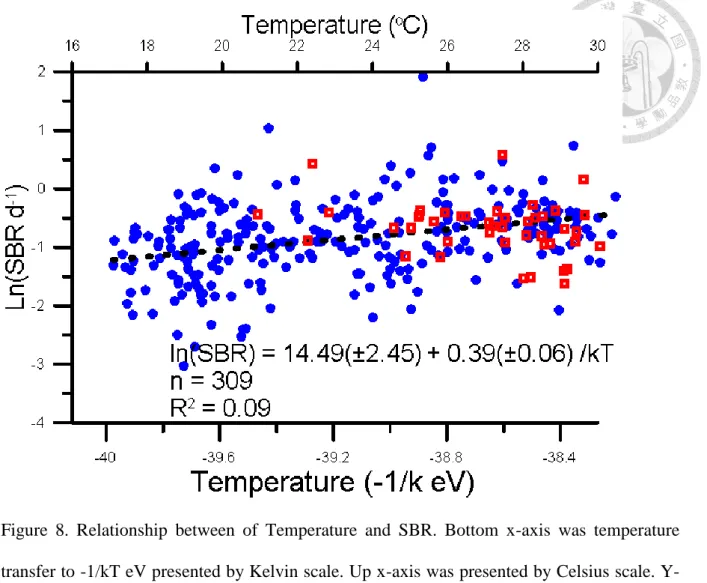
Figure 8. Relationship between of Temperature and SBR………..46
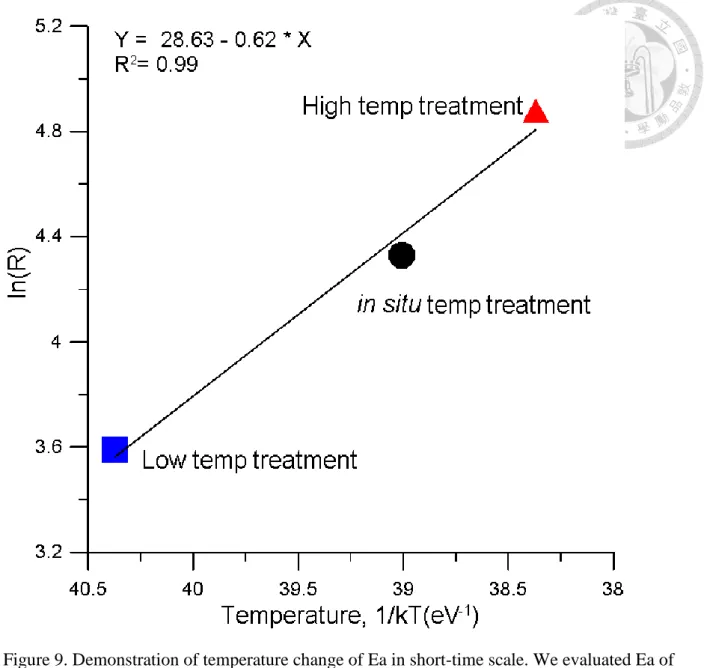
Figure 9. Demonstration of temperature change of Ea in short-time scale……..59
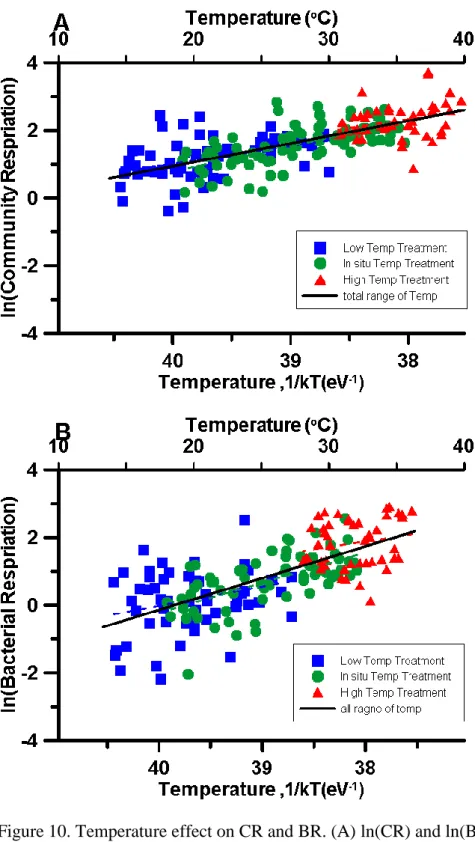
Figure 10. Temperature effect on CR and BR………..60
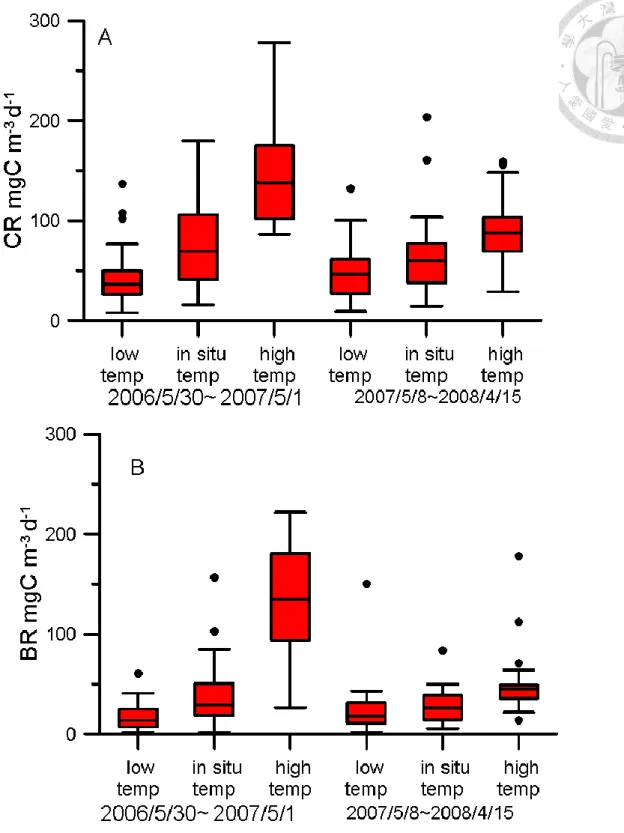
Figure 11. Box-plot for three treatments of CR and BR………..….61
Chapter 1
Introduction
Global change in the 21th century is causing some series climate changes. Global warming is the most popular issue. A large numbers of investigation revealed that greenhouse gases, which include carbon dioxide and methane, cause global warming. The most important greenhouse gas is carbon dioxide (IPCC, 2007). Increasing carbon dioxide in atmosphere was produced by human activities in recent century. However, some mechanisms in earth system regulated carbon cycling. Some theories suggested that biological processes could play important roles (Lovelock, 1972). Understanding those regulation mechanisms of carbon cycling can help us to predicted carbon dioxide variation. In addition, it can help us to predict future global change pattern precisely.
Community respiration rate (CR) and primary productivity (PP) are the two opposed key processes controlling organic material cycling within any ecosystem. PP represents the production rate of organic carbon converted from inorganic carbon (e.g. CO2). This process supplys a basic carbon resource to ecosystem. CR is the sum of organic carbon consumption rate conducted by all living organisms. This process represented that one of organic carbon remineralization. Higher PP linked to uptake of CO2 by primary producer but higher CR linked to release of CO2 by all of community components. Thus, Dynamic of CR and PP related the carbon balance in an ecosystem, and controlled CO2 exchange between pelagic system and atmosphere (Legendre & Rivkin, 2002; Rivkin & Legendre, 2001).
The ratio of PP/CR can also be an index of ecosystem trophic condition. When PP/CR ratio is large than 1, that means that the carbon resource production exceeds consumption. This system can be considered autotrophic state. It also means that there are excess carbon that can transport to out of system. On the contrary side, when PP/CR ratio is small than 1, that mean
in a dynamic ecosystem. That might vary by effect of environmental changes. Although PP and CR play equal important rules in carbon cycling of ecosystem, the understanding of CR is still limited comparing with PP due to the methodological limitation.
Brown, Gillooly, Allen, Savage, and West (2004) demonstrated the metabolic theory of ecology (MTE), which explain that organism metabolic rate is controlling by three factors: body size, temperature, and stoichiometry.
The relationship between body size and metabolic rate can be presented by the allometric equation:
I = 𝐼𝑜𝑀3⁄4 Io is normalization constant. M is body size.
The relationship between temperature and metabolic rates can be presented by the Van’t Hoff-Arrhenius relation:
𝑒−𝐸𝑎⁄𝑘𝑇
Ea is the activity energy, k is Boltzmann’s constant, and T is absolute temperature in K (Brown et al., 2004). This formula supplied a simply way to predict metabolic rate variation with temperature.
MTE combine two formulas and can be presented by a formula:
I = 𝐼𝑜𝑀34𝑒−𝐸𝑎⁄𝑘𝑇
Io, the normalization constant, implied environmental condition that affect organisms’
stoichiometry.
It can be derivative that three major kinds of controlling factors of CR in aquatic ecosystems. First are physical factors that include temperature. Second are chemical factors that include nutrient concentration, dissolved organic carbon concentration, and particulate organic carbon concentration, which control the stoichiometry of community. Third are biological
factors that include biomass and community structure.
Temperature is the most important environmental variable for the regulation of metabolic rate. If we consider about temperature and CR, MTE can simplify to the Van’t Hoff-Arrhenius type formula:
R = 𝑅𝑜𝑒−𝐸𝑎⁄𝑘𝑇
Ro is normalization constant, which include two parts: environmental condition and community biomass (Enquist et al., 2003). Activity energy Ea can be regarded a characteristic of temperature dependence. Ea also can be considered a temperature sensitivity index. Higher Ea means CR increase more with temperature increasing and more sensitivity.
This relationship can help us realize the temperature effect and predict the variation of CR in different ecosystems (Lopez-Urrutia, San Martin, Harris, & Irigoien, 2006; Gabriel Yvon- Durocher & Allen, 2012). Previous studies showed that temperature is an important factor of CR in aquatic ecosystems (Lopez-Urrutia et al., 2006; Smith & Kemp, 1995), and also is a key factor of BR (Apple, del Giorgi, & Kemp, 2006; A. Lopez-Urrutia & X. A. Moran, 2007).
Rivkin and Legendre (2001) found that there is a negative relationship between temperature and BGE, which implied that BR would increase with increasing temperature. Thus, environmental temperature variation would affect CR.
Some studies about predicting CR model did not consider resource input effect (Lopez- Urrutia et al., 2006). However, Duarte and Agusti (1998) found that CR was scales as the two- thirds power of the gross primary production in aquatic system, which indicated that carbon resource in ecosystem is an essential controlling factor of CR. In addition, some investigations still revealed nutrient or carbon resource could affect CR variation. Smith and Kemp (2003)
high CR even GPP was still low in continental shelf environment.
In aquatic system, planktonic organisms are most abundant community and contribute most of biomass. Planktonic community respiration (CR) occupied the most important component of CR (Paul A Del Giorgio & Williams, 2005; Hopkinson, Sherr, & Wiebe, 1989b;
Smith & Kemp, 2001). Biomass is a key controlling factor of CR (Robinson et al., 2002). In addition, community structure change can affect CR variation (Smith & Kemp, 2001).
Microbial community (<3 mm) have smaller size and higher metabolic rate. Microbial community respiration could be a major component of CR (C. C. Chen et al., 2003).
Bacterioplankton (bacteria) is very important component of planktonic community.
Bacteria are most abundant of organism in any aquatic systems. They contribute an amount of biomass and material flux in most ecosystems. In marine systems, bacterioplankton account for 60% of the organism surface area (Cho & Azam, 1988) and have been shown to process up to 90% of locally produced photosynthate (Biddanda, Opsahl, & Benner, 1994). In lakes, where burial and remineralization processes are significant contributors to global fluxes (Dean &
Gorham, 1998), bacteria have been shown to be key component diving biogeochemical processes with bacterial activity including bacterial production (BP) and bacterial respiration (BR) (Biddanda, Ogdahl, & Cotner, 2001). Moreover, because bacteria are the smallest size of organisms, they have the highest unit metabolic rate, and they are more sensitivity with variation of environment. In most aquatic ecosystems, BR is the major component of CR; the percentage of BR/CR can exceed 50% (P. A. del Giorgio & Peters, 1993; Hopkinson, Sherr, &
Wiebe, 1989a; Sand-Jensen, Jensen, Marcher, & Hansen, 1990). Previous studies presented that BR/CR ratio could varied from 10 to 90 % in lake systems(Biddanda et al., 2001), and variation of BR would affect the variation of CR strongly(Berman, Yacobi, Parparov, & Gal, 2010).
Comparing to a number of PP researches, studied of CR in ecosystem are still very unclear
because of methodology limitation (Paul A Del Giorgio & Williams, 2005). Radioisotope tracer technique (14C, 18O. et al.) improve more observations about PP, but not CR. Traditional Dark bottle method is still a popular and reliable method. G. Yvon-Durocher et al. (2012) try to find out a general pattern for temperature and CR. They conclude that Ea is about 0.62eV in entire ecosystems, which combine nine different types of aquatic and terrestrial ecosystem. However, more and more studies revealed that Ea is not constant. There are differences of Ea in different ecosystem. Even Ea can change in the same ecosystem during different environmental condition.
Fresh water systems, including lake and reservoir, only occupy small part of area in earth surface, but they are close to terrestrial systems and are affected by human activities. Fresh water systems are also very important water resource. For this reason, some time series observations were established, and prove information to understand the long-term CR variation.
However, there is a few of data about subtropical freshwater system and long-time observation is still lack. Thus, more observation in freshwater system is necessary.
Fei-tsui reservoir, located on the downstream of Pei-Shi River in the northern of Taiwan, is a subtropical fresh-water system. It is the major water supply to Taipei metropolitan area. The reservoir was protected from human activities and keep as a natural semi-closed system (Ko, Lai, Chen, Hsu, & Shiah, 2016). There are high frequent typhoon events every year. The strong turbulent can change system condition after typhoon event. It can increase chl-a concentration and primary production in different level (Ko et al., 2016; Ko, Lai, Hsu, & Shiah, 2017).
According to official record, it is a mesotrophic aquatic system. However, previous study showed that it might be a phosphorus limitation system because low inorganic phosphate
typhoon season occasionally. In summer season, the strong stratification could limit nutrient inject to surface water system. Those nutrient input in bottom water would exploit by bacteria and not inject to euphotic zone. In cool season (autumn and winter), the mixing layer become deeper and nutrient in deeper water column could bring up to surface water column. That complicated situation provided an opportunity for investigation of controlling factors of CR variation.
In this dissertation, we want to understand the CR variation in a subtropical fresh system.
Ten years mooring observation supplied a long-term dataset for understanding controlling factors of seasonal CR variation. High frequency sampling can help us realize detail dynamic CR. Our aims are two: first, to find out the major regulating factors of CR, second, to testify whether the Ea is constant. Our hypotheses are (1) temperature is the most important regulating factor of CR and BR, (2) temperature sensitivity index (Ea) in Fei-tsui is different from general value.
Reference
Apple, J. K., del Giorgi, P. A., and Kemp, W. M.: Temperature regulation of bacterial production, respiration, and growth efficiency in a temperate salt-marsh estuary, Aquat Microb Ecol, 43, 243-254, 2006.
Berman, T., Yacobi, Y. Z., Parparov, A., and Gal, G.: Estimation of long-term bacterial respiration and growth efficiency in Lake Kinneret, FEMS Microbiol. Ecol., 71, 351-363, 2010.
Biddanda, B., Ogdahl, M., and Cotner, J.: Dominance of bacterial metabolism in oligotrophic relative to eutrophic waters, Limnol Oceanogr, 46, 730-739, 2001.
Biddanda, B., Opsahl, S., and Benner, R.: Plankton Respiration and Carbon Flux through Bacterioplankton on the Louisiana Shelf, Limnol Oceanogr, 39, 1259-1275, 1994.
Brown, J. H., Gillooly, J. F., Allen, A. P., Savage, V. M., and West, G. B.: Toward a metabolic theory of ecology, Ecology, 85, 1771-1789, 2004.
Chen, C. C., Shiah, F. K., Gong, G. C., and Chiang, K. P.: Planktonic community respiration in the East China Sea: importance of microbial consumption of organic carbon, Deep-Sea Res Pt Ii, 50, 1311-1325, 2003.
Cho, B. C. and Azam, F.: Major role of bacteria in biogeochemical fluxes in the ocean's interior, Nature, 332, 441-443, 1988.
Dean, W. E. and Gorham, E.: Magnitude and significance of carbon burial in lakes, reservoirs, and peatlands, Geology, 26, 535-538, 1998.
del Giorgio, P. A. and Peters, R. H.: Balance between phytoplankton production and plankton respiration in lakes, Can. J. Fish. Aquat. Sci., 50, 282-289, 1993.
Duarte, C. M. and Agusti, S.: The CO2 balance of unproductive aquatic ecosystems, Science, 281, 234-236, 1998.
Hopkinson, C. S., Sherr, B., and Wiebe, W. J.: Size-fractionated metabolism of coastal microbial plankton, Mar Ecol-Prog Ser, 51, 155-166, 1989a.
Hopkinson, C. S., Sherr, B., and Wiebe, W. J.: Size Fractionated Metabolism of Coastal Microbial Plankton, Mar Ecol Prog Ser, 51, 155-166, 1989b.
IPCC: Climate change 2007: The physical science basis, Agenda, 6, 333, 2007.
Ko, C.-Y., Lai, C.-C., Chen, T.-Y., Hsu, H.-H., and Shiah, F.-K.: Typhoon effects on phytoplankton responses in a semi-closed freshwater ecosystem, Marine and Freshwater Research, 67, 546-555, 2016.
Ko, C.-Y., Lai, C.-C., Hsu, H.-H., and Shiah, F.-K.: Decadal phytoplankton dynamics in response to episodic climatic disturbances in a subtropical deep freshwater ecosystem, Water Research, 109, 102-113, 2017.
Legendre, L. and Rivkin, R. B.: Fluxes of carbon in the upper ocean: regulation by food-web control nodes, Mar Ecol Prog Ser, 242, 95-109, 2002.
Lopez-Urrutia, A. and Moran, X. A.: Resource limitation of bacterial production distorts the temperature dependence of oceanic carbon cycling, Ecology, 88, 817-822, 2007.
Lopez-Urrutia, A., San Martin, E., Harris, R. P., and Irigoien, X.: Scaling the metabolic balance of the oceans, Proc. Natl. Acad. Sci. U. S. A., 103, 8739-8744, 2006.
Lovelock, J. E.: Gaia as seen through the atmosphere, Atmospheric Environment (1967), 6, 579-580, 1972.
Rivkin, R. B. and Legendre, L.: Biogenic carbon cycling in the upper ocean: effects of microbial respiration, Science, 291, 2398-2400, 2001.
Robinson, C., Serret, P., Tilstone, G., Teira, E., Zubkov, M. V., Rees, A. P., and Woodward, E.
M. S.: Plankton respiration in the Eastern Atlantic Ocean, Deep-Sea Research Part I- Oceanographic Research Papers, 49, 787-813, 2002.
Sand-Jensen, K., Jensen, L. M., Marcher, S., and Hansen, M.: Pelagic metabolism in eutrophic coastal waters during a late summer period, Mar Ecol-Prog Ser, 65, 63-72, 1990.
Smith, E. M. and Kemp, W. M.: Planktonic and bacterial respiration along an estuarine
gradient: responses to carbon and nutrient enrichment, Aquat Microb Ecol, 30, 251-261, 2003.
Smith, E. M. and Kemp, W. M.: Seasonal and regional variations in plankton community production ad respiration for Chesapeake Bay, Mar Ecol Prog Ser, 116, 217-231, 1995.
Smith, E. M. and Kemp, W. M.: Size structure and the production/respiration balance in a coastal plankton community, Limnol Oceanogr, 46, 473-485, 2001.
Tseng, Y. F., Lin, F. J., Chiang, K. P., Kao, S. J., and Shiah, F. K.: Potential impacts of N-2- fixing Trichodesmium on heterotrophic bacterioplankton turnover rates and organic carbon transfer efficiency in the subtropical oligotrophic ocean system, Terr Atmos Ocean Sci, 16, 361-376, 2005.
Yvon-Durocher, G. and Allen, A. P.: Linking community size structure and ecosystem functioning using metabolic theory, Philosophical Transactions of the Royal Society B- Biological Sciences, 367, 2998-3007, 2012.
Yvon-Durocher, G., Caffrey, J. M., Cescatti, A., Dossena, M., del Giorgio, P., Gasol, J. M., Montoya, J. M., Pumpanen, J., Staehr, P. A., Trimmer, M., Woodward, G., and Allen, A. P.:
Reconciling the temperature dependence of respiration across timescales and ecosystem types, Nature, 487, 472-476, 2012.
Chapter 2.
Decadal variation of plankton community respiration
Abstract
With a ten-year weekly to biweekly data set taken from a P-limited subtropical reservoir, this study intends to explore the potential mechanisms in controlling the temporal variation of plankton community respiration rate (CR). Summer had high CR value and variation. The results showed that CR and specific plankton community respiration (SCR) correlated with temperature. Ea of CR is 0.80±0.04. and SCR is 0.34±0.06. The results also indicated that temperature might be the major controlling factor for CR and SCR.
Introduction
In pelagic systems, Planktonic organisms are most abundant community and contribute most of biomass. Plankton have smaller size and higher metabolic rate. Plankton community respiration (CR) occupied the most important component of ecosystem respiration (ER) (Paul A Del Giorgio & Williams, 2005; Hopkinson et al., 1989b; Smith & Kemp, 2001).
CR and primary productivity (PP) are the two opposed key processes controlling organic material cycling within any ecosystem. PP represents the production rate of organic carbon converted from inorganic carbon (e.g. CO2). This process supplied a basic carbon resource to ecosystem. CR is the sum of organic carbon consumption rate conducted by all living organisms.
This process represented that one of organic carbon remineralization. Higher PP linked to uptake of CO2 by primary producer but higher CR linked to release of CO2 by all of community components. Thus, Dynamic of CR and PP related the carbon balance in an ecosystem, and controlled CO2 exchange between pelagic system and atmosphere.
There are three major kinds of controlling factors of CR in aquatic ecosystems. First are physical factors that include temperature and solar radiation. Second are chemical factors that include nutrient concentration, dissolved organic carbon concentration, and particulate organic carbon concentration. Third are biological factors that include biomass, community structure.
Temperature is the most important environmental variable for the regulation of metabolic rate.
Fei-tsui reservoir is a subtropical fresh-water. Because Fei-tsui reservoir is major water supply for Taipei metropolitan, it is protected well and maintain natural environment. There are high frequent typhoon events every year. The strong turbulent can change system condition after typhoon event. It can increase chl-a concentration and primary production in different level (Ko et al., 2016; Ko et al., 2017). According to official record, it is a mesotrophic aquatic system. However, previous study showed that it might be a phosphorus limitation system
because low inorganic phosphate concentration in water column (Tseng et al., 2005). There were some extra-phosphate resource from upstream discharge infused into the bottom of water column in typhoon season occasionally. In summer season, the strong stratification could limit nutrient inject to surface water system. Those nutrient input in bottom water would exploit by bacteria and not inject to euphotic zone. In cool season (autumn and winter), the mixing layer become deeper and nutrient in deeper water column could bring up to surface water column.
Those complicated situations provided an opportunity for investigation of controlling factors of CR variation.
In this chapter, we want to understand the CR variation in a semi-close fresh system. By ten years investigation, we try to find out the major regulating factors of CR. To clarify the temperature effect, we normalize CR by plankton biomass including three major components we measure phytoplankton, bacteria, and cyanobacteria .We suppose that temperature is the most important regulating factor. Temperature control seasonal variation of CR in an aquatic system.
Materials and methods
Study site and sampling
The Fei-tsui reservoir (121° 34’ E, 24° 54’ N) is located in northern Taiwan at an altitude of 300 m and has a basin area of 10.24 km2 (Fig. 1). Weekly to biweekly sampling was conducted at the dam site (depth, ~100m) of the FT reservoir from January 2005 to December 2011. Water samples were collected manually from 7 depths (0, 2, 5, 10, 15, 20 and 30 m) via a 5 L Go-Flo bottle. Profiles of temperature were also recorded by a CTD (IDRONAUT Srl) simultaneously.
Chlorophyll-a concentration, Bacterial abundance, and cyanobacterial abundance Chlorophyll a (chl a) concentrations were determined from samples collected on a 25-mm GF/F (Watman, nominal pore size of 0.7 m) filter. Pigment on the filter was extracted using acetone then determined using an in vitro fluorometer (Turner Designs 10-AU-005) (Parsons, Maita, & M., 1984). A average carbon conversion factor of 52.9 mgC (mgChl-a)-1 in
phytoplankton cell has been chosen for further calculation (C. C. Chen et al., 2006).
Bacterial abundance (BA) and cyanobacterial abundance (Cyano) was counted by flow cytometry. Bacterial biomass (BB) and Cyanobacterial biomass were calculated using a conversion factor of 2 x 10-14 gC cell-1, and 2 x 10-13 gC cell-1 (Lancelot & Billen, 1984).
Primary production and Dissolved organic carbon
The Primary production was measured by the 14C assimilation method(Parsons et al., 1984). The water samples were incubated under an artificial light source, which maximum luminosity is 2000 mE m-2 s-1 , for 2 h with light density filters (ARRI filters, ARRI GB Ltd, Heston, Middlesex , UK, 0, 6, 12, 16, 23, 36, 44, 63 and 91%), then filtered. To remove excess H14CO3-1 , 0.1 N hydrochloric acid (HCl) was added, and the sample was left at room temperature for 24 h. A treatment with LSC-cocktail liquid (Ultima Cold, Packard BioScience
BV, Groningen, Netherlands) was applied for an additional 24 h. A liquid scintillation analyser (Tri-Carb 2900TR, PerkinElmer, Waltham, MA, USA) was then used to count biological radioactivity, which was then expressed as the primary production per unit time.
We fixed PB-I curve with PP per unit time. To estimate PP in sample day, PB-I curve model was fitted by chl-a concentration, the daily solar radiation in and water transmittancy in euphotic zone. (Ko et al., 2016; Tseng et al., 2010)
Samples for DOC measurement were filtered through pre-combusted (500°C) GF/F filters and then filled into pre-combusted 40 ml vials. After the addition of several drops of 80% H3PO4, vials were sealed with pre-combusted aluminum foil and screw caps with Teflon-coated septa. Before analysis, samples were acidified with 80% H3PO4 and sparged with CO2- free O2 at a flow rate of 350 ml min–1 for at least 10 min. Samples were analyzed by high temperature catalytic oxidation method using a Shimadzu TOC 5000 (Tseng et al., 2010).
Plankton community respiration, bacterial respiration and Specific community respiration
Planktonic community respiration rates (PCR) and bacterial respiration rates (BR) were measured as dissolved oxygen (O2) change from the initial in dark incubation. For sampling limitation, PCR and BR measurements only were taken from 2, 10, 15 and 30 m.
To remove large size plankton, the treatment samples of BR were filtered with 3 m polycarbonate filter. The whole water incubation was categorized as CR. Briefly, water samples were siphoned into 350 mL biological oxygen demand (BOD) bottles with opaque plastic film coating. Incubation was performed at in situ temperature for 24 or 48 (when in situ temperature
was defined as respiration (CR and BR). A respiration quotient (RQ) of 1 was used (Paul A Del Giorgio & Williams, 2005; Kirchman, 2010).
Specific community respiration (SCR) is calculated by CR divided by plankton community biomass. Plankton community biomass included three components correlated to PCR: phytoplankton, bacteria, and cyanobacteria. Phytoplankton biomass was calculated by Chl-a*60.25 mgC (mgChl-a)-1 (Yacobi & Zohary, 2010). Bacterial and cyanobacterial biomass were calculated by method mentioned before.
Data analysis
In this study, all measured variables for data analysis were used the depth-average values within the euphotic zone (1% surface light penetrated), which were obtained by dividing depth- integrated (trapezoidal method) values. Statistical analysis including linear regression and Pearson t-test were conducted with Matlab statistical toolbox (Matlab R2010a). Linear regression was used to get relationship of temperature of CR. Pearson t-test was used to test correlation of all measurement parameters.
Results
Environmental parameters seasonal variation
The range and mean of investigation variables during this study were showed in table 1.
The range of temperature exceeded 10℃ presented that there is significant seasonal variation in this system. Most of variables revealed significant seasonal pattern (Fig. 2). The maximum value of abundance of bacteria and cyanobacteria, chlorophyll-a concentration, community respiration and bacterial respiration occurred in summer (June to August), but minimum value of those occurred in winter (December to February).
Most of measurements positively correlated to temperature except nitrate and phosphate (Table 2a). Nitrate showed a negative correlation to temperature, indicating nitrate supply from the deeper and colder water could be the major source of nitrate. Unlike nitrate and other parameters, phosphate showed an insignificant correlation to temperature. Average phosphate concentration was extremely low (0.03 M) and only showed some occasional high values in summer and autumn (Fig. 2E).
There is a very high value of CR in 2013 summer. That special condition because increasing massive biomass of Euglenophyta in one week (unpublic data), and this phenomenon disappeared in next week. The reason of increasing biomass still was unknown. Box-plot of monthly variation of CR showed that CR have higher value and higher variation in warm season (June to September) (Fig 3).
Temperature effect of community respiration and special community respiration
Relationship with temperature and CR can be expressed by Arrhenius plot, which was used to display temperature effect of metabolic rate. According to MTE, organisms’ metabolic
that PCR positively correlated to temperature. Activation energy (Ea) is 0.80 ±0.04.
We separated Special plankton community respiration (SCR) into two different situations, typhoon period and non-typhoon period. However, there was not significant different between two periods (Fig 5). The relationship between temperature and SCR is significant, and activation energy (Ea) is 0.34(±0.06) .
Discussions and conclusions
Water temperature variation in Fei-tsui reservoir showed a subtropical climate temperature pattern (Table.1). Significant temperature variation caused most of ecological variation, which can be explain by correlation analysis (Table. 2). Significant seasonal variation of most variables revealed that temperature was the dominated regulating factor. High temperature not only enhanced plankton metabolic rate but also increase biomass accumulation. The consequent was presented by fluctuation of biological variables following temperature (Fig 2). Temperature is often considered the most important regulating factor in most of ecosystem. A great deal of studies showed that metabolic rate would change directly when environment temperature change (Apple et al., 2006; Hopkinson, 1985; A. Lopez-Urrutia & X. A. G. Moran, 2007;
Sampou & Kemp, 1994; Sherr & Sherr, 1996; Shiah et al., 2006). In this study, the relationship between of temperature in CR could provide other evidence (Fig 4).
SCR was normalized CR for community biomass. In this study, CR was positively correlated to three biomass parameters: phytoplankton, bacteria, and cyanobacteria. Some studies (C. C. Chen, Shiah, Chiang, Gong, & Kemp, 2009) mentioned that heterotrophic nanoflagellate is another important component of CR. However, heterotrophic nanoflagellate abundance is not complete. In limited data of heterotrophic nanoflagellate did not show any relationship between other parameters (unpublic data)
In warm season (June to September), organisms grew and accumulated their biomass. It is easy to understand that higher community respiration rate in warm season because of more biomass (Fig 2, Fig 3). Relationship between temperature and SCR can remove the biomass effect and clarify the temperature response of every unit respiration rate in whole community.
studies showed that annual typhoon events would disturb the stable of system (Ko et al., 2016;
Ko et al., 2017). Typhoon effect can increase primary production and phytoplankton biomass accumulation with different level. However, respiration rate did not be affected by typhoon event. SCR can be a metabolic which maintain life activity. Even environment changed dramatically, plankton community components still respire regularly.
To combine two different result, we can know that temperature is an important regulating factor. Typhoon event is a turbulent factor that can disturb system stability and make CR variation increase, but doesn’t affect relationship between temperature and SCR. For better understanding their effect for CR, we need more investigation and observation because lack study for typhoon effect.
Reference
Apple, J. K., del Giorgi, P. A., and Kemp, W. M.: Temperature regulation of bacterial production, respiration, and growth efficiency in a temperate salt-marsh estuary, Aquat Microb Ecol, 43, 243-254, 2006.
Chen, C. C., Chiang, K. P., Gong, G. C., Shiah, F. K., Tseng, C. M., and Liu, K. K.:
Importance of planktonic community respiration on the carbon balance of the East China Sea in summer, Global Biogeochem Cy, 20, -, 2006.
Chen, C. C., Shiah, F. K., Chiang, K. P., Gong, G. C., and Kemp, W. M.: Effects of the
Changjiang (Yangtze) River discharge on planktonic community respiration in the East China Sea, J Geophys Res-Oceans, 114, -, 2009.
Del Giorgio, P. A. and Williams, P. J. l. B.: Respiration in aquatic ecosystems, Oxford University Press, USA, 2005.
Hopkinson, C. S.: Shallow-water benthic and pelagic metabolism: evidence of heterotrophy in the nearshore Georgia Bight, Mar Biol, 87, 19-32, 1985.
Hopkinson, C. S., Sherr, B., and Wiebe, W. J.: Size Fractionated Metabolism of Coastal Microbial Plankton, Mar Ecol Prog Ser, 51, 155-166, 1989.
Kirchman, D. L.: Microbial ecology of the oceans, John Wiley & Sons, 2010.
Ko, C.-Y., Lai, C.-C., Chen, T.-Y., Hsu, H.-H., and Shiah, F.-K.: Typhoon effects on phytoplankton responses in a semi-closed freshwater ecosystem, Marine and Freshwater Research, 67, 546-555, 2016.
Ko, C.-Y., Lai, C.-C., Hsu, H.-H., and Shiah, F.-K.: Decadal phytoplankton dynamics in response to episodic climatic disturbances in a subtropical deep freshwater ecosystem, Water
production during the spring phytoplankton bloom in the southern bight of the North Sea, Limnol Oceanogr, 29, 721-730, 1984.
Lopez-Urrutia, A. and Moran, X. A. G.: Resource limitation of bacterial production distorts the temperature dependence of oceanic carbon cycling, Ecology, 88, 817-822, 2007.
Pai, S. C., Gong, G. C., and Liu, K. K.: Determination of Dissolved-Oxygen in Seawater by Direct Spectrophotometry of Total Iodine, Mar. Chem., 41, 343-351, 1993.
Parsons, T. R., Maita, Y., and M., L. C.: A manual of chemical and biological methods for seawater analysis, Elsevier, New York, 1984.
Sampou, P. and Kemp, W. M.: Factors regulating plankton community respiration in Chesapeake Bay Mar Ecol-Prog Ser, 110, 249-258, 1994.
Sherr, E. B. and Sherr, B. F.: Temporal offset in oceanic production and respiration processes implied by seasonal changes in atmospheric oxygen: The role of heterotrophic microbes, Aquat Microb Ecol, 11, 91-100, 1996.
Shiah, F. K., Wu, T. H., Li, K. Y., Kao, S. J., Tseng, Y. F., Chung, J. L., and Jan, S.: Thermal effects on heterotrophic processes in a coastal ecosystem adjacent to a nuclear power plant, Mar Ecol-Prog Ser, 309, 55-65, 2006.
Smith, E. M. and Kemp, W. M.: Size structure and the production/respiration balance in a coastal plankton community, Limnol Oceanogr, 46, 473-485, 2001.
Tseng, Y. F., Hsu, T. C., Chen, Y. L., Kao, S. J., Wu, J. T., Lu, J. C., Lai, C. C., Kuo, H. Y., Lin, C. H., Yamamoto, Y., Xiao, T. A., and Shiah, F. K.: Typhoon effects on DOC dynamics in a phosphate-limited reservoir, Aquat Microb Ecol, 60, 247-260, 2010.
Tseng, Y. F., Lin, F. J., Chiang, K. P., Kao, S. J., and Shiah, F. K.: Potential impacts of N-2- fixing Trichodesmium on heterotrophic bacterioplankton turnover rates and organic carbon transfer efficiency in the subtropical oligotrophic ocean system, Terr Atmos Ocean Sci, 16,
361-376, 2005.
Table.1 Average, standard deviations, maximums, and minimums of measured parameters in Fei-tsui reservoir. All values are average of integration in euphotic zone.
Abbreviation:
Temp: temperature, O2Sat: dissolved oxygen saturation, NO2: Nitrite, NO3: Nitrate, PO4: phosphate, DOC: dissolved organic carbon, POC: particulate organic carbon, chl-a:
chlorophyll-a, BA: bacterial abundance, Cyano, cyanobacterial abundance, PP: primary production, CR: community respiration rate, BR: bacterial respiration rate, BR/CR: ratio of bacterial respiration to community respiration.
Item Unit Ave STD Max Min
Temp (oC) 23.48 3.83 30.50 17.05
O2Sat (%) 101.40 12.33 134.29 65.03
NO2 (M) 0.22 0.23 2.95 0.02
NO3 (M) 29.08 12.76 77.74 3.28
PO4 (M) 0.03 0.07 1.10 0.00
DOC (M) 81.37 35.87 255.13 12.09
POC (mgC/L) 257.90 108.79 710.02 8.96
chl-a (mg Chla/L) 2.79 1.36 11.13 0.28
BA 105 cells/ml 27.60 12.71 64.51 1.70
Cyano 105 cells/ml 1.85 0.84 5.69 0.03
PP mgC/m3/d 29.59 29.30 283.75 0.10
CR mgC/m3/d 55.49 30.47 175.96 7.29
BR mgC/m3/d 29.36 19.80 138.64 2.20
BR/CR 0.54 0.20 0.97 0.03
Euphotic zone
Table 2. Correlation matrix of all measured parameters
@ *: p<0.05, n.s. not significant, -: do not analysis.
Abbreviation:
Temp: temperature, O2Sat: dissolved oxygen saturation, NO2: Nitrite, NO3: Nitrate, PO4: phosphate, DOC: dissolved organic carbon, POC: particulate organic carbon, chl-a:
chlorophyll-a, BA: bacterial abundance, Cyano, cyanobacterial abundance, PP: primary production, CR: community respiration rate.
Temp O2Sat NO2 NO3 PO4 DOC POC chl-a BA Cyano PP CR Temp -
O2Sat 0.38* -
NO2 0.28* 0.275 -
NO3 -0.51* -0.20* -0.14* - PO4 n.s. n.s. n.s. n.s. -
DOC 0.23* 0.26* 0.32* -0.24* n.s. -
POC 0.65* 0.33* 0.29* -0.42* n.s. 0.17* - chl-a 0.40* 0.17* 0.17* -0.24* n.s. 0.18* 0.54* -
BA 0.63* 0.36* n.s. -0.40* n.s. 0.12* 0.57* 0.20* -
Cyano 0.30* n.s. n.s. -0.28* n.s. n.s. 0.48* 0.29* 0.49* -
PP 0.47* 0.10* n.s. -0.33* n.s. n.s. 0.56* 0.29* 0.50* 0.36* -
CR 0.67* 0.43* 0.36* -0.31* n.s. 0.28* 0.57* 0.42* 0.41* 0.27* 0.29* -
Figure 1. Study site, Fei-tsui reservoir, showing the dam site. Inset: location of study site (★) in Taiwan
Figure.2 Decadal variation of measured parameters. (A)Temperature (red line) and euphotic
Figure.2 (continued). Decadal variation of measured parameters. (F) DOC: dissolved organic carbon, (G) POC: particulate organic carbon, (H) Chl-a: Chlorophyll-a, (I) BA: bacterial
Figure.2 (continued). Decadal variation of measured parameters. (K) PP: Primary production, (L) CR: community respiration, (M) BR: bacterial respiration.
Figure 3. Box plot for monthly variation of CR. The bottom and top of the box are the first and third quartiles respectively. The line inside of box is median.
Figure 4. Relationship between of Temperature and CR. Bottom x-axis was temperature transfer to -1/kT eV presented by Kelvin scale. Up x-axis was presented by Celsius scale. Y-axis was natural logarithm scale of CR. Black line represented the linear regression result: ln(CR)=
35.23(±1.64) - 0.80(±0.04)/kT, R2= 0.48 p<0.05.
Figure 5. Relationship between of Temperature and SCR. Bottom x-axis was temperature transfer to -1/kT eV presented by Kelvin scale. Up x-axis was presented by Celsius scale. Y- axis was natural logarithm scale of SCR. Blue circle(●) represented data point in non-typhoon period. Red square (□) represented data point in typhoon period. Black line represented the linear regression result: ln(SCR)= 11.95(±2.26) - 0.34(±0.06)/kT, R2= 0.13, p<0.05.
Chapter 3.
Decadal variation of bacterial respiration
Abstract
With a ten-year weekly to biweekly data set taken from a P-limited subtropical reservoir, this study intends to explore the potential mechanisms in controlling the temporal variation of bacterial respiration rate (BR). Summer had high BR value and variation. Average of BR/CR ratio is 54%. The results showed that BR and specific bacterial respiration (SBR) correlated with temperature. Ea of BR is 0.93±0.06. and SPCR is 0.39. The results also indicated that temperature might be the major controlling factor for BR and SBR. Ea-BR is high than Ea-CR.
This result also indicate that BR was more sensitive than CR.
Introduction
Bacterioplankton (bacteria) is very important component of planktonic community.
Bacteria are most abundance organisms and occupied an important role in an ecosystem.
Bacterial activities including productivity (BP) and respiration-rate (BR) are also important processes for carbon cycling in an ecosystem. Bacteria converted dissolved organic carbon (DOC) to particulate organic carbon by BP and accumulated bacterial biomass (BB). Bacteria also can respire and release CO2. Bacterial respiration (BR) occupy a large part of CR. Previous studies showed that BR/CR ratio was more than 50% in most of ecosystem. In respiration study, BR is very important.
Pervious study showed that temperature is an important controlling factor of BR(A. Lopez- Urrutia & X. A. Moran, 2007). The Slope of Boltzmann–Arrhenius equation (activation energy, Ea) has been used as a sensitivity index of temperature response for BR. Specific bacterial respiration, which normalized BR by bacterial biomass (SBR) response to temperature is more accurate to represent characteristic of each other.
Bacterial have high individual activity in all ecosystem because of the smallest body size.
Bacteria community should have high sensitive when environment change.
This chapter is follow chpater2 to discussion BR variation in decade. We want to understand regulating factor of BR, and estimate Ea-BR.
Methods and materials
Study site and sampling
The Fei-tsui reservoir (121° 34’ E, 24° 54’ N) is located in northern Taiwan at an altitude of 300 m and has a basin area of 10.24 km2 (Chapter 2 Fig. 1). Weekly to biweekly sampling was conducted at the dam site (depth, ~100m) of the FT reservoir from January 2005 to December 2011. Water samples were collected manually from 7 depths (0, 2, 5, 10, 15, 20 and 30 m) via a 5 L Go-Flo bottle. Profiles of temperature were also recorded by a CTD (IDRONAUT Srl) simultaneously.
Chlorophyll-a concentration, Bacterial abundance, and cyanobacterial abundance Chlorophyll a (chl a) concentrations were determined from samples collected on a 25-mm GF/F (Watman, nominal pore size of 0.7 m) filter. Pigment on the filter was extracted using acetone then determined using an in vitro fluorometer (Turner Designs 10-AU-005) (Parsons et al., 1984). A average carbon conversion factor of 52.9 mgC (mgChl-a)-1 in phytoplankton cell has been chosen for further calculation (C. C. Chen et al., 2006).
Bacterial abundance (BA) and cyanobacterial abundance (Cyano) was counted by flow cytometry. Bacterial biomass (BB) and Cyanobacterial biomass were calculated using a conversion factor of 2 x 10-14 gC cell-1, and 2 x 10-13 gC cell-1 (Lancelot & Billen, 1984).
Primary production and Dissolved organic carbon
The Primary production was measured by the 14C assimilation method(Parsons et al., 1984). The water samples were incubated under an artificial light source, which maximum luminosity is 2000 mE m-2 s-1 , for 2 h with light density filters (ARRI filters, ARRI GB Ltd, Heston, Middlesex , UK, 0, 6, 12, 16, 23, 36, 44, 63 and 91%), then filtered. To remove excess H14CO3-1 , 0.1 N hydrochloric acid (HCl) was added, and the sample was left at room temperature for 24 h. A treatment with LSC-cocktail liquid (Ultima Cold, Packard BioScience
BV, Groningen, Netherlands) was applied for an additional 24 h. A liquid scintillation analyser (Tri-Carb 2900TR, PerkinElmer, Waltham, MA, USA) was then used to count biological radioactivity, which was then expressed as the primary production per unit time.
We fixed PB-I curve with PP per unit time. To estimate PP in sample day, PB-I curve model was fitted by chl-a concentration, the daily solar radiation in and water transmittancy in euphotic zone. (Ko et al., 2016; Tseng et al., 2010)
Samples for DOC measurement were filtered through pre-combusted (500°C) GF/F filters and then filled into pre-combusted 40 ml vials. After the addition of several drops of 80% H3PO4, vials were sealed with pre-combusted aluminum foil and screw caps with Teflon-coated septa. Before analysis, samples were acidified with 80% H3PO4 and sparged with CO2- free O2 at a flow rate of 350 ml min–1 for at least 10 min. Samples were analyzed by high temperature catalytic oxidation method using a Shimadzu TOC 5000 (Tseng et al., 2010).
Bacterial respiration and Specific community respiration
Bacterial respiration rates (BR) were measured as dissolved oxygen (O2) change from the initial in dark incubation. For sampling limitation, BR measurements only were taken from 2, 10, 15 and 30 m.
To remove large size plankton, the treatment samples of BR were filtered with 3 m polycarbonate filter. The whole water incubation was categorized as CR. Briefly, water samples were siphoned into 350 mL biological oxygen demand (BOD) bottles with opaque plastic film coating. Incubation was performed at in situ temperature for 24 or 48 (when in situ temperature < 20℃) hour. Concentration of O2 was measured by a direct spectrophotometry
Giorgio & Williams, 2005; Kirchman, 2010).
Specific bacterial respiration (SBR) is calculated by BR divided by bacterial biomass(BB).
Data analysis
In this study, all measured variables for data analysis were used the depth-average values within the euphotic zone (1% surface light penetrated), which were obtained by dividing depth- integrated (trapezoidal method) values. Statistical analysis including linear regression and Pearson t-test were conducted with Matlab statistical toolbox (Matlab R2010a). Linear regression was used to get relationship of temperature of CR. Pearson t-test was used to test correlation of all measurement parameters.
Result
BR variation is similar to PCR. BR had high value and large variation in warm season (Fig 1). Comparing to PCR, BR have higher variation in warm season. The relationship between temperature and BR is positive. Ea is 0.93 ±0.06, which value is higher than PCR (Fig2). Because high Ea means increase more when temperature increase. We expect that BR would increase more in warm season. However, BR/CR ratio did not show any pattern and large variation in every month.
Specific bacterial respiration (SBR) correlate to temperature positively.(Fig 3) The relationship is not significant different between all data and data removing typhoon effect.
Thus. The regression analysis include all data in figure 3. Ea-SBR is 0.39. There is not significantly different from Ea-SPCR.
Discussion
BR correlated to temperature and other biological factors, and variation is similar to PCR, which implied that BR is important component of PCR. High Ea of BR should represent the BR/CR ratio high in warm season. However, BR/CR did not correlated to temperature and did not show any seasonal pattern. Mean of BR/CR in all data is 0.54. It can say that BR occupy about 54% of CR. this value is very close to average previous studies.
The temperature response of SBR and SPCR are similar. Ea-CR(0.40) and Ea-BR (0.39) are not significantly different in individual level. It might be individually metabolic rate of bacteria is very similar to other community components. However, Ea-BR is higher than Ea- CR, which can be implied bacterial community have better response to variation of
environmental condition.
This chapter reveal that temperature is important regulation factor of BR. It also controlling bacterial physiology reaction.
Reference
Chen, C. C., Chiang, K. P., Gong, G. C., Shiah, F. K., Tseng, C. M., and Liu, K. K.:
Importance of planktonic community respiration on the carbon balance of the East China Sea in summer, Global Biogeochem Cy, 20, -, 2006.
Del Giorgio, P. A. and Williams, P. J. l. B.: Respiration in aquatic ecosystems, Oxford University Press, USA, 2005.
Kirchman, D. L.: Microbial ecology of the oceans, John Wiley & Sons, 2010.
Ko, C.-Y., Lai, C.-C., Chen, T.-Y., Hsu, H.-H., and Shiah, F.-K.: Typhoon effects on phytoplankton responses in a semi-closed freshwater ecosystem, Marine and Freshwater Research, 67, 546-555, 2016.
Lancelot, C. and Billen, G.: Activity of heterotrophic bacteria and its coupling to primary production during the spring phytoplankton bloom in the southern bight of the North Sea, Limnol Oceanogr, 29, 721-730, 1984.
Lopez-Urrutia, A. and Moran, X. A.: Resource limitation of bacterial production distorts the temperature dependence of oceanic carbon cycling, Ecology, 88, 817-822, 2007.
Pai, S. C., Gong, G. C., and Liu, K. K.: Determination of Dissolved-Oxygen in Seawater by Direct Spectrophotometry of Total Iodine, Mar. Chem., 41, 343-351, 1993.
Parsons, T. R., Maita, Y., and M., L. C.: A manual of chemical and biological methods for seawater analysis, Elsevier, New York, 1984.
Tseng, Y. F., Hsu, T. C., Chen, Y. L., Kao, S. J., Wu, J. T., Lu, J. C., Lai, C. C., Kuo, H. Y., Lin, C. H., Yamamoto, Y., Xiao, T. A., and Shiah, F. K.: Typhoon effects on DOC dynamics in a phosphate-limited reservoir, Aquat Microb Ecol, 60, 247-260, 2010.
@ *: p<0.05, n.s. not significant, -: do not analysis.
Abbreviation:
Temp: temperature, O2Sat: dissolved oxygen saturation, NO2: Nitrite, NO3: Nitrate, PO4: phosphate, DOC: dissolved organic carbon, chl-a: chlorophyll-a, BA: bacterial abundance, Cyano, cyanobacterial abundance, PP: primary production, CR: community respiration rate, BR: bacterial respiration rate.
Temp O2Sat NO2 NO3 PO4 DOC chl-a BA Cyano PP CR BR Temp -
O2Sat 0.38* -
NO2 0.28* 0.275 -
NO3 -0.51* -0.20* -0.14* - PO4 n.s. n.s. n.s. n.s. -
DOC 0.23* 0.26* 0.32* -0.24* n.s. -
chl-a 0.40* 0.17* 0.17* -0.24* n.s. 0.18* -
BA 0.63* 0.36* n.s. -0.40* n.s. 0.12* 0.20* -
Cyano 0.30* n.s. n.s. -0.28* n.s. n.s. 0.29* 0.49* -
PP 0.47* 0.10* n.s. -0.33* n.s. n.s. 0.29* 0.50* 0.36* -
CR 0.67* 0.43* 0.36* -0.31* n.s. 0.28* 0.42* 0.41* 0.27* 0.29* - BR 0.62* 0.28* 0.33* -0.47* n.s. 0.18* 0.38* 0.54* 0.28* 0.36* 0.73* -
Figure 6. Box plot for monthly variation of (A) BR and (B)BR/CR ratio. The bottom and top of the box are the first and third quartiles respectively. The line inside of box is median.
Figure 7. Relationship between of Temperature and BR. Bottom x-axis was temperature transfer to -1/kT eV presented by Kelvin scale. Up x-axis was presented by Celsius scale. Y-axis was natural logarithm scale of BR. Black line represented the linear regression result: ln(BR)=
39.72(±2.22) – 0.93(±0.06)/kT, R2= 0.44, p<0.05.
Figure 8. Relationship between of Temperature and SBR. Bottom x-axis was temperature transfer to -1/kT eV presented by Kelvin scale. Up x-axis was presented by Celsius scale. Y- axis was natural logarithm scale of SBR. Blue circle(●) represented data point in non-typhoon period. Red square (□) represented data point in typhoon period. Black line represented the linear regression result: ln(SBR)= 14.49(±2.45) - 0.39(±0.06)/kT, n=309, R2= 0.09 p<0.05.
Chapter 4.
Temperature manipulation of community respiration and
bacterial respiration
Abstract
Temperature manipulation experiment provide a situation to estimate temperature effect in wilder range. However, the most common characteristic of temperature response, activation energy (Ea), might be more variation. Our result combined two years temperature manipulation, the result proved that BR is more sensitive than CR either short-term temperature change (CR:0.69 and BR: 1.07) or long-term seasonal variation(CR: 0.67 ± 0.05 and BR:0.94 ± 0.08).
Temperature change would increase system unstability. Two years result comparison showed that environmental condition would affect result warming.
Introduction
Plankton community respiration (CR) is an important biological process, which is conversion of organic carbon to inorganic carbon, which is the most important greenhouse gas, CO2. Activation energy (Ea) can represent to sensitivity of respiration rate to Boltzmann- Arrhenius model. In recent decade, researches about Ea- CR became more and more popular because Boltzmann-Arrhenius model proved a simple method for prediction the warming effect.
G. Yvon-Durocher et al. (2012) combine nine different types of ecosystem and modified temperature to remove data bias in difference of temperature range. Their study supposed that Ea was close to 0.62 eV in all kind of ecosystems and there is no significant different between type ecosystem. However, there are more and more studies argue their point. B. Chen and Liu (2015) claimed that there is no significant different of Ea between autotrophic and heterotrophic. But there are large variation of Ea of CR in their result.
Vaquer-Sunyer et al. (2015) showed that Ea would change in their temperature warming experiment. Pawar, Dell, Savage, and Knies (2016) combined data on 1085 thermal responses from a wide range of traits and organisms and found that Ea would change when ambient temperature change. They also claim that Ea variation toward high mean, median, variance, and skewness with combination of wilder temperature range. Thus if we want to predict warming effect by Boltzmann-Arrhenius model, it should be more carefully.
Bacterial respiration (BR) usually contributes about half of CR in most of ecosystems.
Bacteria have high individual metabolic rate and more temperature sensitivity because of their body size. However, there is not enough evidence to prove that whether Ea-BR is higher than Ea-CR in the same ecosystem.
In traditional study, temperature manipulation is a simply method to test thermal effect.
Furthermore, the result of characteristic of temperature response can be used to predict the warming effect. However, temperature manipulation result had risk of increasing bias of Ea if incubation temperature over optimal temperature(Pawar et al., 2016).
In this chapter, we want to understand that whether change temperature (warming and cooling incubation temperature) can change Ea and BR is more sensitive than CR. In addition, we want to know whether Ea is similar in different time scale. Long-term scale of Ea was estimate by pervious chapter result and combine all data point in the experiment. Short-term scale Ea was gained by regression by temperature and every experiment result. We supposed that 1) Ea-BR is higher than Ea-CR. 2) Ea-CR and Ea-BR are different between long-term and short-term scale.
Materials and methods
Sampling and respiration rate measurement
We took water sample from 2-meter depth in Fei-tusi reservoir dam site station from 2006/ 5/ 30 to 2008 /4/13 weekly or biweekly. Whole water sample was took into 20-liters tank and send to laboratory in 2 hours. Then respiration experiments are deal with by next step.
Respiration rate was measured by decreasing of dissolved oxygen. Incubation time was 24 hours, but it was 48 hours when water temperature lower than 20℃.
Plankton community respiration (CR) was measured by un-filtered water incubation, and bacterial respiration (BR) was measured by filtered water with 1.2 m filter.
Temperature manipulation
There are 3 treatments in every experiment: in situ (2m ambient temperature), high temperature (increase 10 ℃) and low temperature (decrease 5~10℃). Every treatment include duplicate of PCR and BR set.
In low temperature treatment, CR and BR were difficult to measure in decreasing 10℃
incubation. For getting low temperature data, we decrease only incubation 5℃. In high temperature treatment, CR would decrease when temperature over 36℃. It seem like system
had changed or broken by overheating during incubation period. Avoiding unreasonable environment temperature disturb result. Our result analysis only used temperature interval between 13~36 ℃.
Short-term scale of Ea was estimate with linear regression of three data point in different temperature treatment in every temperature manipulation experimental (Fig. 1). Then we
calculate mean Ea of CR and BR.
Long-term scale of Ea was estimated by combination of all treatments data.
Data analysis
Linear ordinary least squares regression was used to estimate relationship between temperature and respiration rate, and stand deviation of parameters were estimated with bootstrap method resampling 1000 times. Correlation test was used by person-test . All statistic analyses were calculated by matlab statistic tool box.