國立臺灣大學理學院海洋研究所 碩士論文
Graduate Institute of Oceanography College of Science
National Taiwan University Master Thesis
利用魚類行為
─
物理洋流耦合模型探討聖嬰現象對於日本鯷在東海產卵洄游之影響
Investigating ENSO effects on the spawning migration of Japanese anchovy in the East China Sea using a
behavior-hydrodynamic model 楊捷旭
Chieh-Hsu Yang
指導教授:謝志豪 博士
陳世楠 博士 Advisor: Chih-hao Hsieh, Ph.D.
Shih-Nan Chen, Ph.D
中華民國 104 年 8 月 August, 2015
i
Abstract
Mature individuals of Japanese anchovy (Engraulis japonicus) migrate from the
East China Sea to the coastal water of northern Taiwan to spawn during winter. The
anchovy larvae then form an important fishery resource for Taiwan. Previous studies
indicate that the interannual variation of anchovy larvae catch per unit effort data
exhibited a negative correlation with ENSO; however, the detail underlying
mechanism explaining how ENSO affects ocean currents or environmental conditions,
which in turn determine the fluctuations of anchovy larvae, remains unclear. To bridge
the knowledge gap, we construct historical circulation patterns in the East China Sea
and the Taiwan Strait by hydrodynamic models, and use individual-based model to
represent fish behavior for simulating the migration process of Japanese anchovy.
Comparing model results under various ENSO states (strong El Niño (La Niña) and
moderate El Niño (La Niña) states), we find that the fluxes of Japanese anchovy
populations toward Taiwan is positively correlated with the strength of China Coastal
Current, which is driven by the East Asian Winter Monsoon. Specifically, in El Niño
(La Niña) states, the East Asian Winter Monsoon decreases (increases) in boreal
winter and weakens (strengthens) the China Coastal Current and in turn decreases
(increases) the fluxes of Japanese anchovy populations migrating toward the coastal
water of Taiwan. The connection between the ENSO, East Asian Winter Monsoon,
ii
China Coastal Current, and spawning migration of Japanese anchovy suggests that
large-scale environmental changes may affect reproductive biology of species through
meso-scale physical environmental factors. The results also indicate that the dynamics
of migration processes should be considered in fishery managements.
Keywords
ENSO, East Asian Winter Monsoon, China Coastal Current, Japanese anchovy, migration process, fish behavior-hydrodynamic model, hydrodynamic model, individual-based model
iii
中文摘要
每年冬春之交,攝食區域位於中國東海的日本鯷成魚會洄游至位於台灣沿海
的產卵場,其仔稚魚(魩仔魚)則會成為台灣沿海漁業的重要標的之一。過去研
究顯示日本鯷仔稚魚的單位努力漁獲量(Catch-per-unit effort)的年間變異與聖
嬰-南方震盪現象(El Niño-Southern Oscillation, ENSO)有著負相關性;然而對
於 ENSO 如何影響洋流等物裡環境進而影響魩仔魚的再補充量的詳細機制,目
前仍不清楚。為了釐清此問題,本研究利用物裡洋流模型(hydrodynamic model)
模 擬 過 往 年 份 的 中 國 東 海 及 台 灣 海 峽 的 冬 季 流 場 , 同 時 利 用 個 體 模 型
(Individual-based model)來模擬日本鯷成魚的的洄游行為並記錄其在模擬流場
中的洄游過程。比較不同 ENSO 強度下的模擬結果,顯示到達台灣沿海海域的
成魚數量與被東北季風驅動的中國沿岸流(China Coastal Current)強度呈現正相
關。當強度越大的聖嬰(反聖嬰)現象發生時,東北季風減弱(增強)的情形也越明
顯,進而影響中國沿岸流使之減弱(增強),最終導致到達台灣海域的日本鯷成魚
數量減少(增加)。ENSO、東北季風、中國沿岸流以及日本鯷的生殖洄游行為之
間的關聯顯示了大尺度的環境變異可能藉由影響中尺度的環境物理因子傳遞至
海洋生物進而影響其生殖行為。結果顯示,考慮洄游物種的漁業政策時,洄游過
程所造成的影響不可忽略。
關鍵字
聖嬰-南方震盪現象、東北季風、中國沿岸流、日本鯷、洄游行為、魚類行為─
物理洋流耦合模型、物裡洋流模型、基於個體模型
iv
Contents
Abstract... i
中文摘要... iii
Contents... iv
Image Contents... v
Introduction... 1
Materials . Methods... 6
Historical data analysis... 6
Model description... 6
A. Hydrodynamic model... 7
B. Biological model... 8
Sensitivity analyses... 10
Results... 11
The simulation results of physical models... 11
The simulation results of biological models... 14
Discussion... 17
Conclusion... 25
Reference... 26
v
Table of Figures
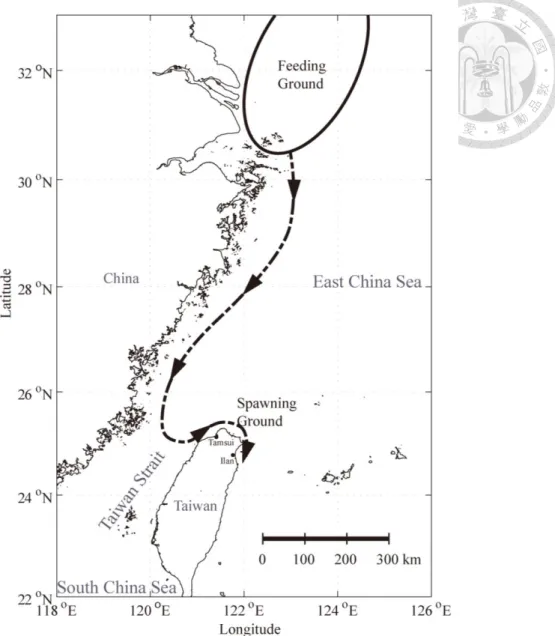
Figure 1. Hypothetical spawning migration route of Japanese anchovy... 31
Figure 2. The historical data of ONI, wind velocity, and the CCC... 32
Figure 3. Model results of near-surface current velocity in the East China Sea... 33
Figure 4. Model results of near-surface salinity distribution in the East China Sea.. 36
Figure 5. Sea surface temperature in the East China Sea... 37
Figure 6. Model results of the velocity and the direction of the current in the coastal area of Mainland China... 38
Figure 7. The general circulation pattern in the hydrodynamic model in Winter... 39
Figure 8. Near-surface current velocity and SST in the Taiwan Strait... 40
Figure 9. The "U" shape current in the central of Taiwan Strait... 41
Figure 10. Variation in final destinations of the tracers in the end of simulations... 42
Figure 11. The historical data of ONI, Averaged meridional wind velocity, and the simulation results of CCC... 43
Figure 12. The tracer trajectories... 44
Figure 13. The tracer trajectories with different initial locations... 47
Figure 14. Summary statistics of simulations with different initial days... 48
Figure 15. The tracer trajectories from different modeling scenarios... 49
Figure 16. The current along with the northern coastal of Taiwan... 50
1
Introduction
In the East China Sea (ECS), marine populations are known to be affected by
climate (Kim et al. 2005). Among those, Japanese anchovy (Engraulis japonicus)
plays an important role in food web (Bakun and Parrish 1991) and represents an
important fishery (Young and Chiu 1994, Chiu et al. 1997). The recruitment of
population of Japanese anchovy is correlated with the Southern Oscillation Index
(SOI) (Tsai et al. 1998, Hsieh et al. 2009). The study by Tsai et al. (1998) emphasized
that there was a significant correlation between the catch per unit effort (CPUE) of
Japanese anchovy and local SST, and the CPUE was also correlated with SOI through
SST, suggesting that ENSO may affect the recruitment of Japanese anchovy through
the meteorological conditions that influence coastal upwelling. However, a study
using longer time series revealed that the correlation between the CPUE and SST was
transient (Hsieh et al. 2009). This study pointed out that previous studies
over-emphasized the importance of local hydrographic effects on the anchovy
populations (Lee et al. 1995, Lee and Lee 1996, Hsia et al. 2004), and the climatic
factors such as ENSO should be examined (Hsieh et al. 2009). Notably, their study
suggested that the abundance fluctuations of Japanese anchovy might be affected by
ENSO through modulating the circulation pattern in the ECS, which in turn affects the
migration process of Japanese anchovy.
2
Japanese anchovy is an oceanodromous species (Chiu et al. 2002), so that the
recruitment of Japanese anchovy is profoundly affected by the success in the
spawning migration (Cushing 1975). Japanese anchovy is a widespread pelagic
species mainly distributed in the northwestern Pacific Ocean, including the Sea of
Japan, Yellow Sea, and ECS (Iversen et al. 1993), and larval anchovies are important
target in the commercial fisheries in the coastal waters of Taiwan (Young and Chiu
1994, Chiu et al. 1997). It is known that fishing grounds are located at the coastal
water of northern Taiwan (e.g. Ilan Bay) in March to May. Genetic analysis suggested
that the feeding ground of the Japanese anchovy stock is located in the ECS (Yu et al.
2002). It is believed that some anchovies start their spawning migration from the ECS
in winter and arrive at the coastal water of Taiwan for spawning in Spring (Fig. 1).
After spawning, the larvae are caught, and surviving indivduals undertake the feeding
migration back to their feeding ground in the ECS to start the next round of life cycle
(Chen and Chiu 2003). Spawning migration is a pre-spawning event and is important
for recruitment. More specifically, a higher survival rate of parental fish stock after
migration would lead to higher egg production (Rothschild and Fogarty 1989, Opdal
et al. 2011). Considering the fluctuaction of larva recruitment of Japanese anchovy,
the effects of spawning migration cannot be ignored.
The model results by Tu et al. (2012) indicated that the strength of CCC aids the
3
spawning migration of Japanese anchovy. It is evidenced that the adult anchovies
follow the CCC to arrive the Taiwan Strait (TS). The acoustic survey also showed the
distribution of Japanese anchovy was extended to the TS along the coastal Mainland
China in the ECS in March, 1985-1990 (Iversen et al. 1993). In the simulations (Tu et
al. 2012), the authors manipulated the riverplume of the Changjiang to regulate the
strength of CCC in a climatology circulation model. In their results, the adult
anchovies moved southward with the CCC, and anchovies arrived at their feeding
ground more easily in the simulation which had the stronger CCC, indicating that the
CCC may play an important role in the spawning migration of Japanese anchovy.
The CCC is mainly driven by the East Asian Winter Monsoon (EAWM) and
enhenced by the Changjiang outflow (Lee and Chao 2003), and the EAWM had been
found highly correlated with El Niño-Southern Oscillation (ENSO) (Zhang et al.
1997). The CCC is a southward coastal jet which develops along the east coast of
Mainland China in fall and winter (Chao 1990). The CCC occurs in October, one
month after the begin of EAWM, and it peaks in December but diminishes in March,
when the winter monsoon is replaced by the southerly summer monsoon (Lee and
Chao 2003, Isobe 2008). The East Asian Monsoon is one of most energetic monsoon
circulation systems and dominates the local weather in the East Asian region (Chang
and Lau 1982), and it shows the reversal of winds in summer and winter. The East
4
Asian Monsoon is affected by ENSO through a Pacific–East Asian teleconnection.
The lower-tropospheric anticyclone/cyclone shifting system located in the western
North Pacific is the key to bridge ENSO in the eastern Pacific and the EAWM (Wang
et al. 2000). The warm ENSO events occur in boreal winter are often accompanied
with a weaker EAWM, and vice versa (Tornita and Yasunari 1996, Zhang et al. 1997).
According to previous studies, ENSO had a significant negative correlation with
the CPUE of Japanese Anchovy (Hsieh et al. 2009). In our research, we hypothesize
the mechanism that ENSO influences the abundance of Japanese anchovy is linked by
the meso-scale physicl factors: First, the ENSOs affect the strength of EAWM.
Second, the strength EAWM determines the southward velocity and the extension of
CCC. As a consequence, the CCC influences the success rate that adult anchovies
arrive at the coastal water of northern Taiwan, owing to the successful migration of
Japanese anchovy aided by the CCC.
To test the hypothesis, we use a coupled biological–physical model, and it is
necessary to establish the past realistic circulation in our hydrodynamic model.
Numerous studies showed that biological–physical model becomes a valuable and
important tool to study dispersal and migration of marine organisms with the
advances in computation and hydrodynamic modeling (Capella et al. 1992, Rose 1993,
Cowen et al. 2006). Moreover, previous research showed that using
5
biological–physical model is convenience to compare differences of transport and
distribution pattern due to climate change (e.g. The spawning grounds of Japanese
sardine were predicted to shift towards more north areas due to global warming
(Okunishi et al. 2012)). Correlation between the Japanese anchovy and the circulation
in the ECS has been demonstrated by simulation models that driven by the
climatology data and scenario tests (Tu et al. 2012). However, to compare the
differences of migration of Japanese anchovy in various ENSO years requires
simulating historical circulation.
Here, we use the historical data for surface wind velocity over the ECS and the
circulation information of ECS to reconstruct the past circulation in the ECS, and then
simulate the migration process of Japanese anchovy in our hydrodynamic models.
Comparing the results of different ENSO states may improve our understandings of
ENSO effects on the recruitment of Japanese anchovy, and provide advices for fishery
managements.
6
Materials and Methods
Historical data analysis
In this study, we used Oceanic Niño Index (ONI) as an indicator for ENSO states
(i.e. El Niño and La Niña events). In our study, the definition for the range of CCC
from north to south is between 31°N and 25.5°N, which is the region from the
Changjiang estuary to the northern boundary of the TS. The zonal width of CCC
concludes 10 kilometers from the China coastline.
A consistent relationship has been found in the historical data of ONI, the
EAWM and the CCC in 2003 - 2013 (Figs. 2a-c). The linear correlation coefficient
between the ONI and the EAWM is 0.6548 (p-value= 0.0288), and between the
monsoon and the CCC is 0.6831 (p-value= 0.0205). These results indicate that the
strength of EAWM decreased during the El Niño phase, and the strength of CCC can
be affected by the EAWM.
Model description
The simulation region is between 24°N-33°N and 119°W-124°W, which contains
most part of the ECS and the TS. The years chosen for simulation include two strong
EL Niño years (i.e. 2003, 2010), two strong La Niña years (i.e. 2008, 2011), a
moderate EL Niño year (i.e. 2007) and a moderate La Niña year (i.e. 2012). The
7
models contain two parts: physical model (i.e. hydrodynamic model) and biological
model (i.e. migration process of Japanese anchovy). The whole model is
hierarchically constructed. The hydrodynamic sub-model is built first, and then the
biological sub-model is coupled to the results of the physical models (Willis 2011).
The simulation of physical model for each year starts from the December 1st of the
previous year and end in March. The simulation period for the biological models
starts from the January 1st and lasts for 60 days. This decision is based on the larval
anchovy fishery. According to the fishery survey, the maximum CPUE lays in March, and the larvae’s age is about 15–30 days old (Chiu and Chen 2001), meaning that the
adult anchovies must arrive at the spawning ground before March.
A. Hydrodynamic model
The physical model in this study is configured with the Regional Ocean
Modeling System (ROMS), which is a hydrostatic, primitive-equation model with a
free surface, terrain-following vertical coordinate (Haidvogel et al. 2000,
Marchesiello et al. 2003). The past study (Shchepetkin and McWilliams 2005)
described the detail about the algorithms of ROMS. For the ECS and TS region the
domain extends from 24°N-33°N and from 119°W-124°W with a horizontal
resolution of 1/50° and includes 20 vertical levels (terrain-following curvilinear
coordinates). The initial condition and the boundary condition are determined using
8
the data from the Hybrid Coordinate Ocean Model (HYCOM) website
(http://hycom.org). The driving forces include surface wind stress from the European
Centre for Medium-Range Weather Forecasts (ECMWF) website
(http://www.ecmwf.int/) and the constant Changjiang outflow. For focusing on the
effect of EAWM affecting the CCC, the Changjiang runoff in the models is set as the
annual average inflow: 0.029 Sv (Zhang et al. 1990).
B. Biological model
The biological model in this study describes the migration process of Japanese
anchovy. The model is based on Lagrangian framework to record the particles
location and movement, and it is coupled with the individual-based model to describe
the swimming behaviors of adult anchovies in the migration.
The behavior model basically follows (Tu et al. 2012). The behavior model
contains two parts: swimming speed and the local orientation patterns. The swimming
speed is always constant at 30 cm/s, and the anchovies are oriented by current
velocity (Eqn. 1) or temperature gradient (eqns. 2-3).
V = 30 cm/s (1)
𝑢𝑆1 = 𝑉 × 𝑢𝑐
√𝑢𝑐2+𝑣𝑐2 𝑣𝑆1 = 𝑉 × 𝑣𝑐
√𝑢𝑐2+𝑣𝑐2 (2)
𝛻𝑇 =𝜕𝑇𝜕𝑥𝑖 +𝜕𝑇𝜕𝑦𝑗 (3(a))
𝐺𝑀 = √(𝜕𝑇/𝜕𝑥)2+ (𝜕𝑇/𝜕𝑦)2 (3(b))
9
𝑢𝑆2 = 𝑉 ×(𝜕𝑇/𝜕𝑥)𝐺𝑀 𝑖 𝑣𝑆2 = 𝑉 ×(𝜕𝑇/𝜕𝑥)𝐺𝑀 𝑗 (3(c))
V is the magnitude of fish swimming velocity; uc, vc are the velocity of the
current; us, vs separately represent x, y component of fish swimming velocity, and T is
temperature. These equations represent the swimming speed and different strategies in
determination of migration orientation. Here, Eqn.2 assumes that fish change their
migration direction follow the current, and Eqn.3 supposes that the orientation of
migration is mainly determined by temperature. Many simulation studies also indicate
that temperature play an important role to determine the migration direction in
Japanese anchovy (Wang et al. 2013) and similar species, Japanese sardine (Okunishi
et al. 2009). We assumed that anchovies swim in optimal cruise speed equivalent to a
unit body length per second (Weihs 1973). The swimming behavior in Eqn.3 indicates
the fish head to local maximum temperature. For this behavior, we assumed that fish
have ability to find the optimal temperature for spawning (Takasuka et al. 2005).
The orientation of adult anchovies in this study is ruled by three equations:
Adult anchovies swim along with the current (Eqn. 2) after the beginning of the
migration, but change their behavior to follow the temperature gradient to the local
maximum temperature (Eqns.3a-c) when they sense the optimal temperature for
spawning. In our study, we set the threshold temperature for adult anchovies to
change their orientation rules to be 24°C.
10
Sensitivity analyses
Considering fluctuations in the initial conditions of spawning migration of
Japanese anchovy, the sensitivity analyses of biological model include two
components: initial locations and starting dates. In the sensitivity test of initial
locations, the tracers are released at 30°N and 32°N, which are the northernmost and
southernmost distribution of anchovies in the January in the ECS according to the
acoustic surveys (Iversen et al. 1993). In the sensitivity test of starting dates, the start
location are the same (31°N) but the tracers are released at January 5th in each years,
which is 5-day delay compared to the original simulation. The tracers with final
location south of 24.7°N, north of 25.7°N, and between 120.8 and 121.8°E are
considered as close to Taiwan enough to find the suitable spawning ground.
11
Results
The simulation results of physical models
The physical models represent the hydrographic characteristics in the ECS and
revealed the interannual variation. The CCC can be observed in all simulation results,
and the source of jet starts from the Changjiang mouth and is formed by the
Changjiang Diluted Water (Figs. 3a-f). The Changjiang Diluted Water with low
salinity forms the strong density gradient when it enters the ECS (Figs. 4a-f). The
Changjiang Diluted Water turns right and forms a southward jet called the CCC. The
CCC causes a intrusion of cold water into warmer sea area in the models, and the
same phenomenon can be observed in the satellite data (Lee and Chao 2003, Chang et
al. 2006). According to the 2 months (i.e. January and February) average of near
surface sea temperature (1-5m) and circulation velocity (Figs. 3a-f, 5a-f), the strength
and the range of CCC exhibited interannual variation in simulation results. The CCC
extended more in meridional way in strong La Niña years (i.e. 2008, 2011), and the
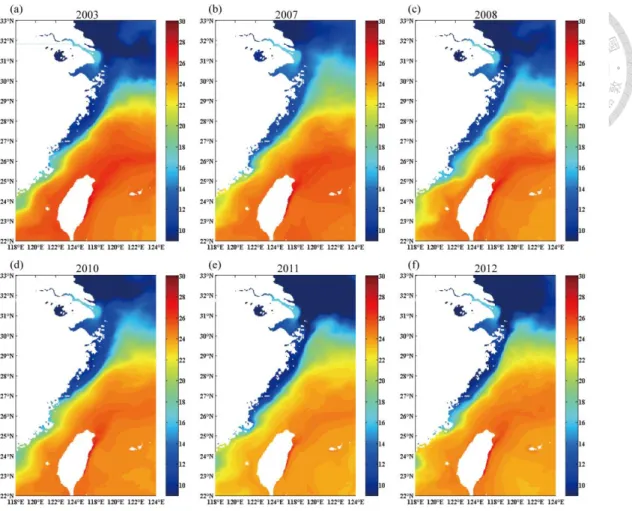
strength of CCC decreased in El Niño years (i.e. 2003, 2007) (Figs. 3a-f, 5a-f).
Furthermore, in El Niño years, the CCC may even disappear (Figs. 6a-f).
The patterns and features of currents in the Taiwan Strait (TS) are highly
consistent with previous observations (Lin et al. 2005) and the numerical study for the
general current patterns (Wu et al. 2007). The TS is under the influences of the three
12
currents (Fig. 7) modulated by the strength of monsoon and ENSO states (Shang et al.
2005). In the model results, the surface circulations are composed by the CCC, the
extension of South China Sea Warm Current (SCSWC) and Kuroshio Branch Current
(KBC) in winter (Figs. 8a-f). The CCC intrudes from the north along the coast of
Mainland China in the western TS, and the CCC sometimes forms a branch flowing
into the central TS and makes a "U" turn northeastward due to the blocking of the
Changyun Rise (Fig. 9). The "U" form branch is also observed in satellite images (Li
et al. 2006, Chang et al. 2009). A branch of the KBC passes the Penghu Channel and
flow northeastward along the western coast of Taiwan, and usually forms an
anticyclonic meander upper the Changyun Rise to bypass the shallow area.
Sometimes the current has a branch bypasses the western of Penghu Island and flow
into the central TS. In our study, we call this branch current, KBETC, and it occupies
the eastern TS during the most of time. The extension of South China Sea Warm
Current (SCSWC) offers the northward current in the western and central TS. Besides,
an anticyclonic eddy may occur in the northwestern area of Changyun Rise in the
central TS sometimes (Fig. 9). The general circulation in the study shows agreement
with the review paper (Hu et al. 2010), but the currents may extend, diminish or even
disappear in the TS.
According to these results, the differences of circulation patterns between El
13
Niño years and La Niña years are caused by the fluctuation in strength of EAWM
which is affected by ENSO. The EAWM strength is highly correlated with ENSO
(Figs. 2a-b), and there is good correlation between the strength of EAWM and CCC in
the model results (r= 0.953, p-value= 0.0032) (Fig. 11b-c). Meanwhile, comparing the
dynamics of the EAWM and the circulations in the ECS and TS suggests that the
EAWM not only strengthens and extends the CCC, but also suppress the northward
flux in the TS. The southward water velocity increases as the EAWM increases, and
the CCC also intrudes into the TS due to the strengthened EAWM. The KBETC is
suppressed by EAWM and is blocked at the south of the Changyun Rise, and most
influx from the Kuroshio Current follows the SCSKB. Also, when EAWM is strong,
the diminishment of SCSWC in the western TS can be observed frequently. In
contrast, when the EAWM is weak, the CCC stops at the northern TS, and the
SCSWC and KBETC dominate the TS. Concluding the monsoon effects on the
circulations, northward currents almost dominate the whole TS in El Niño states,
while the intrusion of CCC is limited only to the northern TS. In contrast, the SST is
lower and the northward flux decreased in the TS in La Niña years (Figs. 8a-f), which
is consistent with the past study (Kuo and Ho 2004). In La Niña years, the CCC and
the extension of SCSWC show antagonistic relationship in the western TS, which
means the extension of CCC causes the diminishment of SCSWC in the western TS.
14
Besides, the branch of CCC forming a northeastward "U" shape turn also occurs more
frequently in the La Niña years. In El Niño years, the northward currents almost
dominate the whole TS, while the intrusion of CCC is limited only to the northern TS.
The simulation results of biological models
The tracer trajectories indicate the migration routes of Japanese anchovy,
conforming to the speculation and model results from past studies (Yu et al. 2005, Tu
et al. 2012). More importantly, the results of this study show increasing trend in the
fluxes of Japanese anchovy populations in La Niña years (Figs. 10, 12a-f). Except the
results in year 2010 and 2012, most tracers move southwestward along the coast of
Mainland China, meaning that the moving direction of the tracers is the same as the
CCC. However in 2010 and 2012, only about half of the tracers follow the direction
of the CCC, and only the tracers starting at the nearshore area can catch the CCC.
Almost all tracers that follow the CCC can reach the northern coastal area of Pingtan
Island (i.e. part of Fujian Province), but some of them in year 2003 and 2010 (i.e.
strong El Niño years) cannot enter the TS due to their slow movement, making them
unable to bypass the Pingtan Island during the spawning season. Beside the
abundance, the timing that adult anchovies enter into the TS (Figs. 12a-f) show
difference in the El Niño and La Niña years. The tracers show about 10 days late for
15
entering into the TS in the El Niño years compared with the La Niña years, which can
be explained by the smaller current velocity in the CCC in the El Niño years.
Only the tracers in La Niña years (i.e. 2008, 2011 and 2012) have higher
percentage of arrival at the coastal water of Taiwan (Fig. 10), but none of the tracers
can bypass the north tip of Taiwan to reach the Ilan Bay (Figs. 12c, e, and f). Most
tracers that arrive at the spawning area go southward but leave the coastal area of
Mainland China when they bypass Pingtan Island and enter the TS. The tracer
trajectories present "U" shape turn in the central TS, and this change in the moving
direction is oriented by the branch of the CCC in the central TS, which occurs more
often in the La Niña states. In the end, the tracers move along the western coast of
Taiwan to reach the coastal water of northern Taiwan. In contrast, very few tracers
approach the coastal water of northern Taiwan in El Niño years (i.e. 2003, 2007 and
2010) (Fig. 10), and most tracers are limited to the western TS (Figs. 12a, 12b, 12d).
The tracer trajectories form "V" shape turn in the coastal water of Mainland China,
and then the tracers turn northeastward, indicating that tracers are impeded by the
northward currents dominating the most part of TS in El Niño. Consequently, most
tracers have no chance to reach the eastern TS.
16
Sensitivity analyses
The sensitivity analysis on initial locations indicate that the effect of spawning
ground shifting is not significant to the abundance of Japanese anchovy that arrive at
their spawning ground (Figs. 13a-b). In this simulation, the north and south boundary
of the anchovy's feeding ground was used. The results suggest that the physical
condition of anchovy overwintering ground aid adult anchovy to follow the CCC and
arrive at their spawning area. When tracers were released at 32°N, although there were
less tracers following the CCC, the tracer trajectories that followed with the CCC are
still very similar as the original simulations (Fig. 13b).
The sensitivity test of the particle-released startingdate shows that the number of
tracers reaching the coastal waters of Taiwan were higher in La Niña years (i.e. 2008,
2011, and 2012) when tracers were released at January 5th (Fig. 14). Although the
abunance of tracers that arrive at the coastal waters of Taiwan are different, the
simulation that tracers were released at January 5th also showed the same trend that
Japanese anchovy arrived at their spawning ground more easily in La Niña years.
17
Discussion
A previous study has shown the correlation between ENSO and the recruitment
of Japanese anchovy, but ENSO can only explained <10% of the variance of anchovy
CPUE (Hsieh et al. 2009). The low-correlation may be due to the decadal variation of
ENSO–EAWM relationship. The historical data shows strong correlation between
ENSO and EAWM in year 2003-2013 (Figs. 2a-b), conforming the past studies that
ENSO can deeply affect the strength of EAWM (Chongyin 1990, Wang 2006). The
strong (weak) EAWM are generally associated with La Niña (El Niño) (Zhang et al.
1997). Although it also has been found that the EAWM and ENSO are not
consistently highly correlated in late 1970s by some studies (Zhou et al. 2007, He
2013). The recent paper (He and Wang 2013) showed ENSO and the EAWM are in a
high-correlation period in the recent decades. Their study indicates the
ENSO–EAWM relationship is modulated by the Pacific Decadal Oscillation, and the
authors suggest that ENSO might deeply affect the EAWM during 2002 - 2012. This
period of high correlation is basically the same as our study period.
The tracer trajectories show a good agreement in temporal-spatial distribution of
Japanese anchovy with acoustic surveys (Iversen et al. 1993), and the simulation
results also have consistency in location and timing with existing fishing grounds of
Japanese anchovy in the Taiwan Strait. In winter, there are two fishing grounds in the
18
coastal water of northern Taiwan: one locates at the coastal water of Tamsui, which is
the western fishing ground for larva anchovies in the northwestern TS; the other one
locates at Ilan Bay, which is the eastern fishing ground in the northwestern Pacific
Ocean (Chen et al. 2010). In addition, the fishery in the coastal water of Fujian
Province also target the adults and larvae of Japanese anchovy and the fishing season
generally starts in February (Jiang and Zheng 1984). All the simulation migration
routes match the fishing season and pass or stay in the area of Fujian Province's
fishing ground. Only the individuals with migration routes in the La Niña years arrive
at the western fishing ground (the coastal water of Tamsui) of Taiwan before the end
of February, while no tracer reaches Ilan Bay (eastern fishing ground around Taiwan)
in any simulation (Fig. 10).
Our results demonstrate the advantage of the biological-physical model in testing
the possible migration routes affected by different circulation patterns and clarify the
important environment factors that orient the swimming direction of anchovies.
Although the previous study suggest that strong thermal front is the key factor that
orient anchovies to cross the TS (Tu et al. 2012), the most important factor that lead
anchovies to arrive at the coastal water of Tamsui is the "U" shape branch current
from the CCC in this study. It demonstrates the necessity of using the realistic data to
drive hydrodynamic model and the dynamic of circulation is the critical factor that
19
determine the success in the spawning migration of Japanese anchovy. Only
anchovies that cross the TS could have chance to arrive the spawning areas around the
Taiwan. Occurrence of the "U" shape branch current from the CCC in the central TS
is the only pathway that anchovies can take to cross the central TS which is almost
dominated by northward currents during early spring. The "U" shape branch current
from the CCC usually occurs when both the stronger CCC and weaker northward
SCSWC and KBETC occur (Fig. 9). This means the strength of CCC is important for
migration of Japanese anchovy, but the dynamic of circulation in TS is the direct
factor influencing the success rate of anchovy arrival at the coastal water of Taiwan.
The strong CCC and the weak northward currents are manipulated by the strong
EAWM, which cannot be presented in climatology data. Thus, the realistic data show
the value in this study.
According to figure 14, the sensitivity analysis of the particle-released starting
date clearly distingush how the strength of CCC and the circulation patterns in the TS
affect the migration process of Japanese anchovy. The results suggest two things: First,
if the northward currents dominant the TS, the Japanese anchovies will face the huge
obstacle in their migration process. Meanwhile, the circulation patterns in TS is the
main reason that lead adult Japanese anchovies to arrvie at the coastal waters of
Taiwan more easily in La Niña years compared with El Niño years. Second, when the
20
circulation patterns in the TS are suitable for adult anchovies to cross the centeral
Taiwan Strait, the stronger CCC aids adult anchovies that had already caught the CCC
have higher chance to arrive at their spawning ground around Taiwan. The number of
tracers released at January 5th arrived at the coastal water of Taiwan is higher in the
La Niña years, but there is no significant difference in El Niño years. In the sensitivity
test, the CCC was stronger to adult anchovies in sensitivity test for all years, but the
circulation patterns in the TS mainly manipulated by the EAWM is no significant
different to the original result. The results suppose that the appropriate circulation
patterns in the TS is the necessary condition for Japanese anchovies to arrive at their
spawning area around Taiwan, and anchovies will have difficulty to cross the central
TS when the northward currents dominate the whole area (e.g. the El Niño years:
2003, 2007, and 2010). The results in La Niña years shows a good agreement that the
CCC strength increases the fluxes of Japanese anchovy populations migrating toward
the coastal water of Taiwan. The tracers released at January 5th were transported by
the stronger CCC in first 15 days comapred to the tracers released at January 1st. The
reason that the CCC got stronger gradually before January 15th in every year is
because that our model does not have not enough time to spin up to stable before
January 15th. In our model, the strength of Changjiang outflow increases day after
days before January 15th, which is caused by the unstable state of Changjiang. The
21
strong CCC aids more adult anchovies to enter into the TS, and thus increases the
individuals to arrive at the coastal water of Taiwan. However in the results 2012, only
a few more individuals that arrived at the spawning area. This is because the strength
of CCC is stronger in 2012 than other La Niña years, and most tracers in 2012 that
cannot arrive at the spawning ground are those tracers that cannot followed the CCC
in the original simulation; as such, the effect of CCC is not siginificant in the result in
2012.
Although the currents play the key factor that determine whether anchovies can
cross the TS, the temperature gradient is also important to aid anchovies to find the
spawning ground. In this study, we also design another fish behavior model that
anchovies only swim along with the current to clarify the mechanism of orientation of
Japanese anchovy. Comparing the results based on different fish behavior models
(Figs. 15a-b), the trajectory differences indicate that the adult anchovies are mainly
oriented by the currents in most time in the model results, but follow the temperature
gradient after the individuals cross the TS and temperature gradient can lead
anchovies to find the spawning ground more preciously.
In our results, no tracer reaches Ilan Bay in any case, suggesting that either the
biological or the physical model needs improvements. Focusing on the area of
Northern Taiwan, the circulations in our hydrodynamic models show a eastward
22
coastal current follow the northern coastal of Taiwan (Figs. 16a-c), which is consistent
with empirical observations (Tang et al. 2000), and temperature in the Pacific Ocean
is higher than the TS. The coastal current and the temperature gradient may facilitate
anchovies to reach the Ilan Bay (east spawning ground) from the TS. However, no
tracer catches the coastal current due to the distance between the tracers and the coast,
indicating the biological model needs to be improved.
Although our biological models may catch the key factors that orient the
Japanese anchovies in the migration process, this primitive model seems to
oversimplify fish biology. Previous studies on capelin and cod (Huse et al. 2004),
Japanese sardine (Okunishi et al. 2009) and Icelandic capelin (Barbaro et al. 2009)
showed other approaches that consider different factors to construct the swimming
behavior of migratory fish. The research of capelin and cod in the Barents Sea (Huse
et al. 2004) used an individual-based model to describe fish swimming behavior, and
coupled it with observed temperature distribution. In fish swimming behavior model,
movement patterns contained the stochastic movement and the directed movement,
the directed movement was determined before each simulation and was independent
from the environment cues, and threshold temperature activated the directed
movement. The research partially captured the spatial dynamics of both species. The
model study of Japanese sardine in the western North Pacific (Okunishi et al. 2009)
23
used the bioenergetics model, a genetic algorithm (GA), and an artificial neural
network (ANN) to simulate the migration of Japanese sardine. Environment factors
(e.g. day length, temperature and solar orientation) affected the swimming direction
which was determined by ANN. ANN requires observation data for the training
process, so sufficient data are necessary for this kind simulation of migration. The
research of capelin in the Iceland Sea (Barbaro et al. 2009) used the observed
temperature and constant current data as environment information, and the capelins
were oriented by temperature gradient and capelins adjusted their swimming direction
due the position or swimming direction of neighboring capelins. Notably, the
swimming speed regulated by anomaly temperature gradient and fish schooling were
considered.
In our biological models, temperature gradient is the factor that orients anchovies
when they are close to coastal Taiwan; however, many other factors can influence
migration of Japanese anchovy, including the ecosystem components (lower trophic
levels), bioenergetics of fish or nutrient distribution. The research on European
anchovy in Mediterranean that included a bioenergetics growth model linked with a
lower trophic level ecosystem model reproduces the growth and many biological
processes of European anchovy (Politikos et al. 2011). Besides temperature, foraging
is another important factor affecting the swimming direction of fishes. The prey
24
distribution profoundly affects the location of spawning; high prey density increase
the larval growth rate and survival rate, and the prey density follows nutrient
distribution. The simulation models shows that nutrients can affect the orientation of
Japanese sardine (Okunishi et al. 2009). Using the models considering nutrients may
lead more anchovies to follow with the CCC, and the anchovies that cross the TS also
have higher chance to arrive at the coastal area of northwestern Taiwan (i.e. Tamsui
river estuary). Moreover, the anchovies may move closer to the Tamsui river estuary,
which may lead them to have a higher chance to catch the current which bypasses the
northern tip of Taiwan and goes eastward, and later arrive at Ilan Bay. In addition, we
used constant swimming velocity in our models, while the field observation showed
that the ability of adjusting swimming speeds play an important role in the spawning
migration of salmon (Hinch and Bratty 2000). This suggests that the ability of
adjusting swimming speed is as important as the orientation, and it should be
considered in the future models. Although a model that includes ecosystem
components, bioenergetics of fish and improvements of fish swimming behavior may
reproduce better on the spatial-temporal dynamics of Japanese anchovy, our primitive
model can still clearly present the possible mechanism that ENSO affects the
population dynamic of Japanese anchovy and provide information for fisheries
management.
25
Conclusion
This study shows ENSO can profoundly affect the circulation patterns in the
ECS and Taiwan Strait, which in turn affects the spawning migration of Japanese
anchovy. Specifically, the EAWM decreased in the El Niño years, and caused the
dominance of the northward current in the TS and weakened the CCC in the ECS. The
strong EWAM in La Niña years lead to a circulation pattern that aided the anchovies
to migrate cross the TS. The results suggests that the adult Japanese anchovies have a
higher chance to arrive at the spawning ground near the coast of Taiwan in La Niña
years. Consider ENSO effects on the recuritment of Japnese anchovy is necessary for
fishery management policy. Accumulating evidence indicates that large-scale
environmental variations have caused fluctuations of marine populations (Barber and
Chavez 1986, Philander et al. 1989, Mantua and Hare 1997, Di Lorenzo et al. 2008).
In fact, studies have indicated fluctuations of marine populations are better predicted
by large-scale climate patterns than local factors (Stenseth et al. 2003). The dynamics
of complex patterns in the climate can affect ecological factors in both direct and
indirect pathways (Stenseth et al. 2003). Thus, we suggest that understanding the
mechanisms underlying how large-scale climate affects populations can enhance the
accuracy of predictions of marine ecosystems, which is needed for management
policy (Ottersen et al. 2010).
26
27
References
Bakun, A., and R. H. Parrish. 1991. Comparative studies of coastal pelagic fish reproductive habitats: the anchovy (Engraulis anchoita) of the southwestern Atlantic. ICES Journal of Marine Science: Journal du Conseil 48:343-361.
Barbaro, A., B. Einarsson, B. Birnir, S. Sigursson, H. Valdimarsson, O. K. Pálsson, S.
Sveinbjörnsson, and O. T. Sigursson. 2009. Modelling and simulations of the migration of pelagic fish. ICES Journal of Marine Science 66:826-838.
Barber, R. T., and F. P. Chavez. 1986. Ocean variability in relation to living resources during the 1982-83 El Nino. Nature 319:279-285.
Capella, J. E., L. B. Quetin, E. E. Hofmann, and R. M. Ross. 1992. Models of the early life history of Euphausia superba—Part II. Lagrangian calculations.
Deep Sea Research Part A. Oceanographic Research Papers 39:1201-1220.
Chang, C. P., and K. M. Lau. 1982. Short-Term Planetary-Scale Interactions over the Tropics and Midlatitudes during Northern Winter. Part I: Contrasts between Active and Inactive Periods. Monthly Weather Review 110:933-946.
Chang, Y., K.-T. Lee, M.-A. Lee, and K.-W. Lan. 2009. Satellite Observation on the Exceptional Intrusion of Cold Water in the Taiwan Strait. Terrestrial, Atmospheric and Oceanic Sciences 20:661-669.
Chang, Y., T. Shimada, M. A. Lee, H. J. Lu, F. Sakaida, and H. Kawamura. 2006.
Wintertime sea surface temperature fronts in the Taiwan Strait. Geophysical Research Letters 33.
Chao, S.-Y. 1990. Circulation of the East China Sea, a numerical study. Journal of the Oceanographical Society of Japan 46:273-295.
Chen, C.-S., and T.-S. Chiu. 2003. Early life history traits of Japanese anchovy in the northeastern waters of Taiwan, with reference to larval transport.
ZOOLOGICAL STUDIES-TAIPEI- 42:248-257.
Chen, C.-S., C.-H. Tzeng, and T.-S. Chiu. 2010. Morphological and Molecular Analyses Reveal Separations among Spatiotemporal Populations of Anchovy (Engraulis japonicus) in the Southern East China Sea. Zoological Studies 49:270-282.
Chiu, T.-S., Y.-J. Lee, S.-W. Huang, and H.-T. Yu. 2002. Polymorphic microsatellite markers for stock identification in Japanese anchovy (Engraulis japonica).
Molecular Ecology Notes 2:49-50.
Chiu, T.-S., S.-S. Young, and C.-S. Chen. 1997. Monthly variation of larval anchovy fishery in I-lan Bay, NE Taiwan, with an evaluation for optimal fishing season.
JOURNAL-FISHERIES SOCIETY OF TAIWAN 24:273-282.
Chiu, T., and C. Chen. 2001. Growth and temporal variation of two Japanese anchovy
28
cohorts during their recruitment to the East China Sea. Fisheries Research 53:1-15.
Chongyin, L. 1990. Interaction between anomalous winter monsoon in East Asia and El Nino events. Advances in Atmospheric Sciences 7:36-46.
Cowen, R. K., C. B. Paris, and A. Srinivasan. 2006. Scaling of Connectivity in Marine Populations. Science 311:522-527.
Cushing, D. H. 1975. Marine ecology and fisheries. CUP Archive.
Di Lorenzo, E., N. Schneider, K. M. Cobb, P. J. S. Franks, K. Chhak, A. J. Miller, J. C.
McWilliams, S. J. Bograd, H. Arango, E. Curchitser, T. M. Powell, and P.
Rivière. 2008. North Pacific Gyre Oscillation links ocean climate and ecosystem change. Geophys. Res. Lett. 35:L08607.
Haidvogel, D. B., H. G. Arango, K. Hedstrom, A. Beckmann, P. Malanotte-Rizzoli, and A. F. Shchepetkin. 2000. Model evaluation experiments in the North Atlantic Basin: simulations in nonlinear terrain-following coordinates.
Dynamics of Atmospheres and Oceans 32:239-281.
He, S. 2013. Reduction of the East Asian winter monsoon interannual variability after the mid-1980s and possible cause. Chinese Science Bulletin 58:1331-1338.
He, S., and H. Wang. 2013. Oscillating Relationship between the East Asian Winter Monsoon and ENSO. Journal of Climate 26:9819-9838.
Hinch, S. G., and J. Bratty. 2000. Effects of swim speed and activity pattern on success of adult sockeye salmon migration through an area of difficult passage.
Transactions of the American Fisheries Society 129:598-606.
Hsia, K.-Y., K.-T. Lee, C.-H. Liao, and J.-E. Wang. 2004. Effects of changes in sea surface temperature on fluctuation in larval anchovy resources in coastal waters of Taiwan. 臺灣水產學會刊 31:127-140.
Hsieh, C.-H., C.-S. Chen, T.-S. Chiu, K.-T. Lee, F.-J. Shieh, J.-Y. Pan, and M.-A. Lee.
2009. Time series analyses reveal transient relationships between abundance of larval anchovy and environmental variables in the coastal waters southwest of Taiwan. Fisheries Oceanography 18:102-117.
Hu, J., H. Kawamura, C. Li, H. Hong, and Y. Jiang. 2010. Review on current and seawater volume transport through the Taiwan Strait. Journal of Oceanography 66:591-610.
Huse, G., G. O. Johansen, B. Bogstad, and H. Gjøsæ ter. 2004. Studying spatial and trophic interactions between capelin and cod using individual-based modelling.
ICES Journal of Marine Science: Journal du Conseil 61:1201-1213.
Isobe, A. 2008. Recent advances in ocean-circulation research on the Yellow Sea and East China Sea shelves. Journal of Oceanography 64:569-584.
Iversen, S. A., D. Zhu, A. Johannessen, and R. Toresen. 1993. Stock size, distribution
29
and biology of anchovy in the Yellow Sea and East China Sea. Fisheries Research 16:147-163.
Jiang, S., and X. Zheng. 1984. The morphological characters of eggs and larvae of Engraulis japonica Temminck et Schlegel and its spawning areas in the fishing ground of the South Fujian and Taiwan Bank. Journal of Oceanography In Taiwan Strait 3:224-231.
Kim, J.-Y., Y.-S. Kang, H.-j. Oh, Y.-S. Suh, and J.-D. Hwang. 2005. Spatial distribution of early life stages of anchovy (Engraulis japonicus) and hairtail (Trichiurus lepturus) and their relationship with oceanographic features of the East China Sea during the 1997–1998 El Niño Event. Estuarine, Coastal and Shelf Science 63:13-21.
Kuo, N.-J., and C.-R. Ho. 2004. ENSO effect on the sea surface wind and sea surface temperature in the Taiwan Strait. Geophysical Research Letters 31:L13309.
Lee, H.-J., and S.-Y. Chao. 2003. A climatological description of circulation in and around the East China Sea. Deep Sea Research Part II: Topical Studies in Oceanography 50:1065-1084.
Lee, M.-A., K.-T. Lee, and G.-Y. Shiah. 1995. Environmental factors associated with the formation of larval anchovy fishing grounds in the coastal waters of southwest Taiwan. Marine Biology 121:621-625.
Lee, M., and K. Lee. 1996. The larval anchovy (< i> Engraulis japonicus</i>) fishery in relation to the environmental factors in coastal waters of Fangliao, Taiwan.
Fisheries Research 26:37-48.
Li, C., J. Hu, S. Jan, Z. Wei, G. Fang, and Q. Zheng. 2006. Winter-spring fronts in Taiwan Strait. Journal of Geophysical Research: Oceans 111:C11S13.
Lin, S. F., T. Y. Tang, S. Jan, and C. J. Chen. 2005. Taiwan strait current in winter.
Continental Shelf Research 25:1023-1042.
Mantua, N. J., and S. R. Hare. 1997. A Pacific interdecadal climate oscillation with impacts on salmon production. Bulletin of the American Meteorological Society 78:1069.
Marchesiello, P., J. C. McWilliams, and A. Shchepetkin. 2003. Equilibrium structure and dynamics of the California Current System. Journal of Physical Oceanography 33.
Okunishi, T., S.-i. Ito, T. Hashioka, T. Sakamoto, N. Yoshie, H. Sumata, Y. Yara, N.
Okada, and Y. Yamanaka. 2012. Impacts of climate change on growth, migration and recruitment success of Japanese sardine (Sardinops melanostictus) in the western North Pacific. Climatic Change 115:485-503.
Okunishi, T., Y. Yamanaka, and S.-i. Ito. 2009. A simulation model for Japanese sardine (Sardinops melanostictus) migrations in the western North Pacific.
30
Ecological Modelling 220:462-479.
Opdal, A. F., F. Vikebø, and Ø . Fiksen. 2011. Parental migration, climate and thermal exposure of larvae: spawning in southern regions gives Northeast Arctic cod a warm start. Marine Ecology Progress Series 439:255-262.
Ottersen, G., S. Kim, G. Huse, J. J. Polovina, and N. C. Stenseth. 2010. Major pathways by which climate may force marine fish populations. Journal of Marine Systems 79:343-360.
Philander, S. G., J. R. Holton, and R. Dmowska. 1989. El Nino, La Nina, and the Southern Oscillation. Elsevier Science.
Politikos, D., G. Triantafyllou, G. Petihakis, K. Tsiaras, S. Somarakis, S.-I. Ito, and B.
Megrey. 2011. Application of a bioenergetics growth model for European anchovy (Engraulis encrasicolus) linked with a lower trophic level ecosystem model. Hydrobiologia 670:141-163.
Rose, G. A. 1993. Cod spawning on a migration highway in the north-west Atlantic.
Nature 366:458-461.
Rothschild, B., and M. Fogarty. 1989. Spawning-stock biomass: a source of error in recruitment/stock relationships and management advice. Journal du Conseil:
ICES Journal of Marine Science 45:131-135.
Shang, S., C. Zhang, H. Hong, Q. Liu, G. T. F. Wong, C. Hu, and B. Huang. 2005.
Hydrographic and biological changes in the Taiwan Strait during the 1997–1998 El Niño winter. Geophysical Research Letters 32:L11601.
Shchepetkin, A. F., and J. C. McWilliams. 2005. The regional oceanic modeling
system (ROMS): a split-explicit, free-surface,
topography-following-coordinate oceanic model. Ocean Modelling 9:347-404.
Stenseth, N. C., G. Ottersen, J. W. Hurrell, A. Mysterud, M. Lima, K. S. Chan, N. G.
Yoccoz, and B. Å dlandsvik. 2003. Studying climate effects on ecology through the use of climate indices: the North Atlantic Oscillation, El Nino Southern Oscillation and beyond. Proceedings of the Royal Society of London.
Series B: Biological Sciences 270:2087-2096.
Takasuka, A., Y. Oozeki, H. Kubota, Y. Tsuruta, and T. Funamoto. 2005. Temperature impacts on reproductive parameters for Japanese anchovy: Comparison between inshore and offshore waters. Fisheries Research 76:475-482.
Tang, T. Y., J. H. Tai, and Y. J. Yang. 2000. The flow pattern north of Taiwan and the migration of the Kuroshio. Continental Shelf Research 20:349-371.
Tornita, T., and T. Yasunari. 1996. Role of the Northeast Winter Monsoon on the Biennial Oscillation of the ENSO/Monsoon System. Journal of the Meteorological Society of Japan 74:399-413.
Tsai, C.-F., P.-Y. Chen, C.-P. Chen, M.-A. Lee, G.-Y. Shiah, and K.-T. Lee. 1998.
31
Fluctuation in abundance of larval anchovy and environmental conditions in coastal waters off south-western Taiwan as associated with the El Niño–Southern Oscillation. Fisheries Oceanography 6:238-249.
Tu, C.-Y., Y.-H. Tseng, T.-S. Chiu, M.-L. Shen, and C.-H. Hsieh. 2012. Using coupled fish behavior–hydrodynamic model to investigate spawning migration of Japanese anchovy, Engraulis japonicus, from the East China Sea to Taiwan.
Fisheries Oceanography 21:255-268.
Wang, B. 2006. The asian monsoon. Springer Science & Business Media.
Wang, B., R. Wu, and X. Fu. 2000. Pacific–East Asian Teleconnection: How Does ENSO Affect East Asian Climate? Journal of Climate 13:1517-1536.
Wang, Y., H. Wei, and M. Kishi. 2013. Coupling of an individual-based model of anchovy with lower trophic level and hydrodynamic models. Journal of Ocean University of China 12:45-52.
Weihs, D. 1973. Optimal fish cruising speed.
Willis, J. 2011. Modelling swimming aquatic animals in hydrodynamic models.
Ecological Modelling 222:3869-3887.
Wu, C.-R., S.-Y. Chao, and C. Hsu. 2007. Transient, seasonal and interannual variability of the Taiwan Strait current. Journal of Oceanography 63:821-833.
Young, S.-S., and T.-S. Chiu. 1994. Ovarian maturation of Japanese anchovy, Engraulis japonica T. and S., from I-lan Bay, northeastern Taiwan. Zool. Stud 33:302-309.
Yu, H.-T., Y.-J. Lee, S.-W. Huang, and T.-S. Chiu. 2002. Genetic Analysis of the Populations of Japanese Anchovy (Engraulidae: Engraulis japonicus) Using Microsatellite DNA. Marine Biotechnology 4:471-479.
Yu, Z.-n., X.-y. Kong, T.-h. Guo, Y.-y. Jiang, Z.-m. Zhuang, and X.-s. Jin. 2005.
Mitochondrial DNA sequence variation of Japanese anchovy Engraulis japonicus from the Yellow Sea and East China Sea. Fisheries Science 71:299-307.
Zhang, J., R. Letolle, J. M. Martin, C. Jusserand, and J. M. Mouchel. 1990. Stable oxygen isotope distribution in the Huanghe (Yellow River) and the Changjiang (Yangtze River) estuarine systems. Continental Shelf Research 10:369-384.
Zhang, Y., K. R. Sperber, and J. S. Boyle. 1997. Climatology and interannual variation of the East Asian winter monsoon : Results from the 1979-95 NCEP/NCAR reanalysis. American Meteorological Society, Boston, MA, ETATS-UNIS.
Zhou, W., C. Li, and X. Wang. 2007. Possible connection between Pacific Oceanic interdecadal pathway and east Asian winter monsoon. Geophysical Research Letters 34:L01701.
32
Figure 1. Hypothetical spawning migration route of Japanese anchovy from the coastal area nearby the Yangtze River mouth to the coastal area of Taiwan. Adult anchovies follow the China Coastal Current into the Taiwan Strait, and cross the Taiwan Strait to arrive at the coastal area of northern Taiwan. Tamsui and Ilan coastal areas are known spawning grounds.
33
Figure 2. The historical data of (a) Oceanic Niño Index (ONI), (b) Averaged meridional wind velocity and (c) the averaged velocity of China Coastal Current, where positive values indicate southward flows. Plotted are averaged data from January to February.
34
Figure 3. Model results of near-surface (averaged from 1 to 5 m) current velocity in the East China Sea averaged from January to February for (a) 2003, strong El Niño, and (b) 2007, moderate El Niño.
35
Figure 3 (continued). Model results of near-surface (averaged from 1 to 5 m) current velocity in the East China Sea averaged from January to February for (c) 2008, strong La Niña and (d) 2010, strong El Niño.
36
Figure 3 (continued). Model results of near-surface (averaged from 1 to 5 m) current velocity in the East China Sea averaged from January to February for (e) 2011, strong La Niña and (f) 2012, moderate La Niña.
37
Figure 4. Model results of near-surface (averaged from 1 to 5 m) salinity distribution in the East China Sea averaged from January to February for (a) 2003, strong El Niño, (b) 2007, moderate El Niño, (c) 2008, strong La Niña, (d) 2010, strong El Niño, (e) 2011, strong La Niña, and (f) 2012, moderate La Niña.
38
Figure 5. Sea surface temperature (averaged from 1 to 5 m) in the East China Sea averaged from January to February for (a) 2003, strong El Niño, (b) 2007, moderate El Niño, (c) 2008, strong La Niña, (d) 2010, strong El Niño, (e) 2011, strong La Niña, and (f) 2012, moderate La Niña.
39
Figure 6. Model results of the velocity and the direction of the current in the coastal area of Mainland China (the location of the CCC) starting from January 1st for (a) 2003, strong El Niño, (b) 2007, moderate El Niño, (c) 2008, strong La Niña, (d) 2010, strong El Niño, (e) 2011, strong La Niña, and (f) 2012, moderate La Niña. The negative values indicate southward flows.
40
Figure 7. The general circulation pattern in the hydrodynamic model in Winter. CCC, China Coastal Current; SCSWC, South China Sea Warm Current; KBETC, Kuroshio Branch Current along with the coast of Taiwan in the Taiwan Strait; SCSKBC, Kuroshio Branch Current to the South China Sea.
41
Figure 8. Near-surface (averaged from 1 to 5 m) current velocity and SST in the Taiwan Strait averaged from January to February in year (a) 2003, strong El Niño, (b) 2007, moderate El Niño, (c) 2008, strong La Niña, (d) 2010, strong El Niño, (e) 2011, strong La Niña, and (f) 2012, moderate La Niña.
42
Figure 9. Schematic illustrating the "U" shape current in the central of Taiwan Strait and the anticyclonic eddy in the northwestern area of Changyun Rise generated from the hydrodynamic model.
43
Figure 10. Variation in final destinations of the tracers in the end of simulations among years.
44
Figure 11. The simulation results of the strength variation of the CCC from ROMS, and it has positive correlation with ONI and EAWM. (a) ONI, (b) meridional wind velocity and the simulation results for (c) the averaged velocity of China Coastal Current from January to February.
45
Figure 12. The tracer trajectories in year (a) 2003, strong El Niño and (b) 2007, moderate El Niño. The heavy red line represents the starting location. The red rectangular enclosed the area deemed as successful arrival of Japanese anchovy in this study, which is defined as the 50 kilometers around the Tamsui river estuary. Color of trajectories indicates time of simulation, with darker color representing later stages.
The gray trajectories represent the tracers that miss the CCC.
46
Figure 12 (continued). The tracer trajectories in year (c) 2008, strong La Niña and (d) 2010, strong El Niño. The heavy red line represents the starting location. The red rectangular enclosed the area deemed as successful arrival of Japanese anchovy in this study, which is defined as the 50 kilometers around the Tamsui river estuary. Color of trajectories indicates time of simulation, with darker color representing later stages.
The gray trajectories represent the tracers that miss the CCC.
47
Figure 12 (continued). The tracer trajectories in year (e) 2011, strong La Niña and (f) 2012, moderate La Niña. The heavy red line represents the starting location. The red rectangular enclosed the area deemed as successful arrival of Japanese anchovy in this study, which is defined as the 50 kilometers around the Tamsui river estuary. Color of trajectories indicates time of simulation, with darker color representing later stages.
The gray trajectories represent the tracers that miss the CCC.
48
Figure 13. The tracer trajectories with different initial locations, using the results of 2008 as an example: (a) 30°N and (b) 32°N. The heavy red line represents the starting location. The red rectangular enclosed the area deemed as successful arrival of
Japanese anchovy in this study, which is defined as the 50 kilometers around the Tamsui river estuary. Color of trajectories indicates time of simulation, with darker color representing later stages.
49
Figure 14. Summary statistics of simulations with different initial days.
50
Figure 15. The tracer trajectories from different modeling scenarios, using the results of 2008 as an example: (a) anchovies swim along with the current but change their behavior to follow the temperature gradient when sense the threshold temperature, and (b) anchovies only swim along with the current. The heavy red line represents the starting location. The red rectangular enclosed the area deemed as successful arrival of Japanese anchovy in this study, which is defined as the 50 kilometers around the Tamsui river estuary. Color of trajectories indicates time of simulation, with darker color representing later stages.
51
Figure 16. The current along with the northern coastal of Taiwan, which flows eastward in most time. (a) A snap shot at 2010/01/10, 04:00, (b) the two month average circulation in 2010 and (c) two month average circulation in 2011.