1
(Revised MS to ES&T)
1
Reducing PAH Emissions from the Iron Ore Sintering
2
Process by Optimizing Its Operation Parameters
3
Yu-Cheng Chen1, Perng-Jy Tsai1,2*, Jin-Luh Mou3 4
1Department of Environmental and Occupational Health, Medical College, National Cheng Kung 5
University, 138, Sheng-Li Road, Tainan 70428, Taiwan 6
2Sustainable Environment Research Center, National Cheng Kung University, 1 University Road, 7
Tainan 70101, Taiwan 8
3Department of Occupational Safety and Health, Chung Hwa University of Medical Technology, 89, 9
Wenhwa 1st St., Rende Shiang, Tainan 71703, Taiwan 10
11
*Correspondence author: Perng-Jy Tsai, Department of Environmental and Occupational Health, 12
Medical College, National Cheng Kung University. 138, Sheng-Li Rd., Tainan 70428, Taiwan. Tel.:
13
+886-6-2353535 ext. 5806; Fax: +886-6-2752484; E-mail address: [email protected] 14
Running Title: Determining optimal operation condition for reducing PAH emissions in the iron ore 15
sintering process by using Taguchi experimental design.
16
2 Abstract
1
This study was set out to reduce polycyclic aromatic hydrocarbon (PAH) emissions from the iron ore 2
sintering process by optimizing its operation parameters obtained from the Taguchi experimental design.
3
Four operating parameters, including the water content (Wc; range = 6.07.0 wt %), suction pressure 4
(Ps; range = 10001400 mmH2O), bed height (Hb; range = 500600 mm) and type of hearth layer (HL;
5
including sinter, hematite, and limonite) were selected and conducted on a pilot-scale sinter pot to 6
simulate various sintering operating conditions of a real-scale sinter plant. We found that the resultant 7
optimal combination (Wc = 6.5 wt%, Hb = 600 mm, Ps = 1400 mmH2O, and HL = limonite) could 8
reduce the emission factor of total BaP equivalent concentration (EFBaPeq) up to 57.6% in comparison 9
with the current operating condition of a real-scale sinter plant (Wc = 6.5 wt %, Hb = 550 mm, Ps = 10
1200 mmH2O, and HL = sinter). Through the ANOVA analysis, we found that Ps and Hb were the top 11
two parameters affecting total EFBaPeq (accounting respectively for 70.9% and 21.2% of the total 12
contribution of the four selected parameters). By examining both the sinter productivity and sinter 13
strength, the values obtained from the optimal combination were quite comparable to those of the 14
current operating condition. The above results further confirm the applicability of the obtained optimal 15
combination for the real-scale sinter plant.
16
Keywords: PAH emission, iron ore sintering, operation parameters, optimal combination, Taguchi 17
experimental design 18
19
3
Introduction
1
Polycyclic aromatic hydrocarbons (PAHs) and their derivatives could be formed during the 2
incomplete and/or inefficient combustion of fossil fuels. PAHs are semi-volatile compounds presenting 3
in the ambient air in not only the gas phase, but also the particulate phase through condensation or 4
adsorption of gas-phase PAHs on the surface of particles (1). PAHs are known to be harmful to human 5
health. Some PAHs, such as benzo[a]pyrene (BaP), and Cyclopenta[c,d]pyrene (CYC) and 6
dibenz[a,h]anthracene (DBA), have been classified into Group 1 and Group 2A, respectively, by the 7
International Agency for Research on Cancer (IARC) (2). Many countries have also regulated the 8
ambient air quality standards or proposed the limit value for the BaP (3). PAHs found in the outside 9
ambient air can be generated both from the natural sources (such as forest fires and volcanic eruptions) 10
and the anthropogenic sources (such as industrial combustion, traffic emission, and waste incineration) 11
(4–6).
12
The iron and steelmaking is a highly energy-intensive process requiring burning of fossil fuels, 13
including coal and coke and is known as one of the significant PAH emission sources (7–9). As 14
reported by Ravindra et al., (3) and Bjøresth and Ramdahl (10) studies, PAHs emitted from iron and 15
steel industries have been recognized as the second major source in Europe, accounting for 12.020.2%
16
of yearly total PAH emissions. In an integrated iron and steel plant, the iron ore sintering process plays 17
an important role on PAH emissions due to its extremely large flue gas volume. Iron ore sintering is an 18
agglomeration process to convert iron ore fines (raw mixture) into lumpy agglomerates. In the 19
preliminary stage of sinter making process, water was sprayed onto the raw mixtures in the mixing 20
drum to increase the granular sizes for enhancing the permeability of the sinter bed. During sintering, 21
the raw mixtures were first ignited by gas-fueled (nature gas) burns situated at the beginning of the steel 22
belt conveyer. Then, the sinter bed was heated to temperature of ~1000 ºC or above. Suction air passes 23
through the sinter layer by means of wind legs and a fan, which moves the melting/combustion zone to 24
the down layer to produce sintered products.
25
4
The sintering process has been developed for several decades in the iron and steel manufacturing 1
industry. Traditionally, air pollution control devices (APCDs) for the control of PAH emissions have 2
been widely used to reduce their environmental impacts. Nevertheless, most sinter plants have faced the 3
dilemma regarding how to continuously upgrade their APCDs in order to comply with stricter and 4
stricter emission standards adopted in their countries. In order to comply with future PAH emission 5
standard and decrease the cost resulting from upgrading the end-pipe PAH control devices, it is 6
important to develop an effective method for directly reducing PAH generations during the sintering 7
process. Therefore, to optimize operating conditions in order to reduce PAH formations via oxidation 8
reaction might provide a promising solution. In addition to the property of the sinter raw mixture, the 9
four operating parameters, including the water content (Wc), suction pressure (Ps), bed height (Hb) and 10
type of hearth layer (HL), are major factors affecting combustion conditions during the iron ore 11
sintering process (11-13). Among these four parameters, the content of Wc in the sinter bed might 12
affect the adsorption of PAHs on the surface of particles and the solubility of PAHs in water or might 13
affect the heating value of coke in combustion; the magnitude of Ps affects the air (or oxygen) supply 14
which might play an important role in the oxidation reaction related to PAH formations (14); Hb affects 15
the thickness and temperature profile of the combustion zone of the sinter bed and in consequence 16
affects the contents of unburned hydrocarbon compounds during the sintering process (15); and the type 17
of the HL might affect the catalytic oxidation reaction associated with PAH formations (13, 16). All 18
these operating parameters have been used to control the structure of the sinter bed to simulate various 19
operation conditions for the sintering process in many studies (11, 17–19). It is known that the cost 20
reduction and the sinter production are the major concerns of the real-scale sinter plant rather than 21
PAHs reduction. As a result the selected iron ores might come from numerous mine sources because of 22
cost and quality considerations and result in considerable variations in the contents of the sintering raw 23
mixture. Therefore, it would become impractical for changing the contents of the sintering raw mixture 24
in a real-scale sinter plant simply for reducing its PAH emissions. Therefore, to seek for an optimal 25
5
combination of Wc, Ps, Hb and HL for reducing PAH formations during the sintering process might 1
provide a promising solution.
2
In this study the Taguchi experimental design was used to determine the optimal operating 3
combination for reducing PAH formations during the sintering process. In addition, two important 4
indexes (i.e. the sinter productivity and sinter strength) widely used for characterizing the quality of the 5
sintering products were also examined to further ensure the optimal combination obtained from the 6
Taguchi experimental design can be used in the real-scale sinter plant.
7
Material and Methods
8
The Pilot Scale Sinter Pot and Its Operating Procedures. A pilot scale sinter pot was used in this 9
study to simulate the real-scale sintering process (Fig. 1). It has been wildly used in pilot tests for iron 10
ore and steel industries for improving their sinter production (12, 20) and the control of their emitted 11
air contaminants (such as PCDD/Fs) (21, 22), although the volume of this sinter pot (0.051 m3) is quite 12
small as in comparison with the real-scale sinter plant (400 m3). This sinter pot included a pot body 13
(inner diameter = 330 mm, height = 600 mm), an ignition hood, and a windbox connected to an exhaust 14
duct. Six kilogram of hearth layer (particle diameters = 10−15 mm, thickness = 40 mm) were placed 15
inside the sinter pot. The temperature profiles and related chemical reactions that presumably occurred 16
in the sinter pot during combustion were also illustrated in Fig. 1. Results associated with the zone 17
combustion process of the sinter pot have been described in details in the previous studies (21–22).
18
Outlet gas temperature was measured by three type-k thermocouples located in the windbox to monitor 19
sintering scenario during the combustion process. During sintering, the designated ignition temperature 20
in ignition hood was specified at 1150−1200 ºC for 1.5 min and then held in another 1.5 min for 21
keeping heat. During this period (i.e., starting from the ignition to the removal of the ignition hood) the 22
suction pressure inside the sinter pot was controlled at 800 mmH2O by using an electromagnetic valve.
23
After this, the suction pressure was raised to 1200 mmH2O and then kept constant throughout the end of 24
6
the sintering process. The total sintering time was around 35 min depending on the experimental 1
conditions.
2
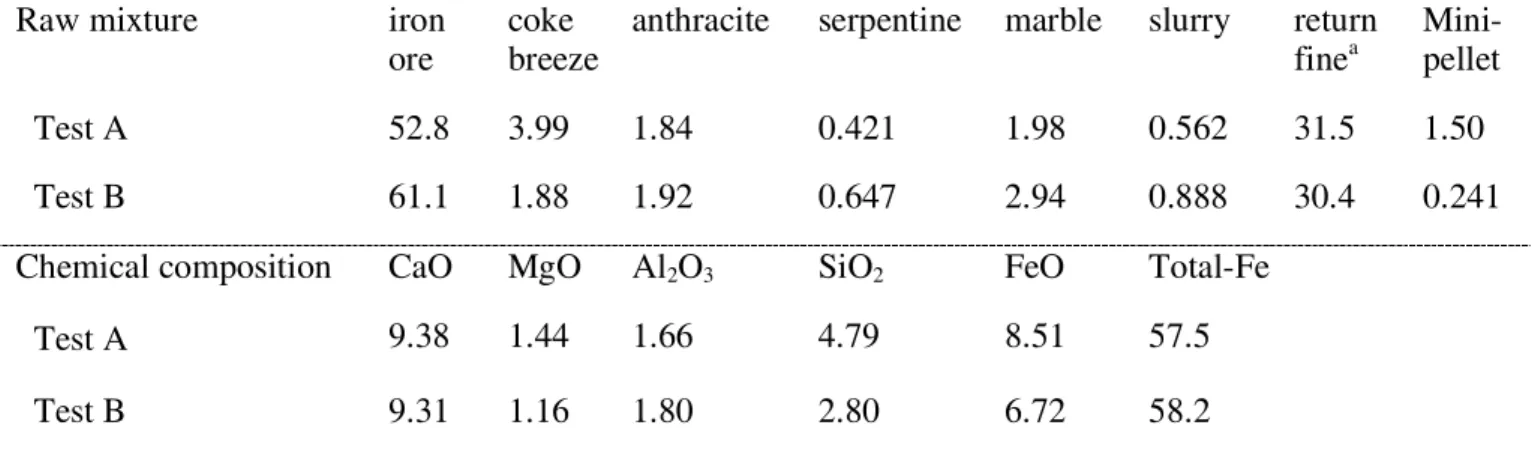
The sintering raw mixture used in this study was directly obtained from the real-scale sinter plant. Its 3
contents and the analyzed chemical compositions show in Table 1.
4
The Taguchi Experimental Design. The Taguchi experimental design is a powerful tool that 5
provides a simple, efficient and systematic approach to optimize operating conditions under designated 6
ranges of all selected parameters. The details of the Taguchi experimental design can be seen in the 7
Supporting Information (SI). The working steps for the Taguchi experimental design include: (1) 8
selection of operation parameters; (2) determination of the number of levels for each selected parameter;
9
(3) selection of the appropriate orthogonal array and arrangement of operation parameters to the 10
orthogonal array; (4) conducting experiments based on the arrangement of the orthogonal array; (5) 11
analysis of the experimental results using the S/N ratio and ANOVA analyses; (6) selection of the 12
optimal combination of levels for the selected operation parameter; and (7) verification of the above 13
optimal combination by conducting a confirmation experiment (23, 24).
14
Selected Operation Parameters, Levels and Orthogonal Array. Four operation parameters (and 15
their testing ranges), including water content (Wc; 6.07.0 wt %), suction pressure (Ps; 1000−1400 mm 16
H2O), bed height (Hb; 500600 mm), and types of hearth layer (HL; including sinter (containing 70%
17
Fe2O3 and 7% Fe3O4; Fe in total accounting for 58.1% of total weight), hematite (containing 88%
18
Fe2O3 and 7% FeO·OH; Fe in total accounting for 64.1% of total weight), and limonite (containing 40%
19
Fe2O3, 45% FeO·OH and 6% H2O; Fe in total accounting for 63.3% of total weight)) were selected in 20
this study. The selected ranges of the above four parameters were determined based on the past 21
operation experience of the selected sinter plant and the published references (17, 25–26). A specific 22
combination of the four selected operation parameters (i.e., Wc = 6.5 wt %, Ps = 1200 mmH2O, Hb = 23
550 mm, and type of HL = sinter) being currently used in the real-scale sinter plant was served as the 24
reference combination. SI Table S1 shows the selected three levels for each operation parameter based 25
7
on its designated range. SI Table S2 shows an L9(34) orthogonal array (with four columns and nine 1
rows) used in this study according to the Taguchi experimental design (23). Since the experimental 2
design was orthogonal, it was possible to discriminate the effect of each individual parameter at each 3
designated level. As shown in SI Table S2, nine combinations of the four selected operation parameters 4
were chosen for conducting experiments. Subjected to the cost associated with samplings, sample 5
analyses and sinter pot operation, each experiment were repeated twice (n = 2) in this study.
6
PAH sampling. For each experiment, the flue gas samples were collected from the duct located at 7
the downstream of the windbox of the pilot sinter pot (see Fig 1) by using a PAHs Sampling System 8
(PSS; Li-The Co., Kaoushing, Taiwan) (27). Because the instability of the airstream occurred during the 9
first five minutes of the sintering process (i.e., the time needed for adjusting the suction pressure to 10
reach the designated level), the flue gas of the first five minute was not collected. As a result, the 11
sampling time for each flue gas sample was ~30 min. During sampling, the flue gas (including particle- 12
and gas-phase PAHs) was sampled iso-kinetically throughout each batch sintering. The details of the 13
PAH sampling method can be seen in the SI.
14
PAH analysis. For each collected sample, both its glass fiber filter and PUF/resin cartridge were 15
Soxhelt extracted in a mixed solvent (n-hexane and dichloromethane v:v = 1:1) for 24 hours. The 16
extract was concentrated by purging with ultra-pure nitrogen to 2 ml, cleaned-up and then re- 17
concentrated to exactly 1.0 ml. The contents of 22 PAH compounds were determined by using a gas 18
chromatograph with a mass selective detector (GC/MS) and a computer work station. Detailed 19
analytical methods and conditions were included in the SI or presented in our previous works (27–28).
20
Evaluation of Sinter Productivity and Sinter Strength. The sinter productivity, expressed in tons 21
per square meter of grate area of sintering machine per day, was calculated from the sintering time, the 22
cross-sectional area of the pot grate, and the weight of sinter product recovered from the test (by 23
removing the loss of the weight of hearth layer). The sinter strength was measured by using a modified 24
ISO 3271 test method (29).
25
8
Data Analysis. In this study, the total PAH concentration was defined as the sum of the 1
concentrations of the selected 22 PAH compounds. In addition, PAH contents were further divided into 2
three categories (LMW-, MMW- and HMW-PAHs) according to their molecular weights (see in SI 3
Table S3).
4
Because BaP has been known to be the most carcinogenic PAH compound, the carcinogenic 5
potency of each collected sample was also determined in terms of its BaP equivalent concentration 6
(BaPeq). To calculate the BaPeq for each individual PAH species, it requires the use of its toxic 7
equivalent factor (TEF) for the given species relative to BaP carcinogenic potency. Each selected TEF 8
corresponding it’s PAH compound has been reported by our previous works (27, 30). The carcinogenic 9
potency of the total BaPeq was estimated as the sum of individual BaPeq of the 22 PAH compounds. In 10
the present study, considering the variations in flow rate, sintering time, and charging weight of 11
feedstock among different experimental combinations, the emission factor of total BaPeq (EFBaPeq; 12
μg/kg-feedstock) was calculated to compare for reducing the environmental impact purpose. The details 13
associated with the calculation of EFBaPeq can be seen in the SI.
14
The S/N ratio based on the concept of the-lower-the-better was used to characterize EFBaPeq. The 15
details of the calculated equations including the S/N ratio and its predicted value for the optimal 16
combination can be seen in the SI. In addition, the analysis of variance (ANOVA) was used to 17
investigate the effect of each individual parameter on EFBaPeq. 18
Results and Discussion
19
Concentrations and Characteristics of PAHs Emitted from the Sintering Process. The SI Figure 20
S1 shows the fractions of 22 PAHs (mean and range) obtained from each of the nine selected 21
experimental combinations as using Test A-sintering raw mixture. The most abundant PAHs presented 22
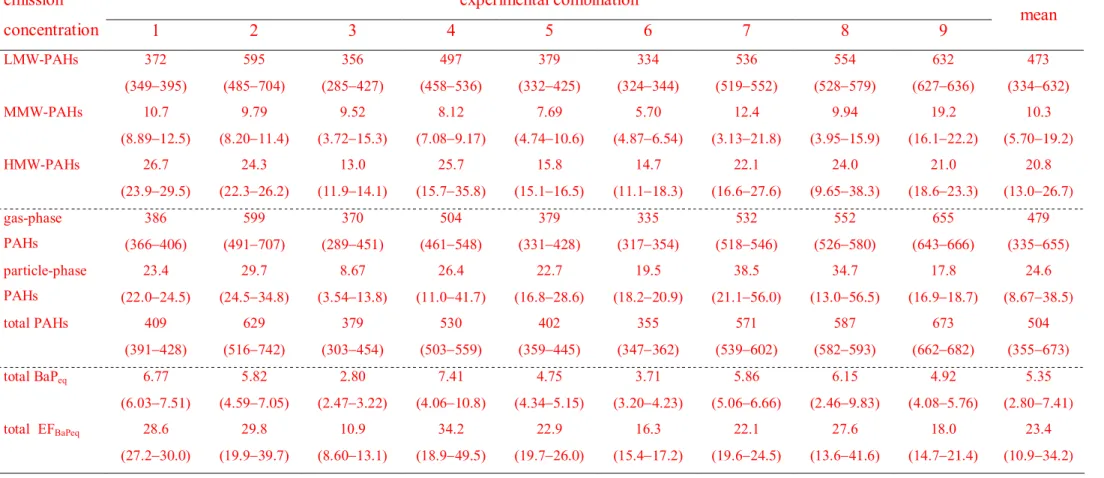
in sequence were NaP, AcPy, Flu, PA and Acp. Table 2 further classifies the above concentrations into 23
LMW-, MMW-, and HMW-PAHs, gas- and particle-phase PAHs, total PAH, and total BaPeq
24
9
concentrations. The mean total PAH and BaPeq concentrations were 504 μg/Nm3 (range = 355673 1
μg/Nm3) and 5.35 μg/Nm3 (range = 2.807.41 μg/Nm3), respectively. The total PAHs was mostly 2
contributed by gas-phase PAHs (mean = 479 μg/Nm3) accounting for 95.1% (range = 93.297.7%) 3
emissions of total PAHs. The LMW-PAHs was the most dominant PAH homologue (mean = 473 4
μg/Nm3) accounting for 93.8% (range = 90.994.6%) emissions of total PAHs. Because of the high 5
volatility of LMW-PAHs, the above results further confirm that most PAHs were in the form of the gas 6
phase. In contrast, the MMW- and HMW-PAHs, although were know with higher carcinogenic 7
potencies, were the least and second least dominant homologues (mean = 10.3 and 20.8 μg/Nm3, 8
respectively) accounting respectively for 2.04% and 4.13% (range = 1.532.85% and 3.126.52%, 9
respectively) emissions of total PAHs. Table 2 also shows the emission factor of total BaPeq (total 10
EFBaPeq) for each combination. We found that the mean total EFBaPeq for the nine selected experimental 11
combinations was 23.4 μ /kg-feedstockg (range = 10.934.2 μ /kg-feedstock). Due to the intrinsic g 12
differences in flow rate, sintering time and charging weight of the nine selected experimental 13
combinations, it should be noted that the trend in magnitude of total EFBaPeq was somewhat different 14
from that of total BaPeq concentrations. The above result clearly indicates the importance of using total 15
EFBaPeq to determine the optimal combination for reducing PAH emissions from the sintering process.
16
Comparison of PAH Characteristics and Concentrations between This Sinter Pot and Sinter 17
Plants. Table 3 shows PAH characteristics (including profile, homologue distributions, particle- (sinter 18
pot = 4.3%; sinter plant = 6.7%) and gas-phase (sinter pot = 95.7%; sinter plant = 86%) distribution) 19
and concentrations (including mean total concentration (sinter pot = 504 μg/Nm3; sinter plant = 778 20
μg/Nm3) and EFPAHs (sinter pot = 2364 μg/kg-feedstock; sinter plant = 3160 μg/kg-feedstock)) obtained 21
from the present study and real-scale sinter plants (7, 31). We found above both results were 22
comparable indicating our results could be representative of iron metallurgy.
23
S/N Ratios and ANOVA Analysis. In this study, the total EFBaPeq obtained from the nine selected 24
experimental combinations were used to calculate S/N ratio. The S/N ratios of the four selected 25
10
parameters in three designated levels according to the orthogonal array of the experimental arrangement 1
were presented in SI Table S4. We found that the resultant S/N ratios fell to the range from –20.5 to – 2
29.7 dB. SI Table S5 shows mean S/N ratios of the four selected parameters in each of their three 3
designated levels. For each selected parameter, the difference between maximum S/N ratio and its 4
corresponding minimum S/N ratio (i.e., max–min) represents the effect of the given parameter on 5
determining total EFBaPeq. Based on this, we found that the effects in sequence for the four selected 6
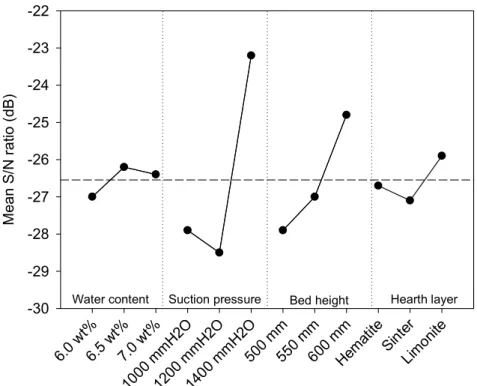
parameters on total EFBaPeq were: Ps (5.29 dB), Hb (3.07 dB), HL (1.14 dB) and Wc (0.81 dB). Figure 2 7
shows the trend of the resultant S/N ratios for each selected parameters at the three designated levels 8
affecting total EFBaPeq. Both Ps and HL shared the same trend in their resultant S/N ratios (i.e., first 9
decreased then increased). The above trend was different from that of Wc (i.e., first increased then 10
decreased) and Hb. The combination of Wc (= 6.5 wt %), Ps (= 1400 mmH2O), Hb (= 600 mm), and 11
HL (= limonite) were found with the highest S/N ratio for each of the four selected parameters, and 12
hence was considered as the optimal operation condition for reducing PAH emissions.
13
In this study, the ANOVA analysis was used to prioritize effects of the four selected parameters on 14
determining total EFBaPeq. The result shows that Ps (p < 0.01) and Hb (p = 0.021) were the significant 15
parameters accounting for 70.9% and 21.2%, respectively, of the total contribution of the four selected 16
parameters (SI Table S6). The above result was consistent with that found inprevious studies (14, 15, 17
19, 32). Thomas et al., (14) and Ledesma et al. (32) have indicated that PAH compounds decreased at 18
high oxygen concentrations (i.e. high air supply passing through combustion zone during sintering 19
process), in accordance with their destruction by oxidation. The high Hb was close to ignition hood that 20
might result in a wider melting/combustion zone in the sinter bed, leading to more complete coke 21
combustion and less PAH formations during the sintering process (15, 19). For the result of Wc, 22
although the effect was not significance (p = 0.665), it should be noted that the optimal Wc found at the 23
middle level (i.e., 6.5 wt %) might be worth further discussion. Kasai et al. (33) and Haga et al. (34) 24
have indicated that the increase of Wc in sinter raw mixtures could increase the permeability of 25
sintering bed and combustion efficiency (due to the abundant coke breezes and limestone fines coating 26
11
on the surface of particles), and hence results in reducing PAH formations during sintering processes.
1
On the other hand, Gulyurtlu et al. (35) have indicated that the high level of water content could result 2
in local quenching of the combustion reactions, which in turn could lead to PAH formations. Based on 3
these, it is not so surprising to see that the lowest total EFBaPeq was found at the middle level (i.e., 6.5 wt 4
%) rather than at 6.0 wt % or 7.0 wt %. For the type of HL, we found that the use of limonite could 5
slightly decrease total EFBaPeq in comparison with the use of sinter as the HL of the sinter pot, although 6
the above effect was not significance (p = 0.467). Cieplik et al. (13) have indicated that limonite could 7
exhibit higher potent catalytic activity of oxidation than that of hematite. However, Guélou et al. have 8
reported that Fe content might play an important role in catalytic oxidation of carbon monoxide, and the 9
higher Fecontent might result in the less PAH formations (36). The above inference is consistent with 10
what we have found in the three selected types of HL in their Fecontents (i.e., hematite (64.1%) 11
limonite (63.3%) > sinter (58.1%)). Nevertheless, the insignificant effect associated with the types of 12
HL used in this study might mainly because the depth of the HL was too thin to have sufficient reaction 13
time for the formation of PAHs during sintering process. In addition, it should be noted that other 14
physical parameters of HL, such as the particle size and porosity, could also be important factors 15
affecting PAH formations. Therefore, the net effect of HL on PAH formations warrants the needs for 16
further research in the future.
17
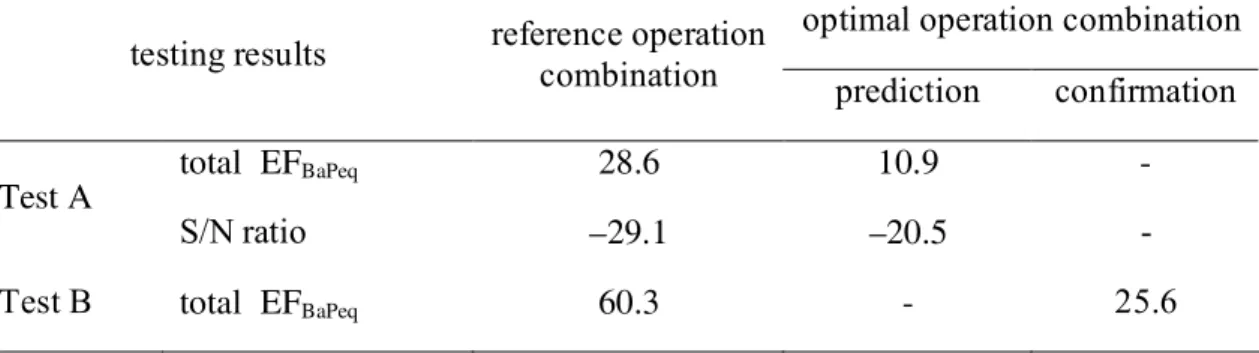
Comparison PAH emissions between the Reference and the Optimal Operation Combination.
18
Table 4 shows the total EFBaPeq and the S/N ratio obtained from the reference combination (i.e, Wc = 19
6.5 wt %, Ps = 1200 mmH2O, Hb = 550 mm, and HL = sinter) and the resultant optimal combination 20
(i.e., Wc = 6.50 w%, Ps = 1400 mmH2O, Hb = 600 mm, and HL = limonite). The total EFBaPeq and its 21
corresponding S/N ratio for the reference combination were found as 28.6 μ /kg-feedstock and 29.1 g 22
dB, respectively. For the predicted optimal combination, its total EFBaPeq and S/N ratio (predicted based 23
on the SI eq 4) were found as 10.9 μ /kg-feedstock and 20.5 dB, respectively. The difference in the g 24
above two S/N ratios (= 8.6 dB) indicating that the use of the optimal combination would result in a 25
12
decrease in total EFBaPeq up to 61.9% in comparison with the reference combination. For confirmation 1
purpose, experiments (n = 2) were conducted as using Test B-sintering raw mixture based on the 2
specification of the reference combination and the resultant optimal combination. The resultant mean 3
total EFBaPeq obtained from the reference combination and the confirmation combination were found as 4
60.3 and 25.6 μ /kg-feedstock, respectively (Table 4). The decrease EFg BaPeq from the reference 5
combination to the optimal combination (confirmation experiments) was up to 57.6% (range = 6
54.360.8%). The above similar decreases in total EFBaPeq further confirm the applicability of the 7
obtained optimal combination for reducing PAH formations during the sintering process.
8
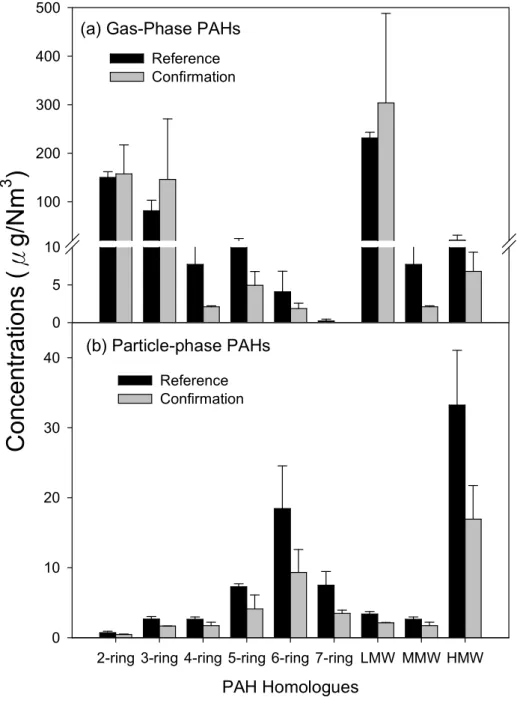
Figure 3 shows PAH concentrations (including 2- to 7-ringed PAHs, and LMW- MMW- and HMW- 9
PAHs in the particle- and gas-phase, respectively) obtained from the sinter pot operated under the 10
reference combination and the optimal combination for the confirmation purpose. While operated under 11
the optimal combination, gas-phase MMW- and HMW-PAH concentrations decreased significantly (=
12
72.9% and 67.4%, respectively) in comparison with that of the reference combination. In contrast, gas- 13
phase LMW-PAHs increased up to 31.2%. The above results might be because MMW- and HMW- 14
PAHs were much easier to be cleaved into LMW-PAHs under the optimal combination than that of the 15
reference combination. For particle-phase PAHs, all selected PAH homologues (particularly for HMW- 16
PAHs) decreased consistently from the optimal to the reference combination. The above results indicate 17
that the use of the optimal combination could significantly reduce high molecular weight PAH 18
formations. Considering the formation mechanisms HMW-PAHs were similar to those of PCDFs 19
during the sintering process (37), our results might provide another solution to suppress PCDD/F 20
formations in the future.
21
Sinter Productivity and Sinter Strength of the Reference and Optimal Operation Combination.
22
Although the resultant optimal combination was able to reduce PAH emissions, it is important to 23
examine its impact on the sinter productivity and sinter strength for practical reason. In this study, we 24
found that the sinter productivity and sinter strength for the reference combination were 38.9 t/m2/day 25
13
and 71.1%, respectively. The above values were quite comparable to those found for the optimal 1
combination (=39.5 t/m2/day and 70.2%, respectively). Therefore, it is concluded that the use of the 2
optimal combination determined by the Taguchi experimental design for the sintering process could 3
effectively reduce PAH emissions without interfering with the quantity of its sinter products.
4
Acknowledgements
5
We thank the China Steel Corporation (CSC) in Taiwan for funding this research project. We also 6
thank the staffs at CSC for providing testing materials and facilities.
7
Supporting Information Available
8
Information about the details of Taguchi experimental design, sampling and analytical methods, 9
conditions, data analysis, six additional tables and one figure. This material is available free of charge 10
via the Internet at http://pubs.acs.org.
11
14
Literature Cited
1
(1). Coutant, R. W.; Brown, L.; Chuang, J. C.; Riggin, R. M.; Lewis, R. G. Phase distribution and 2
artifact formation in ambient air sampling for polynuclear aromatic hydrocarbons. Atmos.
3
Environ.t 1988, 22, 403–409.
4
(2). International Agency for Research on Cancer (IARC), Vol. 92 (in preparation), Polycyclic 5
Aromatic Hydrocarbons: Summary of Data Reported and Evaluation 2007.
6
http://monographs.iarc.fr/ENG/Meetings/92-pahs.pdf.
7
(3). Ravindra, K.; Sokhi, R.; Grieken, R. V. Atmospheric polycyclic aromatic hydrocarbons: Source 8
attribution, emission factors and regulation. Atmos. Environ. 2008, 42, 2895–2921.
9
(4). Marr, L. C.; Kirchstetter, T. W.; Harley, R. A.; Miguel, A. H.; Hering, S. V.; Hammond, S. K.
10
Characterization of Polycyclic Aromatic Hydrocarbons in Motor Vehicle Fuels and Exhaust 11
Emissions. Environ. Sci. Technol. 1999, 33, 3091–3099.
12
(5). Omar, N. Y. M. J., Abas, M. R. B., Ketuly, K. A., Tahir, N. M. Concentrations of PAHs in 13
atmospheric particles (PM-10) and roadside soil particles collected in Kuala Lumpur, Malaysia.
14
Atmos. Environ. 2002, 36, 247–254.
15
(6). Dyke, P. H.; Foan, C.; Fiedler, H. PCB and PAH releases from power stations and waste 16
incineration processes in the UK. Chemosphere 2003, 50, 469–480.
17
(7). Yang, H. H.; Lai, S. O.; Hsieh, L. T.; Hsueh, H. J.; Chi, T. W. Profiles of PAH emission from 18
steel and iron industries. Chemosphere 2002, 48, 1061–1074.
19
(8). Almaula, S. Polycyclic Aromatic Hydrocarbons from Steelmaking. Environ. Forensics 2005, 6, 20
143–150.
21
15
(9). Tsai, J. H.; Lin, K. H.; Chen, C. Y.; Ding, J. Y.; Choa, C. G.; Chiang, H. L. Chemical 1
constituents in particulate emissions from an integrated iron and steel facility. J. Hazard. Mater.
2
2007, 147, 111–119.
3
(10).Bjorseth A.; Ramdahl T. Handbook of Polycyclic Aromatic Hydrocarbons; Marcel Dekker:
4
New York, 1985.
5
(11).Maeda, T.; Fukumoto, C.; Matsumura, T.; Nishioka, K.; Shimizu, M. Effect of adding moisture 6
and wettability on granulation of iron ore. ISIJ Int. 2005, 45, 477–484.
7
(12).Kamijo, C.; Matsumura, M.; Kawaguchi, T. Sintering behavior of raw material bed placing large 8
particles. ISIJ Int. 2005, 45, 544–550.
9
(13).Cieplik, M. K.; Carbonell, J. P.; Munoz, C.; Baker, S.; Kruger, S.; Liljelind, P.; Marklund, S.;
10
Louw, R. On Dioxin Formation in Iron Ore Sintering. Environ. Sci. Technol. 2003, 37, 3323–
11
3331.
12
(14).Thomas S.; Wornat M. J. The effects of oxygen on the yields of polycyclic aromatic 13
hydrocarbons formed during the pyrolysis and fuel-rich oxidation of catechol. Fuel 2008, 87, 14
768–781.
15
(15).Mitterlehner, J.; Loeffler, G.; Winter, F.; Hofbauer, H.; Schmid, H.; Zwittag, E.; Buergler, T. H.;
16
Pammer, O.; Stiasny, H. Modeling and simulation of heat front propagation in the iron ore 17
sintering process. ISIJ Int. 2004, 44, 11–20.
18
(16).Imai, T.; Matsui, T.; Fujii, Y.; Nakai, T.; Tanaka, S. Oxidation catalyst of iron oxide suppressing 19
dioxin formation in polyethylene combustion. J. Mater. Cycles. Waste. Manag. 2001, 3, 103–
20
109.
21
(17).Nath, N. K.; Mitra, K. Optimisation of suction pressure for iron ore sintering by genetic 22
algorithm. Ironmak. Steelmak. 2004, 31, 199–206.
23
16
(18).Kawaguchi, T.; Kamijo, C.; Matsumura, M. The sintering behavior of raw material bed placing 1
large particles. Tetsu to Hagane 2006, 92, 779–787.
2
(19).Yang, W.; Choi, S.; Choi, E. S.; Ri, D. W.; Kim, S. Combustion characteristics in an iron ore 3
sintering bedevaluation of fuel substitution. Combust. Flame 2006, 145, 447–463.
4
(20). Higuchi, K.; Kawaguchi, T.; Kobayashi, M.; Hosotani, Y.; Nakamura, K.; Iwamoto, K.;
5
Fujimoto, M. Improvement of Productivity by Stand-support Sintering in Commercial Sintering 6
Machines, ISIJ Int. 2000, 40, 1188–1194.
7
(21). Kasai, E.; Harjanto, S.; Terui, T.; Nakamura, T.; Waseda, Y. Thermal remediation of PCDD/Fs 8
contaminated soil by zone combustion process, Chemosphere 2000, 41, 857–864.
9
(22).Harjanto, S.; Kasai, E.; Terui, T.; Nakamura, T. Formation and transport of PCDD/Fs in the 10
packed bed of soil containing organic chloride during a thermal remediation process, 11
Chemosphere 2002, 49, 217–224.
12
(23).Taguchi, G. Introduction to quality engineering: designing quality into products and processes;
13
Asian Productivity Organization: Tokyo, Japan, 1987.
14
(24).Yang, W. H.; Tarng, Y. S. Design optimization of cutting parameters for turning operations 15
based on the Taguchi method. J. Mater. Process. Tech. 1998, 84, 122–129.
16
(25). Yang, W.; Ryu, C.; Choi, S.; Choi, E.; Lee, D.; Huh, W. Modeling of combustion and heat 17
transfer in an iron ore sintering bed with considerations of multiple solid phases. ISIJ Int. 2004, 18
44, 492–499.
19
(26). Oyama, N.; Sato, H.; Takeda, K.; Ariyama, T.; Masumoto, S.; Jinno, T.; Fujii, N. Development 20
of coating granulation process at commercial sintering plant for improving productivity and 21
reducibility. ISIJ Int. 2005, 45, 817–826.
22
17
(27). Chen, Y. C.; Lee, W. J.; Uang, S. N.; Lee, S. H.; Tsai, P. J. Characteristics of polycyclic 1
aromatic hydrocarbon (PAH) emissions from a UH-1H helicopter engine and its impact on the 2
ambient environment. Atmos. Environ. 2006, 40, 7589–7597.
3
(28). Tsai, P. J.; Shih, T.S.; Chen, S. L.; Lee, W. J.; Lai, G. H.; Liou, S. H. Assessing the contents of 4
polycyclic aromatic hydrocarbons in the tollbooths of a highway toll station via direct and 5
indirect approaches. Environ. Sci. Technol. 2002, 36, 47485473.
6
(29). Iron ores − Determination of tumble strength, 3rd ed.; International Organization for 7
Standardization (ISO) 3271: Geneva, 1995.
8
(30). Tsai, P. J.; Shih, T. S.; Chen, S. L.; Lee, W. J.; Lai, G. H.; Liou, S. H. Assessing and Predicting 9
the Exposures of Polycyclic Aromatic Hydrocarbons (PAHs) and Their Carcinogenic Potencies 10
from Vehicle Engine Exhausts to Highway Toll Station Workers. Atmos. Environ. 2004, 38, 11
333343.
12
(31). Ooi, T. C.; Aries, E.; Ewan, B. C. R.; Thompson, D.; Anderson, D. R.; Fisher, R.; Fray, T.;
13
Tognarelli, D. The study of sunflower seed husks as a fuel in the iron ore sintering process.
14
Miner. Eng. 2008, 21, 167-177.
15
(32). Ledesma, E. B.; Kalish, M. A.; Nelson, P. F.; Wornat, M. J.; Mackie, J. C. Formation and fate of 16
PAH during the pyrolysis and fuel-rich combustion of coal primary tar. Fuel 2001, 35, 1801–
17
1814.
18
(33). Kasai, E.; Rankin, W. J.; Gannon, J. F. The effect of raw mixture properties on bed permeability 19
during sintering. ISIJ Int. 1989, 29, 33–42.
20
(34). Haga, T.; Ohshio, A.; Nakamura, K.; Kozono, T. Control technique of the melting reaction in 21
sintering process by the fine part selective granulation of clayish iron ores. Tetsu to Hagane 22
1997, 83, 103–108.
23
18
(35). Gulyurtlu, I.; Karunaratne, D. G. G. P.; Cabrita, I. The study of the effect of operating parameters 1
on the PAH formation during the combustion of coconut shell in a fluidised bed. Fuel 2003, 82, 2
215–223.
3
(36). Guélou, E.; Barrault, J.; Fournier, J.; Tatibouët, J. M. Active iron species in the catalytic wet 4
peroxide oxidation of phenol over pillared clays containing iron. Appl. Catal. B-Environ. 2003, 5
44, 1–8.
6
(37). Iino, F.; Imagawa, T.; Takeuchi, M.; Sadakata, M. De novo synthesis mechanism of 7
polychlorinated dibenzofurans from polycyclic aromatic hydrocarbons and the characteristic 8
isomers of polychlorinated naphthalenes. Environ. Sci. Technol. 1999, 33, 10381043.
9
Brief: Using the Taguchi experimental design to identify the optimal operating condition provides 10
useful approaches for reducing PAH formations during the iron ore sintering process.
11
Captions 12
Figures 13
FIGURE 1. The schematic of the pilot scale sinter pot and the illustration of its zone combustion 14
process 15
FIGURE 2. Mean S/N ratios of the four selected operation parameters at the three designated levels 16
FIGURE 3. PAH concentrations (including 2- to 7-ringed PAHs, and LMW- MMW- and HMW-PAHs 17
in the particle- and gas-phase, respectively) obtained from the sinter pot operated under the reference 18
combination and the optimal combination for confirmation purpose 19
Tables 20
TABLE 1. The contents of sintering raw mixture and its chemical compositions in Test A and Test B 21
19
TABLE 2. The mean (range) of LMW-, MMW-, and HMW-PAHs, gas- and particle-phase PAHs, total 1
PAH, and total BaPeq emission concentrations (μg/Nm3) in the flue gas of the nine designed 2
experimental combinations and their corresponding emission factors of total BaPeq (EFBaPeq; μg/kg- 3
feedstock) 4
TABLE 3. The comparison of PAH profiles, homologues, gas- and particle-phase distributions (range), 5
mean (range) total concentration and EFPAHs obtained from the present study with those data collected 6
from real-scale sinter plants.
7
TABLE 4. The emitted total EFBaPeq (μg/kg-feedstock) and its corresponding S/N ratio (dB) obtained 8
from the reference operation combination and optimal operation combination (including both predicted 9
and that obtained from the confirmation experiments) 10
20
FIGURE. 1 The schematic of the pilot scale sinter pot and the illustration of its zone combustion process
a. Ignition hood b. Pot body c. Raw mixture d. Hearth layer e. Windbox f. Thermocouple g. PAHs sampling hole h. Melting/combustion zone i. Dry zone
Suction air
a
b
c
d
e
f
g
h ii Sintered
zone
Wet zone
21
FIGURE 2 Mean S/N ratios of the four selected operation parameters at the three designated levels
Bed height
6.0 wt%
6.5 wt%
7.0 wt%
1000 mmH2O 1200 mmH2O
1400 mmH2O 500 mm
550 mm 600 mm
Hem atite
Sinter Limonite
Mean S/N ratio (dB)
-30 -29 -28 -27 -26 -25 -24 -23 -22
Suction pressure
Water content Hearth layer
22
FIGURE 3 PAH concentrations (including 2- to 7-ringed PAHs, and
LMW- MMW- and HMW-PAHs in the particle- and gas-phase, respectively) obtained from the sinter pot operated under the reference combination and the optimal combination for confirmation purpose
(a) Gas-Phase PAHs
C o n c e n tr a ti o n s ( μ g /N m
3)
0 5 10 100 200 300 400 500
Reference Confirmation
(b) Particle-phase PAHs
PAH Homologues
2-ring 3-ring 4-ring 5-ring 6-ring 7-ring LMW MMW HMW 0
10 20 30 40
Reference Confirmation
1
23 1
Table 1. The contents (wt %) of sintering raw mixture and its chemical composition (wt %)in Test A and Test B
Raw mixture iron
ore
coke breeze
anthracite serpentine marble slurry return finea
Mini- pellet
Test A 52.8 3.99 1.84 0.421 1.98 0.562 31.5 1.50
Test B 61.1 1.88 1.92 0.647 2.94 0.888 30.4 0.241
Chemical composition CaO MgO Al2O3 SiO2 FeO Total-Fe
Test A 9.38 1.44 1.66 4.79 8.51 57.5
Test B 9.31 1.16 1.80 2.80 6.72 58.2
a including return fine obtained from sinter plant and blast furnace; Test A: prediction experiments; Test B: confirmation experiments
24
Table 2. The mean (range) of LMW-, MMW-, and HMW-PAHs, gas- and particle-phase PAHs, total PAH, and total BaPeq emission concentrations (μg/Nm3) in the flue gas of the nine designed experimental combinations and their corresponding emission factors of total BaPeq ( EFBaPeq; μg/kg- feedstock)
experimental combination emission
concentration 1 2 3 4 5 6 7 8 9 mean
LMW-PAHs 372
(349395)
595 (485704)
356 (285427)
497 (458536)
379 (332425)
334 (324344)
536 (519552)
554 (528579)
632 (627636)
473 (334632)
MMW-PAHs 10.7
(8.8912.5)
9.79 (8.2011.4)
9.52 (3.7215.3)
8.12 (7.089.17)
7.69 (4.7410.6)
5.70 (4.876.54)
12.4 (3.1321.8)
9.94 (3.9515.9)
19.2 (16.122.2)
10.3 (5.7019.2)
HMW-PAHs 26.7
(23.929.5)
24.3 (22.326.2)
13.0 (11.914.1)
25.7 (15.735.8)
15.8 (15.116.5)
14.7 (11.118.3)
22.1 (16.627.6)
24.0 (9.6538.3)
21.0 (18.623.3)
20.8 (13.026.7) gas-phase
PAHs
386 (366406)
599 (491707)
370 (289451)
504 (461548)
379 (331428)
335 (317354)
532 (518546)
552 (526580)
655 (643666)
479 (335655) particle-phase
PAHs
23.4 (22.024.5)
29.7 (24.534.8)
8.67 (3.5413.8)
26.4 (11.041.7)
22.7 (16.828.6)
19.5 (18.220.9)
38.5 (21.156.0)
34.7 (13.056.5)
17.8 (16.918.7)
24.6 (8.6738.5)
total PAHs 409
(391428)
629 (516742)
379 (303454)
530 (503559)
402 (359445)
355 (347362)
571 (539602)
587 (582593)
673 (662682)
504 (355673) total BaPeq 6.77
(6.037.51)
5.82 (4.597.05)
2.80 (2.473.22)
7.41 (4.0610.8)
4.75 (4.345.15)
3.71 (3.204.23)
5.86 (5.066.66)
6.15 (2.469.83)
4.92 (4.085.76)
5.35 (2.807.41) total EFBaPeq 28.6
(27.230.0)
29.8 (19.939.7)
10.9 (8.6013.1)
34.2 (18.949.5)
22.9 (19.726.0)
16.3 (15.417.2)
22.1 (19.624.5)
27.6 (13.641.6)
18.0 (14.721.4)
23.4 (10.934.2)
25 1
Table 3. The comparison of PAH profiles, homologues, gas- and particle-phase distributions 2 (range), mean (range) total concentration and EFPAHs obtained from the present study with those data collected from real-scale sinter plants.
PAH emission results Sinter plants (7, 31) This study the most abundant
compounds
NaP, Ant, AcPy, FL, Flu;
1NaP, PA, Flu, Fl, Pyr
NaP, AcPy, PA, Flu, FL
homologue in order 2-ring > 3-ring > 4-ring > 5- ring > 6-ring > 7-ring
2-ring > 3-ring > 4-ring > 5- ring > 6-ring > 7-ring gas- and particle-phase
PAHs distribution (%)
Gas = 86 (7896) Particle = 6.7 (1.312.1)
Gas = 95.7 (93.598.4) Particle = 4.3 (1.636.45) avg. total PAHs (μg/Nm3) 778 (5551001);
1277
504 (355673)
avg. total EFPAHs
(EFPAHs; μg/kg-feedstock)
3160 (24994245) 2364 (10363616)
1 ref. (31)
26 1
2
3
Table 4. The emitted total EFBaPeq (μg/kg-feedstock) and its corresponding S/N ratio (dB) obtained from the reference operation combination and optimal operation combination (including both predicted and that obtained from the confirmation experiments).
optimal operation combination testing results reference operation
combination prediction confirmation
total EFBaPeq 28.6 10.9 -
Test A
S/N ratio –29.1 –20.5 -
Test B total EFBaPeq 60.3 - 25.6