DRIVER BEHAVIOR UNDER THE GREEN SIGNAL COUNTDOWN INFORMATION
11
0
0
全文
(2) decision-making of drivers in response to the onset of amber. These factors would include driver attitude and emotional state, crossing ability before red, consequence of stopping and not stopping, interactive behavior with other drivers, vehicle approaching speed and distance from stop bar, etc,. Since most of the intersection accidents happened during the signal transitional period, researchers had been trying several strategies, such as prolonging amber phase or providing flash amber/green light before red, to reduce the risk of collisions. Yet, a satisfactory solution has not been achieved((1),(5) and (8)). The Green Signal Countdown Devices (GSCD) is a driver assistant mechanism to inform drivers the residual seconds of green light ((6), (7)). The usefulness of such warning indicator is based on the logic assumption that if drivers have advance information of the green light termination, their decision would be easier and predictive. Besides, drivers can also make use of the countdown timing to avoid being trapped in the dilemma zone by either slowing down or speeding up their vehicles. GSCD had been widely deployed in Thailand, China, Taiwan and Southeast Asia cities. In Taiwan, such devices arouse enormous debates between the pros and cons. The supporters thought that GSCD can dramatically reduce the possibility of red running and hence lower the opportunities of side-collisions. On the other hand, opponents proposed that that GSCD will increase rear-end collisions between longitudinal drivers making different stop/go decisions ((2),(3) and (4)). In order to acquire fully understanding of driver’s reactions and interactions with/without GSCD information or information type, an in-depth study of the GSCD is necessary.. RESEARCH METHOD EXPERIMENTAL SITE Since there are many factors influencing driver’s behavior during signal transition period, a field experimental analysis with different GSCD scenarios may provide more convincing evidence than computer simulators do. In this study, a T-type signalized intersection in a suburban arterial in Kaohsiung city is chosen as the test site. The intersection signal of the test site is operated under fixed signal scheme and its upstream and downstream intersections are away form the test site (more than 300m), therefore can provide an undisturbed environment for experiment. The approach of the test site is composed of 3 lanes (1 median express lane for straight and left turning cars, one middle express lane for straight cars, and 1 slow traffic lane separated from express lanes by the traffic divider). Motorcycles are prohibited driving in the express 2.
(3) lanes. Being restricted by the geographic environment, drivers approaching to the test site must go forward or left turn. If the driver wants left turn, he/she must enter the added left turn lane and wait for the acceptable gap of the opposite traffic. Thus simplify the middle express lane function to merely provide the straight traffic through the intersection. Traffic in the test site is heavy. There are about 11,500 passing vehicles recorded every day in the approach direction. Daily signal scheme is designed into two parts. The first part is a regular green-amber-red sequence scheme with 100 sec. cycle length from 06:00 to 23:00. The phase one (for the main arterial) is 65sec. which includes 59 sec. green period, 4 sec. amber period and 2 sec. all-red period. The phase two length (for the side road) is 35 sec. (29 sec., 4 sec., and 3 sec. respectively). Since the traffic volume is low in the midnight, the second part of the signal scheme is operated under flash amber/red light from 23:00 until 6:00 next morning. The daily traffic composition of the test approach includes motorcycle (50%), auto (46%) and large vehicle (bus/ truck, 4%). The GSCD device is a standard two-digit, each character is 50cm x 26cm in scale, LED display panel. The panel is mounted on the near-side signal rod of the test site and closed to the signal lamp case. Upstream approaching drivers can easily observe the residual seconds of the GSCD information above 250m away.. HIGH ACCURACY DATA RECORDER One of the main challenges of this study is to design an efficient, precise and convenient tool to collect large amount of traffic flow data near the stop bar area. After a complete literature review and interviews with experienced engineers, it found that existing traffic and signal data recording tools cannot fulfill the requirements of experimental tests. A high accuracy data recorder system was thus developed particularly to record the passing vehicles’ characteristics and signal phase data simultaneously. The integrated data recorder system is composed of an improved radar vehicle detector Smart Sensor SS125HD from Wavetroix Inc., a computerized signal controller ATC-72 from Taiwan Signal Corp, and an electronic data logger. Compared with the inductive loop detector and video camera technology, the radar wave detector technology can provide following benefits: (1) Detection unit can be deployed on the roadside and more easily to maintain or relocate. (2) An advanced radar detector can provide a better resolution capability to distinguish moving objects within 50 cm apart and detect objects within 250 ft. wide range (about 10 lanes) at the same time without adding extra supporting equipments, and (3) Better penetrative capability in poor climate situation than visual detection technology. 3.
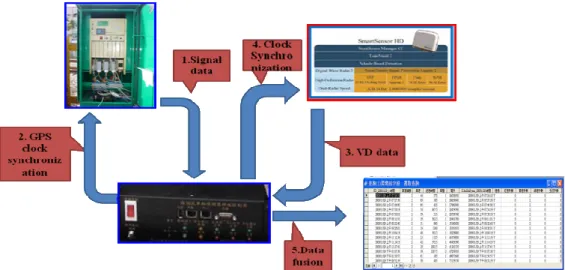
(4) The ATC-72 is embedded with the global positioning system (GPS) which enable the signal controller to recalibrate the clock periodically and execute the signal timing plan. The GPS clock of the signal controller can also synchronize with The Smart sensor HD and the data logger via RS232a data transmission port. To coordinate and integrate the data from different hardware units, a computer program is developed to synchronize the GPS clock time from signal controller with the vehicle detector. Once the vehicle passing through the Smart sensor detection region, the vehicle state characteristics, which include precise clock time, lane number, vehicle speed, vehicle’s length and occupancy time, will transmit and write down into the data logger in text file format. The controller status, which includes approach no., light type, phase lapse and GPS clock time, are also written down into the data logger by the frequency of each second. Finally, the data files are transmitted into the ACCESS database software for data fusion and analysis usage. Figure 1 shows the data recorder configuration and its information procession flow.. Fig.1: data recorder configuration and information procession flow. SECNARIOS DESIGN Including the background status, 5 scenarios are tested and analyzed in this study: (1) Scenario A: Signal operated with no GSCD information. Data collected in this scenario is to exhibit the original status of state and for providing a compare basis. (2) Scenario B: Fully GSCD count down information. The count down information was displayed from the green light onset to the last second of the green phase, but display no information during the amber and red light phase. 4.
(5) (3) Scenario C: Partial GSCD count down information. The count down information was displayed during the last 6 seconds of the green light phase. The interval of 6 seconds was chosen because it shall include almost all vehicles in the dilemma zone. (4) Scenario D: Partial GSCD count down information with last 9 seconds green light. The interval of last 9 seconds was chosen in order to compare the difference with respect to Scenario C. Under this scenario, drivers can achieve the countdown information during the final stage of green middle period. (5) Scenario E: Fully GSCD count down information but except the last 6 seconds green light. The count down information was displayed from the green light onset until the last 6 seconds of the green phase. Since the driver behavior in the median lane and low traffic lane could be impacted by the left turn traffic movement, only the traffic data in the middle lane of the approach was colleted in this study.. ANALYSIS METHOD Passing Vehicles were grouped into seven subsets which we are interested in this study (refer to fig.2 ), included: 1. Green light start period This period comes from the green light onset to the 7th sec. In this stage, the queuing platoon start to dissipate and the passing vehicle speed increase upward. 2. Green light middle period Following the green light starting stage to the 53th sec., the platoon approaching the intersection in this time period can maintain a more stable flow speed. 3. Green light final period This is the final stage of the green phase which comes from about 6 sec. before the amber onset to the end of the green phase. 4. Amber period This period includes whole 4 sec. amber phase. Drivers approaching the stop bar in this transitional period need to make decision to go and clear the intersection or stop before the stop bar. Since GSCD information may provide useful clues to drivers’ stop/go decision, the data collected in this period is thus further be split into two parts (front half 2 sec. and final half 2 sec. periods) for more detail analysis. 5. Red light start period This period comes from the red light onset to the 3rd sec. of the red phase. Because most of the red running vehicles happened just behind the end of the green phase, data collected in 5.
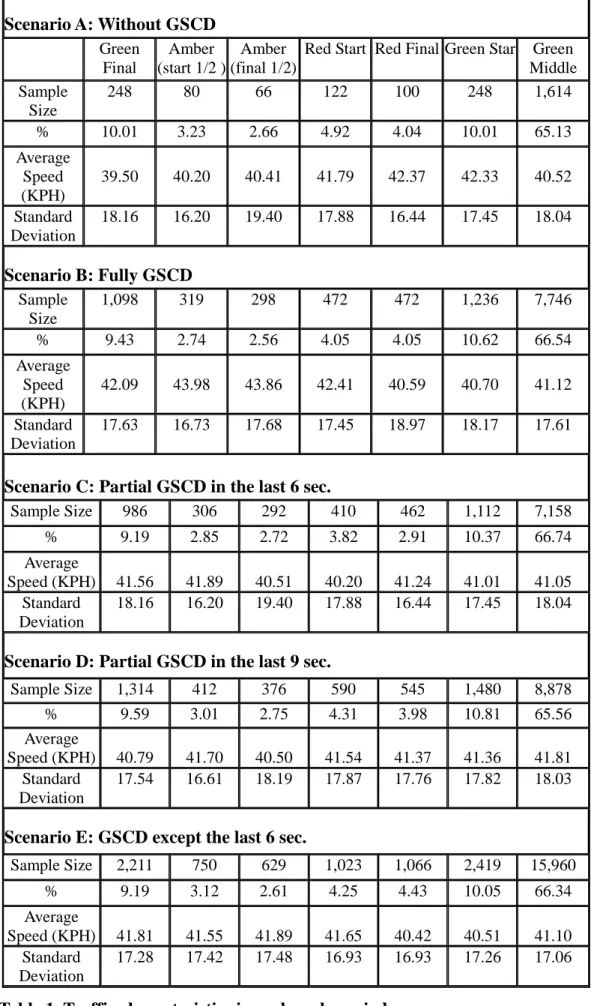
(6) this period can be check to see whether GSCD information can change drivers’ behavior on red running. 6. Red light final (advancing running stage) At the final stage of the red phase, drivers waiting behind the stop bar have the tendency to run the red before the green light onset.. Amber Phase. Green Phase. Red Phase. 2S 2S 6S. 7S. 3S. S. 3S. S Red Final Stage. Red Start Stage. Amber Final Stage Amber Start Stage. Green Final Stage. Green Middle Stage. Green Start Stage. Fig.2 Subgroup category in the signal cycle. Since each subgroup represents a specific combination of driving and lighting situation, the statistics of the subsets in each scenario then can be calculated and analyzed. The mean and variance of spot speed for each subgroup can be compared with each other and among scenarios. Besides, the statistical inference of the mean difference between compared sampling is also tested.. RESULTS 1.A total of 750,411 data from all 5 scenarios in 95 days are recorded. There are 91,902 target vehicles data (auto, middle lane and inbound direction) filtered from the original data base in the experimental approach. 2.Table 1 shows the results of the traffic characteristics of each scenario. The scope of the mean speed of sub-groups for different scenarios extent from 39.5 KPH (scenario A, Green final period) to 43.98 KPH (scenario B, Amber start period). The standard deviation extent from 16.20 to 19.40 KPH (scenario A, Amber start period & Amber final period).. 6.
(7) Scenario A: Without GSCD. Sample Size % Average Speed (KPH) Standard Deviation. Green Final 248. Amber Amber Red Start Red Final Green Star Green (start 1/2 ) (final 1/2) Middle 80 66 122 100 248 1,614. 10.01. 3.23. 2.66. 4.92. 4.04. 10.01. 65.13. 39.50. 40.20. 40.41. 41.79. 42.37. 42.33. 40.52. 18.16. 16.20. 19.40. 17.88. 16.44. 17.45. 18.04. Scenario B: Fully GSCD Sample Size % Average Speed (KPH) Standard Deviation. 1,098. 319. 298. 472. 472. 1,236. 7,746. 9.43. 2.74. 2.56. 4.05. 4.05. 10.62. 66.54. 42.09. 43.98. 43.86. 42.41. 40.59. 40.70. 41.12. 17.63. 16.73. 17.68. 17.45. 18.97. 18.17. 17.61. Scenario C: Partial GSCD in the last 6 sec. Sample Size. 986. 306. 292. 410. 462. 1,112. 7,158. %. 9.19. 2.85. 2.72. 3.82. 2.91. 10.37. 66.74. Average Speed (KPH) Standard Deviation. 41.56 18.16. 41.89 16.20. 40.51 19.40. 40.20 17.88. 41.24 16.44. 41.01 17.45. 41.05 18.04. Scenario D: Partial GSCD in the last 9 sec. Sample Size. 1,314. 412. 376. 590. 545. 1,480. 8,878. % Average Speed (KPH) Standard Deviation. 9.59. 3.01. 2.75. 4.31. 3.98. 10.81. 65.56. 40.79 17.54. 41.70 16.61. 40.50 18.19. 41.54 17.87. 41.37 17.76. 41.36 17.82. 41.81 18.03. Scenario E: GSCD except the last 6 sec. Sample Size. 2,211. 750. 629. 1,023. 1,066. 2,419. 15,960. %. 9.19. 3.12. 2.61. 4.25. 4.43. 10.05. 66.34. Average Speed (KPH) Standard Deviation. 41.81 17.28. 41.55 17.42. 41.89 17.48. 41.65 16.93. 40.42 16.93. 40.51 17.26. 41.10 17.06. Table 1. Traffic characteristics in each cycle period 7.
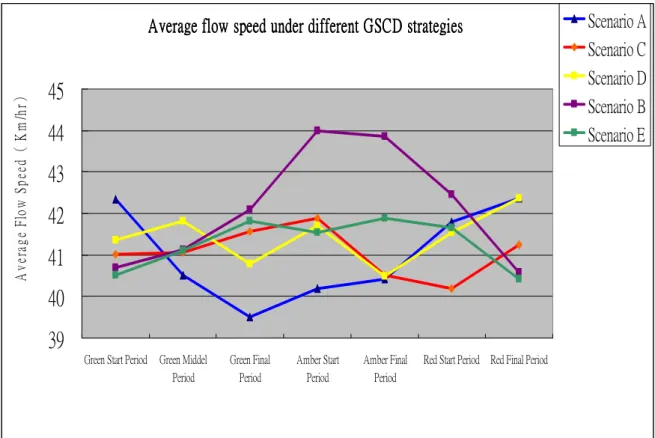
(8) 3.The average flow speed in different transitional periods for scenarios A to E are plotted in the Figure 3. We can find that the graph in scenario A shows a “V” shape speed transitional variations in the transitional period. Whereas, scenario B displays a total different situation: a counter “V” shape graph. The average speeds of Scenario C, D and E are almost within the scope enveloped by the Scenario A and B.. A v e ra g e F lo w S p e e d ( K m /h r). Average flow speed under different GSCD strategies. Scenario A Scenario C Scenario D. 45. Scenario B Scenario E. 44 43 42 41 40 39 Green Start Period Green Middel Period. Green Final Period. Amber Start Period. Amber Final Period. Red Start Period Red Final Period. Fig. 3 Average speed distribution during the signal transitional period 4. Statistic tests for difference of the average speed value inference A simple statistical t-test for the average speed value of scenario A with others scenarios are conducted. The purpose of these statistical tests is to make sure there is mean speed difference between scenarios in relative time periods with/without GSCD information. Beside, another t-test is conducted between scenario C and D to find out whether the difference exists between GSCD with last 6 and 9 seconds. The hypothesis is described in the following expression, the confidence intervalα= 0.10. where: H0 : μ1 =μ2. no difference of the subgroup average speed between scenarios A and other scenario. μ1≠μ2 others, H1 : 8.
(9) The results of the hypothesis tests show that drivers under different GSCD information strategies present one to several significant different behaviors in subgroups with respect to drivers without GSCD information.. DISCUSSIONS There are some interesting findings can be drawn from this experiment test. Firstly, if without GSCD information, drivers will reduce their speed near the final period of the green light, then accompany with the behavior of accelerating their speed during the whole amber period. This phenomenon is reasonable. Because in the final green period, approaching drivers will feel more comfortable as he/she can almost believe that his/her vehicle will smoothly pass the stop bar without be bothered by the red light (or even the amber light). Therefore, he/she will more likely to maintain or not to increase the vehicle speed. While after the amber light starts, approaching drivers are forced to make a decision to pass (and clear the intersection) or not to pass (and stop their vehicle before the stop bar). Under this situation, the average passing speed will grow quicker as the passing time close to the red light start. Secondly, among all GSCD scenarios, the average vehicle speed under fully GSCD information (Scenario B) has the highest value. These higher average speeds are consistent with previous studies. Under fully GSCD information, drivers can easily capture the exact impeding amber light onset timing and maneuver their vehicles with more confident. Since drivers can effectively utilize the final seconds of the green light period, their maneuver (to pass the stop bar) will tend to induce unconsciously higher speeds. Thirdly, drivers with GSCD information tend to make up their passing decision earlier than without GSCD. Even the GSCD information blacks out in the last 6 sec. green light period (Scenario E), drivers can also take the benefits to predict the emerging of light change. While in other non-green-light-transitional periods (green start, green middle, red final), there are no significant speed difference exist among scenarios. These findings imply that the GSCD information has minor impact in the non-green-light-transitional periods. Fourthly, compared with scenario A (without GSCD), drivers under partial GSCD information, such as scenario E, can maintain a more stable passing speeds during the green light transitional periods. These partial GSCD information strategies can not only provide drivers to make stop/go easily, but also can reduce the possibility of speeding their vehicles in the green light transitional periods (and the collision possibility comes from the red running maneuver). These special phenomena can provide experts a new viewpoint to rethink the benefits of the GSCD. 9.
(10) Finally, there are no obvious behavior differences in the transitional period between scenario C and D. Although a minor (< 2%) speed higher for scenario D in green middle period is recorded. Because in scenario D, the GSCD information displays in the final seconds of green middle period and advance 3 sec. than that of scenario C, it is reasonable to inference that drivers in scenario D will react (and speed up) more advance than that in scenario C.. CONCLUSIONS In this experiment, we can conclude that the GSCD information will provide drivers as a leading signal transitional warning. Although drivers under fully GSCD information tend to speed up their average speed during the final stage of the transitional period, which means such strategy maybe not a suitable and safe tool for driver’s driving decision support. But we also find drivers under other situations, such as the GSCD except the last 6 sec. scenario, have a more stable speeds change behaviors during signal transitional period. Therefore, compared with drivers without GSCD information, a well fine-tuned GSCD information strategy can not only provide drivers better information service in stop/go decision making but also eliminate the unstable speeds variation during the light transitional period.. ACKNOWLEDGEMENT This article is partially funded by the National Science Council, Taiwan under the research grant NSC 98-2221-E-006-153 -MY3.. REFERENCES (1) Allos, E. A. and Al-Hadithi, I. M. (1992), “Driver behaviour during onset of amber at signalized junction,” Traffic Engineering and Control, Vol.33, No.5, pp.312-317. (2) Chan, Shan-Bin (2004). “Effects of traffic signal count-down displays on driver behaviors.” Master thesis, Department of Transportation Technology and Management, National Chiao Tung University, Taiwan, R.O.C. (3) Chang, Chien-Hua (2008). “A study on driving behaviors at the intersections with traffic signal countdown displays.” Master thesis, Institute of Traffic and Transportation College of Management, National Chiao Tung University, Taiwan, R.O.C. (4) Hsu, Min-Chuan (2007). ”A study on ordered straight vehicles microscopic discharging models at the signalized intersection.” Master thesis, Institute of Traffic and Transportation College of Management, National Chiao Tung University, Taiwan, R.O.C. (5) Köll, K., Bader, M. and Axhausen, K.W. (2004), ”Driver behaviour during flash green before amber: a comparative study,” Accident Analysis and Prevention, Vol. 36, No.2, 10.
(11) pp.272-280. (6) Lum, K. M. and Wang, Y. D. (2003), “A before–and-after study of driver stopping propensity at red light camera intersections,” Accident Analysis and Prevention, Vol. 35, No.1, pp.111-120. (7) Lum, K. M. and Halim, H. (2006), ”A before-and-after study on green signal countdown device installation,” Transportation Research Part F, Vol.1 , No.9, pp.93-41. (8) Newton, C., Mussa, N. R., Sadalla, K. E., Burns K. E. and Matthias, J. (1997),“Evaluation of an alternative traffic light change anticipation system,” Accident Analysis and Prevention, Vol. 29, No.2, pp.201-209. (9) Sheffi, Y. and Mahmassani, H. (1981), “A model of driver behavior at high speed signalized intersections”, Transportation Science 15, pp.50-61.. 11.
(12)
數據
相關文件
•providing different modes of support in learning tasks (e.g.. You are a summer intern in the publicity team of Go Green, a non- governmental organisation committed to
In view of the large quantity of information that can be obtained on the Internet and from the social media, while teachers need to develop skills in selecting suitable
Recent Preliminary Inspection to the Schools completed with Green Roof before handover to SSB but currently not maintained by ArchSD... Green Roof –
Official Statistics --- Reproduction of these data is allowed provided the source is quoted.. Further information can be obtained from the Documentation and Information Centre
The compilers of the biographies of monks not only wrote about the crucial life experiences of these eminent monks, but also revealed wonderful affi nities that brought them
The IEC endeavours to ensure that the information contained in this presentation is accurate as of the date of its presentation, but the information is provided on an
• You can make good use of this opportunity and become more aware of the importance of teaching information texts with an explicit emphasis on understanding the features of academic
The revelations of this study would also provide the much needed and useful information that will help traditional higher education institutions to formulate
