An Optimal Control Model for Traffic Corridor Management
Ta-Yin Hu
Department of Transportation and Communication Management Science.
National Cheng Kung University, No.1, Ta-Hsueh Road, Tainan 701, Taiwan, R.O.C.
TEL: 886-6-2757575-53224, FAX: 886-6-2753882, E-mail: [email protected] Tung-Yu Wu
Department of Transportation and Communication Management Science.
National Cheng Kung University, No.1, Ta-Hsueh Road, Tainan 701, Taiwan, R.O.C.
TEL: 886-6-2757575-53271-5010, E-mail: [email protected]
ABSTRACT
Traffic congestion arises in metropolitans are common problems due to insufficient traffic facilities and major bottlenecks occur on main urban arterials, freeways and expressways.
This research aims at proposing an optimal control model for corridor management, including freeway segments, on-ramps, off-ramps, and arterial streets, to relieve possible congestion.
Traffic control strategies for corridor management include ramp metering, signal control, and route guidance. Based on the concept of the store-and-forward method, the problem is formulated as a linear optimal control model; and the objective function is to minimize total queue length for considered traffic corridors. Numerical experiments are conducted to illustrate the proposed models.
INTRODUCTION
Due to the rapid growth of private vehicles, the large number of vehicles causes serious traffic jams along many major traffic corridors. Many traffic management centers design different strategies, such as infrastructure extension and integrated corridor management, to improve the traffic service quality and relieve traffic congestions. Under the technology of intelligent transportation systems (ITS), the intelligent corridor management utilizes several control measures, including route guidance, ramp control and signal control, to improve the efficiency and enhance the service quality.
Integrated corridor management is becoming an important application in ITS. Several approaches have been developed for the design of control strategies based on ramp metering, variable message signs, freeway-to- freeway control, and coordination between arterial streets and freeways. These approaches include expert systems, fuzzy systems, neural networks, and classical feedback control. Among these approaches, solutions obtained from the
optimal control methods provide control decisions based on the explicit minimization of a suitable control criterion.
Papageorgiou (1995) developed a linear optimal control model for traffic corridors and the concept of the optimal control model is derived from the store-and-forward model (Gazis, 2002). The store-and-forward method is used to manage the dynamic traffic corridor under saturated traffic conditions situation.
This research proposes a modified optimal control model for integrated corridor management based on the store-and-forward method. The route allocation is implicitly introduced in the formulation to incorporate the concept of route guidance. The objective is to minimize total queue length for the corridor.
A brief review of the linear optimal control models is presented in the next section. The proposed framework and associated modeling issues are then presented in Section 3.
Numerical experiment design and results are discussed in Sections 4 and 5, followed by concluding comments.
LITERATURE REVIEW
Integrated corridor management is becoming an important application in ITS. Several approaches have been developed for the design of control strategies based on ramp metering, variable message signs, freeway-to- freeway control, and coordination between arterial streets and freeways. These approaches include expert systems, fuzzy systems, neural networks, and classical feedback control. Among these approaches, solutions obtained from the optimal control methods provide control decisions based on the explicit minimization of a suitable control criterion.
Based on a simplified traffic flow model, Moreno-Banos et al. (1993) proposed an integrated control strategy addressing both route guidance and ramp metering. Papageorgiou (1995) proposed a linear programming method for integrated control, including traffic signal control, route guidance and ramp metering. Diakaki et al. (1997) described a feedback approach with consideration of the overall network.
Kotsialos et al. (2002) proposed a generic formulation for designing integrated traffic control strategies for traffic corridor networks with the use of ramp metering, route guidance, and freeway-to-freeway control measures. The problem is formulated in the format of discrete-time optimal control and solved through a feasible-direction algorithm.
In the past, traffic control systems within corridor have been developed independently for each individual control measure attempting to optimize traffic flow on either freeway or urban
road network. However, a traffic corridor constitutes an entity in terms of operational objectives, user requirements and impact of individual control measures.
Haj-Salem et al. (1995) showed that ramp metering on a freeway may have a considerable impact on the adjacent road traffic. The store-and-forward approach is well suited for dynamic corridor queue management under saturated traffic conditions.
As the literatures shown above, the integration of integrated corridor management and ITS may be an important issue around the traffic management. Therefore, the optimization management could be a way to solve this problem. The following section will introduce the methodology of model formulation.
METHODOLOGY
The intelligent corridor management is modeled as a linear optimal control model based on the store-and-forward approach. However, route allocation is explicitly modeled as decision variables. The store-and-forward approach to traffic control problems was originally suggested by Gazis and Potts (1963) and have been utilized for the design of signal control systems.(Michalopoulos and Stephanopoulas, 1977a, 1977b).
The main objective of this research is to build an intelligent traffic management model. The objective function is equation (1).
Min
I j i
K
k j i
D x k
J
, 0
, ,I U,R,H (1)
The constraints of intelligent traffic management model are:
k x k
q k u k
xi,j 1 i,j i,j i,j (2)
I j
j i
i k x k
x , (3)
I j
i j
i k u k
q , (4)
I j
i j
i k u k
u , (5)
c k g k S
ui i ,f (6)
k r k H
o o k
ri 1 i i* out,i (7)
Hj Hj
Hj Hj
cr n
k k q
, (8)
1000
, ,
k k
oouti v d crHj
(9)
k r k
uRi i (10)
satRj
Rj k u
u , (11)
i
i k u
u max,
0 (12)
i
i k x
x max,
0 (13)
max ,
min g k g
g f (14)
where,
k
xi,j :In the time interval k, the queue length from section i to section j (veh),
k
qi,j :In the time interval k, the inflow from section i to section j (veh),
k
ui,j :In the time interval k, the outflow from section i to section j (veh),
k
xi :In the time interval k, the queue length of section i (veh),
k
qi :In the time interval k, the inflow of section i (veh),
k
ui :In the time interval k, the outflow of section i (veh), S :The saturated flow rate of section i , i
k
g,f :The effective green time of intersection at phase (second),
k
ri :In the time interval k, the metering rate of section i (veh),
*
oi :The target occupancy of ramp metering,
k
oout,i :In the time interval k, the occupancy of downstream section i , H :A parameter from calibration,
k
Hj
cr, :In the time interval k, the critical density of downstream section i , nHj:The number of lanes along the mainstream,
v:Average vehicle length (meter),
d:The length of detector (meter),
:A transform parameter betweenuRi k and ri k ,
Rj
usat, :The saturated flow rate of off-ramp j , umax,i:The maximum outflow of section i (veh),
xmax,i:The maximum queue length of section i (veh), gmin:The minimum effective green time (second), and gmax:The maximum effective green time (second).
When queue length exists for a certain road section, the queue length xi,j k is determined by the previous interval and difference between inflow and outflow (constraint 2). Under route allocation, the queue length, inflow and outflow of a link are equal to the summation of different turn movement flow (constraint s 3, 4, 5). The outflow for a link at the intersection is controlled by the saturated flow rate times green time (constraint 6). The constraint (7), ALINEA feedback control rule, shows that the metering rate is impacted by the rate of last interval and occupancy of downstream. The constraint (8) shows the critical density of
mainstream on freeway. The constraint (9) describes the occupancy of downstream. The constraint (10) describes that the ramp metering rate takes effect to the outflow. The outflow of an off-ramp is less or equal to the saturated flow (constraint 11). The constraint (11) limits the range of outflow on a link, and constraint (12) limits the range of queue length.
The constraint (13) is about the minimum and maximum green time. The mathematical program is solved through CPLEX to get the optimal solution.
NUMERICAL EXPERIMENT
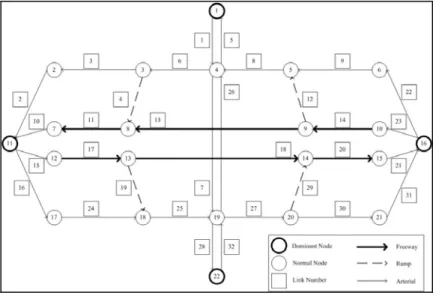
The test traffic corridor, as shown in Figure 1, includes a mainstream of freeway, two on-ramps, two off-ramps and urban networks that there are two signalized intersection.
Figure 1. A Test Corridor
There are three major components in the corridor, namely freeway, ramp and urban networks.
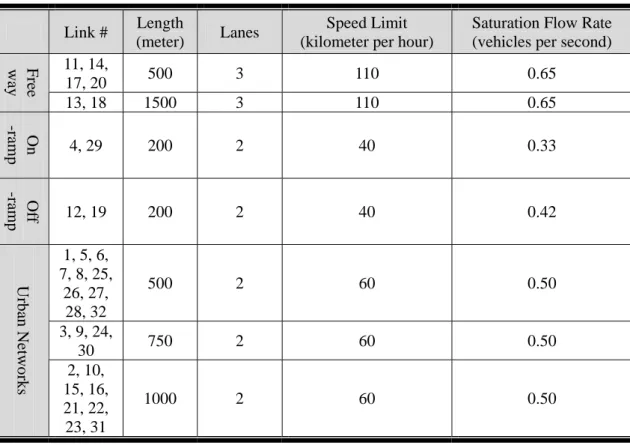
For the freeway, the length of freeway section is 500 and 1500 meters, 3 lanes and the speed limit and saturation flow are 110 kilometer per hour and 0.65 vehicles per seconds, respectively. For the ramps, including on-ramp and off-ramp, the length of ramp section is 200 meters, 2 lanes and the speed limit and saturation flow are 40 kilometer per hour and 0.33 vehicles per seconds for on-ramp, 0.42 vehicles per seconds for off-ramp respectively. For the urban streets, the lengths of urban network segments include 500, 750 and 1000 meters, 2 lanes and the speed limit and saturation flow are 60 kilometer per hour and 0.5 vehicles per seconds, respectively. The detailed information of each link is described in the Table 1.
Table 1. Information of the Corridor Link # Length
(meter) Lanes Speed Limit (kilometer per hour)
Saturation Flow Rate (vehicles per second) 11, 14,
17, 20 500 3 110 0.65
Freeway
13, 18 1500 3 110 0.65
On -ramp
4, 29 200 2 40 0.33
Off -ramp
12, 19 200 2 40 0.42
1, 5, 6, 7, 8, 25,
26, 27, 28, 32
500 2 60 0.50
3, 9, 24,
30 750 2 60 0.50
Urban Networks 2, 10,
15, 16, 21, 22, 23, 31
1000 2 60 0.50
The total considered time period in the experiment is one hour, and each time interval is 10 minutes. There are six time intervals. In order to observe the system performances under different demand levels, several loading factors are tested. The loading factor is defined as the ratio of the total number of vehicles generated in the network during the simulation period.
The loading factors are tested from 0.5 to 1.5. The results, in terms of object values, are shown in the Figure 2.
Figure 2. Results of Objective Function
The objective function is the summation of queue length of each section times the time interval, so that the larger of objectives means the corridor is more congested. When the demand level is 0.5, the total delay time is 218 min-veh. When the demand level is 1.0 and the total delay time is 19064 min-veh. The results indicate that the total delay time increases with respect to demand levels.
Figure 3. Difference between Objective Function
The difference between consecutive demand levels is calculated and the results are shown in Figure 3. When the demand level increases to 1.2, the difference of delays reaches a constant value and it indicates highly saturated traffic conditions. Detailed results are discussed based on three demand levels, low (0.5), median (0.9), and high (1.2).
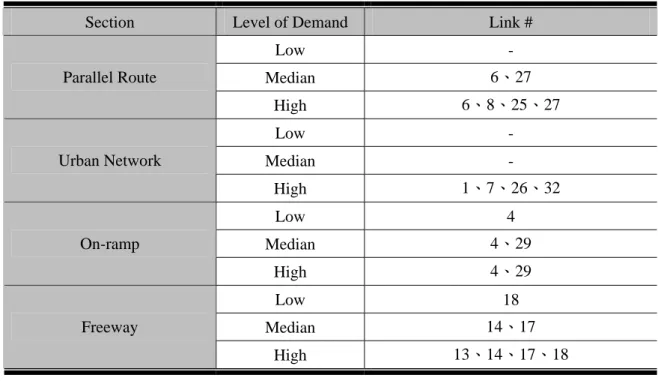
In terms of queue length distribution, vehicle queue occurs in different route under different demand levels. The results are summarized in Table 2. The results show that number of congested links increases with respect to demand levels. For example, there is no queue for links in the parallel route under the low demand level, but there are some congested links in the median and high demand levels.
Table 2. Queue Distribution of Different Level Section Level of Demand Link #
Low -
Median 6、27
Parallel Route
High 6、8、25、27
Low - Median - Urban Network
High 1、7、26、32
Low 4
Median 4、29
On-ramp
High 4、29
Low 18
Median 14、17
Freeway
High 13、14、17、18
There are two intersections in the test network, and the results of signal setting are summarized in the Table 3.
Table 3. Signal Control Setting of Different Level (Unit:Second)
Direction Level 1st Interval 2nd Interval 3rd Interval 4th Interval 5th Interval 6th Interval
NS 10 10 10 10 10 10
EW Low
45 45 45 45 45 45
NS 20 20 20 42 20 10
EW Median
35 35 35 13 35 45
NS 30 30 30 30 24 10
EW High
25 25 25 25 31 45
CONCLUSIONS
The modified optimal control model based on the store-and-forward approach is proposed in this paper and decision variables for queue lengths from section to sections are explicitly modeled. The model is solved through CPLEX. The results from numerical experiments show applicability to apply in route guidance.
The results show that the number of congested links increases with respect to demand levels.
The ramp metering rate decreases when congestion occurs on the freeway to limit number of vehicles entering the freeway. The green time of signalized intersections is also important in
corridor management.
In the experiment, the time interval is set to 10 minutes; however, shorter intervals might provide more details for the corridor management. In order to verify the results, simulation experiments can be applied in the future to evaluate possible benefits based on generated optimal control variables.
REFERENCES
(1) Diakaki, C., Papageorgiou, M., and Mclean, T., “Simulation studies of integrated corridor control in Glasgow,” Transportation Research C, Vol. 5, No. 3, 1997, pp.
211–224.
(2) Gazis, D. C., Traffic Theory, Kluwer Academic Publishers, 2002, pp. 165-168.
(3) Gazis, D. C., and Potts, R. B., “The oversaturated intersection,” Procedings of the 2nd International Symposium on Traffic Theory, London, United Kingdom, 1963,pp.221-237.
(4) Haj-Salem, H., and Papageorgiou, M., “Ramp metering impact on urban corridor traffic:
field results,” Transportation Research A, Vol. 29A, No.4, 1995, pp. 303–319.
(5) Kotsialos, A., Papageorgiou, M., Mangeas, M., and Haj-Salem, H. (2002), “Coordinated and integrated control of motorway networks via non-linear optimal control,”
Transportation Research C, Vol. 10, No. 1, 2002, pp. 65-84.
(6) Michalopoulos, P., and Stephanopoulos, G., “Oversaturated signal system with queue length constraints: single intersection,” Transportation Research, Vol. 11, No. 6, 1977a, pp. 413–422.
(7) Michalopoulos, P., and Stephanopoulos, G., “Oversaturated signal system with queue length constraints: systems of intersections,” Transportation Research, Vol. 11, No.6, 1977b, pp. 423–428.
(8) Moreno-Banos, J.C., Papageorgiou, M., and Schaffnet, C., “Integrated optimal flow control in traffic networks,” European Journal of Operational Research, Vol. 71, No. 2, 1993, pp. 317-323.
(9) Papageorgiou, M., “An integrated control approach for traffic corridors,” Transportation Research C, Vol. 3, No.1, 1995, pp. 19–30.
(10) Rathi, A. K., “A control scheme for high traffic density sectors,” Transportation Research B, Vol. 22, No. 2, 1988, pp. 81-101.