國 立 交 通 大 學
電信工程學系
碩 士 論 文
異質無線網路中根據偏好值
之網路選擇機制
Preference Value-Based Cell Selection Scheme
in Heterogeneous Wireless Networks
研 究 生:謝志遠
指導教授:張仲儒 博士
異質無線網路中根據偏好值之網路選擇機制
Preference Value-Based Cell Selection Scheme
in Heterogeneous Wireless Networks
研 究 生:謝志遠 Student:Chih-Yuan Hsieh
指導教授:張仲儒 博士 Advisor:Dr. Chung-Ju Chang
國立交通大學
電信工程學系
碩士論文
A Thesis
Submitted to Department of Communication Engineering
College of Electrical and Computer Engineering
National Chiao Tung University
in Partial Fulfillment of the Requirements
for the Degree of Master of Science
in
Communication Engineering
July 2009
Hsinchu, Taiwan
異質無線網路中根據偏好值
之網路選擇機制
研究生:謝志遠 指導教授:張仲儒
國立交通大學電信工程學系碩士班
Mandarin Abstract摘 要
在未來 4G 的時代,不同特性的無線網路逐漸整合,業者賦予行動用戶多模 (multi-mode)的能力,使得行動用戶能無縫(seamless)的網路接取,使用者根據各 自通道狀況及自身的服務品質需求(QoS requirement)選擇最適宜自己的無線網 路 。 為 了 支 援 高 傳 輸 速 率 的 多 媒 體 服 務 以 及 高 速 的 行 動 用 戶 , 一 個 WCDMA/WMAN/WLAN 的異質無線網路被提出。 在WCDMA/WMAN/WLAN 的異質無線網路系統中,在本篇論文中我們提 出了一個根據偏好值的網路選擇機制,希望在保證使用者的服務品質需求下,增 加可容納的使用者個數、降低換手(handoff)的發生頻率。此機制包含了三階段, 分別是候選網路選擇(candidate cells selection)、偏好值計算(preference value calculation)、目標網路選定(target cell determination)。在得到候選網路後,我們 計算每個候選網路的偏好值,每個偏好值考慮了三個因素:服務品質(QoS)、負 載狀況(loading)、以及移動速度(mobility)來達到我們的目標,最後選擇偏好值最 大的網路當成目標網路。模擬結果顯示我們提出的方法可以增加系統傳輸速率 (throughput)以及滿足服務品質需求,並且增加可容納的使用者個數以及降低換手 的發生頻率。Preference Value-Based Cell Selection Scheme
in Heterogeneous Wireless Networks
Student: Chih-Yuan Hsieh Advisor: Chung-Ju Chang
Department of Communication Engineering
National Chiao Tung University
English Abstract
Abstract
The thesis proposes a preference value-based cell selection (PVCS) scheme to satisfy quality of service (QoS) requirements, maximize accommodated number of calls and minimize handoff occurrence frequency in heterogeneous wireless networks. The PVCS scheme contains three stages, candidate cells selection, preference value calculation, and target cell determination. The candidate cells selection is used to sift out the candidate cells for the call request. All suitable cells form candidate cell set. The preference value calculation will calculate the preference value of each cell in the candidate cell set, which is optimized by considering QoS factor, loading factor, and mobility factor, for the purpose of maintaining call request’s QoS requirements, maximizing overall system utilization, and minimizing handoff occurrence frequency. Eventually, the target cell, which has the maximum preference value, could be selected for the call request. Simulation results show that PVCS scheme achieves higher total throughput than UGT while satisfying the QoS requirements. It also has lower new call blocking rate and handoff call dropping rate than UGT, which means more accommodated calls than UGT. Besides, PVCS reduces the total handoff occurrence frequency by about 20% as compared to UGT.
Acknowledgemen
誌 謝
這篇論文的完成,我必須感謝許多人給予我支持與幫助。首先我要感謝指導 教授張仲儒教授,不論在專業知識和待人處世方面,都教導我許多寶貴的經驗, 使我獲益良多。除此之外,我也特別感謝下班之餘抽空回來指導我的詠翰學長, 犧牲自己休息時間來給我建議和解答我所有的疑惑。感謝志明、文敬、振宇、耀 興、和文祥學長們,給我學業及生活上的幫助和建議;感謝在進實驗室時遇到一 群活潑開朗的學長姐宗利、邱胤、浩翔、巧瑩、維謙、英奇、尚樺,和你們打球、 唱歌真的很快樂;當然,還要謝謝這兩年來一起努力的和儁、欣毅、盈伃,沒有 你們的鼓勵和協助,我就無法解決這一路上的困難;感謝學弟妹耀庭、正忠、心 瀅、蕊綺,以及辛苦的助理玉棋。有你們的陪伴,研究的生活增添了許多笑聲。 最後,我要感謝我最摯愛的父母,在我難過時給我溫暖親切的家,感謝哥哥 在我瓶頸時給我寶貴建議,感謝愛犬大雄代替我陪伴我父母,因為有你們對我的 支持、關心和鼓勵,我才有勇氣度過每一個難關,完成這篇碩士論文。 志遠 謹誌 民國九十八年七月Contents
Mandarin Abstract ... i
English Abstract ... ii
Acknowledgement ... iii
Contents ... iv
List of Figures... vi
List of Tables... vii
Chapter 1 Introduction... 1
Chapter 2 System Model ... 5
2.1 Heterogeneous Wireless Access Environment...5
2.1.1 WCDMA Cellular Network...6
2.1.2 IEEE 802.16 WMAN...7 2.1.3 IEEE 802.11 WLAN ...8 2.2 Channel Model...9 2.3 Mobility Model ...10 2.4 Traffic Classes...10 2.5 Source Model ...11
Chapter 3 Preference Value-Based Cell Selection Scheme ... 14
3.1 Introduction...14
3.2 Candidate Cells Selection Stage ...15
3.2.1 Received Signal Strength Constraint ...15
3.2.2 Cell Loading Constraint ...16
3.3 Preference Value Calculation Stage ...19
3.3.1 Loading Factor ...19
3.3.2 QoS Factor ...20
3.3.3 Mobility Factor...23
3.4 Target Cell Determination Stage...25
Chapter 4 Simulation Results and Discussions ... 26
4.1 Simulation Environment ...26
4.2 Traffic Model Parameters and QoS Requirements ...27
4.3 UGT based network selection scheme ...29
4.4 Simulation Results and Discussions ...30
Chapter 5 Conclusions... 39
Bibliography ... 41
List of Figures
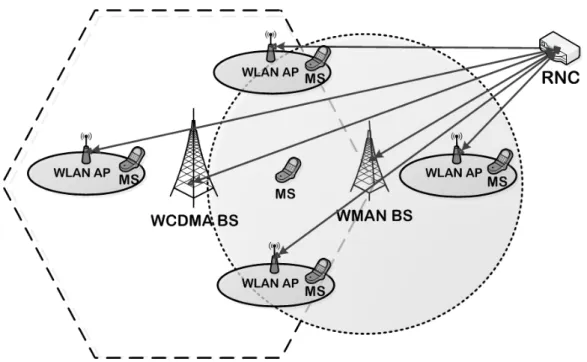
Fig. 2.1: The subnetwork topology of WCDMA, WMAN, and WLAN systems ...6
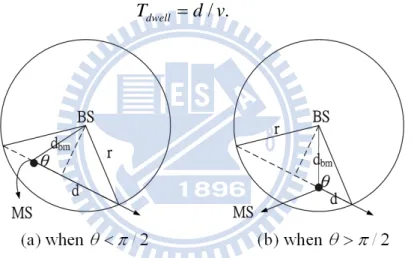
Fig. 2.2 : High mobility MS model...10
Fig. 2.3 : Packet trace of a typical on-off voice model ...11
Fig. 2.4 : Packet trace of one video streaming session model ...12
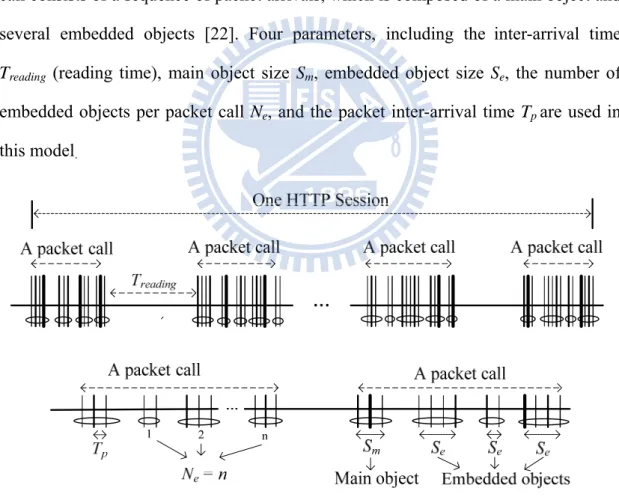
Fig. 2.5 : Packet trace of one HTTP session model ...12
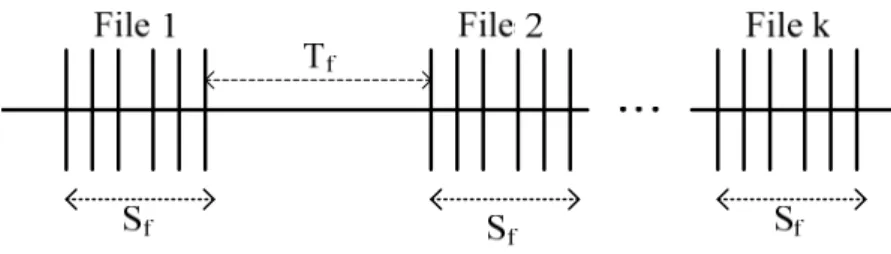
Fig. 2.6 : Packet trace of a typical FTP session model ...13
Fig. 3.1 : The block diagram of PVCS scheme...15
Fig. 3.2 : The flow chart of candidate cells selection ...18
Fig. 3.3 : Utility functions of data rate for four traffic classes...21
Fig. 3.4 : Utility functions of packet delay for real time services...22
Fig. 3.5 : Utility functions of packet dropping rate for real time services...23
Fig. 4.1 : New call blocking rate...31
Fig. 4.2 : Number of accommodated calls ...31
Fig. 4.3 : Handoff call dropping rate...32
Fig. 4.4 : Number of total handoff calls...32
Fig. 4.5 : Handoff occurrence frequency ...33
Fig. 4.6 : Total throughput and throughput of each system ...34
Fig. 4.7 : (a) Number of accommodated real-time calls (b) Number of accommodated non-real-time calls ...35
Fig. 4.8 : Average delay of voice traffic ...37
Fig. 4.9 : Average delay of video traffic ...37
Fig. 4.10 : Packet dropping rate of voice traffic ...38
List of Tables
Table 4.1: System parameters for WCDMA, WMAN, and WLAN ...26
Table 4.2: Conversational Class Traffic Model Parameters...27
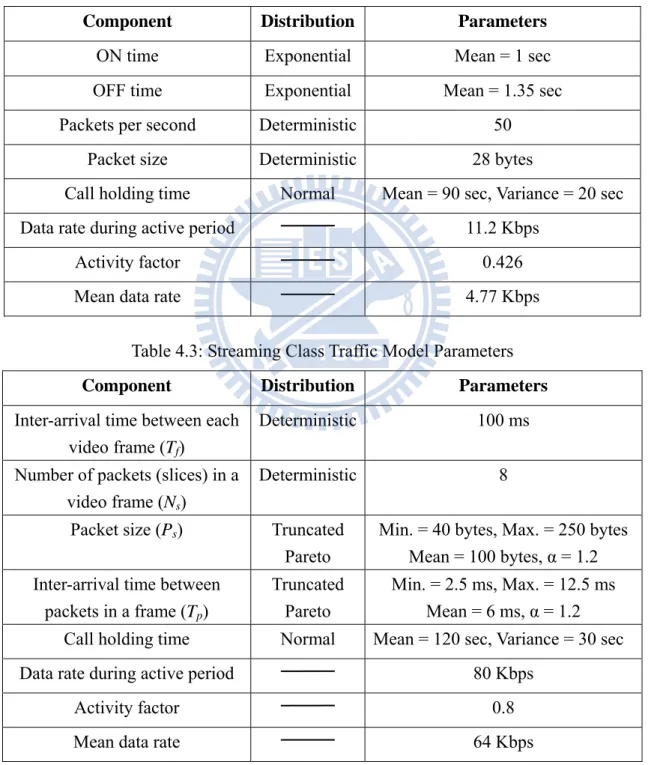
Table 4.3: Streaming Class Traffic Model Parameters...27
Table 4.4: Interactive Class Traffic Model Parameters...28
Table 4.5: Background Class Traffic Model Parameters ...28
Chapter 1
Introduction
One of the main features of the evolving the next generation (4G) wireless networks would be heterogeneous wireless access in which a mobile station (MS) has multi-mode capability to connect to multiple heterogeneous radio access networks (RANs) simultaneously, such as wireless local area network (WLAN), wireless metropolitan area network (WMAN), wideband code division multiple access (WCDMA) cellular network [1]. This would facilitate high-speed connectivity and seamless Internet access through optimal network selection among different types of RAN. However, each RAN has different system characteristics such as cell coverage, capacity, loading, and carrier frequency, it is necessary to take system information and MS’s quality-of-service (QoS) requirements into account when performing the network selection. In addition, load balancing is also indispensable to accommodate as many MSs as possible so as to increase overall system utilization for the heterogeneous wireless networks.
Mobility is also a very important factor in the heterogeneous wireless networks. Systems have to support handoff to provide service continuity. A handoff may be initiated by an MS to maintain wireless connection in the heterogeneous wireless system. In heterogeneous wireless networks, two types of handoff are usually considered: horizontal handoff and vertical handoff. Horizontal handoff means that an
MS hands over to another homogeneous cell. Vertical handoff means that an MS hands over to another heterogeneous cell. A high mobility MS has more opportunities to experience more handoffs during its call holding time. Generally, more handoffs imply more overhead and take higher risk of call dropping. Therefore, it is a significant topic to decrease the number of handoff through proper network selection. A utility-based method would be an excellent approach for target cell decision problem. In [2], a market model is formulated to maximize total network utilities by adjusting the resource price. A utility function represents the satisfaction degree of the received QoS and the price mechanism acts as a lever to guide user’s action and to control resource allocation. Ormond, Murphy, and Muntean proposed some possible utility functions based on different user’s attitudes to risk. Their solution is a user-centric network selection strategy based on maximizing consumer surplus subject to meeting user-defined constraints in terms of transfer completion time [3]. In addition, the network selection scheme proposed in [4] adopted multi attribute decision making (MADM) method to consider multi-factors which will influence the final decision result. However, the papers mentioned above did not consider user mobility and physical channel effect. To address these two issues, the approach proposed in [5] defined a utility function, which is composed of four evaluation functions of mobility and QoS requirements such as required data rate, maximum tolerable delay, and packet error rate (PER), help the MS to determine which network is the most suitable.
Selecting a suitable RAN to serve the call request can be regarded as a kind of competition behavior. Game theory [6] is a common mathematical tool used to understand competitive behaviors for creating rational decision makers to achieve performance objectives. This mathematical tool can be adapted for radio resource management (RRM) mechanisms in a heterogeneous environment [7]. In [8], the
authors modeled network selection between the access networks using a game theoretic approach, in which the competition with non-cooperative manner was applied to maximize the payoff. However, it may be unsuitable for only considering user preference as payoff of the game. Niyato and Hossain [9] used a bankruptcy game formulation which is a special type of N-person cooperative game to find the solution of the bandwidth allocation problem in a heterogeneous wireless network. But they only considered non-real time services and did not take user mobility into consideration. Later they also proposed a non-cooperative game-theoretic framework in heterogeneous wireless networks [10]. Nevertheless, the above papers of [9] and [10] assumed that a call request can use various RANs at the same time. This substantially increases the network complexity to maintain data synchronization/ordering. Charilas, Markaki, and Tragos [11] proposed a theoretical scheme that combines analytical hierarchy process (AHP) and grey relational analysis (GRA) to attain the goal of optimal network selection. In addition, call admission control (CAC) is also modeled as a non-cooperative game so that networks play against each other to maximize their payoff and ensure QoS guarantee for multiple simultaneous service requests from many users. In [12], a utility and game-theory (UGT) based network selection scheme is proposed for heterogeneous wireless networks. UGT calculates the utility value and preference value for each candidate network based on the QoS satisfaction of the call request and cooperative network preference game. Finally, the network, which has the maximum of linear combination, would be selected as the most suitable network for the call request.
Furthermore, in order to increase the overall system utilization for heterogeneous wireless networks, it is very important to consider load balancing. Suleiman, Chan, and Dlodlo proposed a load balancing scheme in the heterogeneous environment [13]. Each horizontal call admission control (HCAC) periodically sends
a load report to the vertical call admission control (VCAC). The VCAC compares the load reports and makes decision for load balancing. In [14], a load balancing algorithm based on load state was proposed for the heterogeneous networks. The algorithm assigns new calls to under-loaded cells and only allows the MSs with non-real time service in overloaded cells to under-loaded heterogeneous cells since vertical handoffs have long latency. A dynamic load balancing algorithm based on sojourn time was proposed for the heterogeneous network [15]. Results show that the algorithm increases the total network utilization and decreases the new call blocking probabilities and the handoff call dropping probabilities at the cost of increasing number of handoff.
In this thesis, a preference value-based cell selection (PVCS) scheme is proposed for heterogeneous wireless access environment, where multiple classes of traffic are considered. The PVCS scheme contains three stages, candidate cells
selection, preference value calculation, and target cell determination. The candidate
cells selection is used to filter out unsuitable cells by checking three thresholds including the received signal strength constraint, cell loading constraint and dwell time constraint. All suitable cells form candidate cell set. The preference value calculation of each cell in the candidate cell set is optimized by considering QoS factor, loading factor, and mobility factor, for the purpose of maintaining call request’s QoS requirements, maximizing overall system utilization, and minimizing handoff occurrence frequency. Ultimately, the target cell determination selects a best-fit cell for the call request.
The rest of this thesis is organized as follows. In Chapter 2, the system model is described. In Chapter 3, the proposed preference value-based cell selection (PVCS) scheme is illustrated. Simulation results and discussions are presented in Chapter 4. Finally, Chapter 5 gives the conclusions and future works.
Chapter 2
System Model
2.1 Heterogeneous Wireless Access Environment
A heterogeneous wireless access environment consisting of WCDMA, IEEE 802.16 WMAN, and IEEE 802.11 WLAN systems is considered. We assume that a MS with multiple radio transceivers can detect these radio interfaces simultaneously and select one cell/system to transmit data. The perfect power control is also assumed to ensure uniform available data rate across coverage area. As shown in Fig. 2.1, the subnetwork contains one WCDMA cell and one WMAN cell and four WLAN cells. Each subnetwork is deployed with such kind of topology, and overlapped with each other. Here WLAN cells serve as hotspots in the urban area to support high data rate services.
Fig. 2.1: The subnetwork topology of WCDMA, WMAN, and WLAN systems Base stations (BSs) of WMAN and WCDMA systems and access points (APs) of the WLAN system can collect the information of a call request, including received signal strength (RSS), estimated velocity [16], position, direction of motion, and traffic class of a call request [17]. The proposed PVCS scheme is implemented in a radio network controller (RNC), which gathers information from BSs or APs to make cell selection decision. The three different wireless radio interfaces are described as follows.
2.1.1 WCDMA Cellular Network
For the interference-limited WCDMA networks, the BS needs to control interference in the cell. In this thesis, only the uplink direction is considered, and it is assumed that whenever the uplink channel is assigned, the downlink is established. Also, it is assumed that the transmitted signal strength for each MS can be adaptively controlled in order to achieve the target received signal strength in the BS. Then the achievable bit rate for MSj, denoted as ARj, can be obtained by [18]
0 , ( / ) j j j b j total j RSS W AR v E N I RSS = × ⋅ − (2.1)
where W is the chip rate, vj is the activity factor of MSj, is the signal energy
per bit divided by noise spectral density that is required to meet a predefined QoS of MS
0
(Eb/N )j
j
j, RSSj is the received signal strength of MSj from BS, and Itotal is the total power
including thermal noise power received at BS. Note that the requirement of MS
0
(Eb/N )
j is determined from the bit error rate requirement, service type, estimated
velocity, and so on of the MSj.
2.1.2 IEEE 802.16 WMAN
IEEE 802.16 WMAN adopts orthogonal frequency division multiple access (OFDMA) [19]. Suppose there are L sub-channels in the IEEE 802.16 WMAN system, and each sub-channel consists of q spread out sub-carriers. Thus the channel condition of each sub-channel can be regarded as the same, and the frequency selective phenomenon can be compensated. Assume that each frame includes N OFDMA symbols, and the duration for each frame is T. The total number of resource block, defined as one sub-channel and one OFDMA symbol, in a frame will be . Moreover, equal power control, which means the same allocated power to each call request, is adopted. From
L N×
[20], an approximation of modulation order M when the required BER, denoted by BER*, is given can be obtained by
( ) * 1.5 1, ln(5 ) n SINR M BER × = + − × l (2.2)
where is the received signal to interference and noise ratio (SINR) of call request on sub-channel at the OFDMA symbol and BER
( )n SINRl
l nth * is the required bit error rate of call request. However, there are 4 types of modulation: no transmitted, QPSK, 16-QAM, and 64-QAM. So the usable modulation order of call request on sub-channel for the l nthOFDMA symbol, denoted by ml( )n , is given as
(2.3) ( ) 0, if 4, 2, if 4 16, 4, if 16 64, 6, if 64 . n M M m M M < ⎧ ⎪ ≤ < ⎪ = ⎨ ≤ < ⎪ ⎪ ≤ ⎩ l
Finally, the total allocated B bits to call request in the current frame can be obtained (2.4) ( ) ( ) 1 1 , N L n n n B q c m = = =
∑∑
⋅ l ⋅ l lwhere is the allocation indicator. The value of equals to 1, if the scheduler allocates the resource on sub-channel at the OFDMA symbol to the call request. On the contrary, it will be 0.
( )n
cl cl( )n
l nth
2.1.3 IEEE 802.11 WLAN
The WLAN system supports distributed coordination function (DCF) mode and point coordination function (PCF) mode for media access. DCF adopts carrier sense multiple access with collision avoidance (CSMA/CA) protocol with a slotted binary exponential backoff scheme. PCF is a centralized polling protocol controlled by the AP. In order to support QoS and service differentiation, IEEE 802.11e, which has been included in IEEE Std 802.11™-2007, defines the hybrid coordination function (HCF), which includes the contention-based priority-supported enhanced distributed channel access (EDCA) and contention-free HCF controlled channel access (HCCA). HCF allows the AP and MS to initiate the duration of transmission opportunity in the contention or contention-free period [21]. The standard also defines four access categories (ACs) and eight priorities to support differentiated QoSs. MSs using EDCA mode to transmit data are assumed in this thesis.
Under the EDCA mode, a MS cannot transmit packets until the channel is sensed idle for a time period equal to the arbitration interframe space (AIFS). When a
MS senses the channel busy during the AIFS, the backoff time counter is randomly selected from the range [0, CW-1], where CW is the contention window. The value of CW is increased from CWmin to CWmax if consecutive fail transmissions occur, where
CWmin is the initial value of CW, CW =2 CWmax m min is the maximum value of CW and
m is called the maximum backoff stage.
Different ACs have different AIFS [AC], CWmin[AC], and CWmax[AC]. Traffic
classes with smaller values of CWmin and CWmax represent higher priorities. AIFS
[AC] for a specific AC can be given by
AIFS[AC]= AIFSN[AC] aSlotTime + aSIFSTime,× (2.5) where AIFSN[AC] is AIFS number of the AC, aSlotTime is the value of the
correspondingly named PHY characteristic, and aSIFSTime is the time duration of a SIFS.
2.2 Channel Model
The wireless fading channel is composed of large-scale fading and small-scale fading. The large-scale fading comes from path loss and shadowing effect, while the small-scale fading is caused by multipath reflection. The pass loss is modeled as [22]
(2.6) 128.1 37.61 log ( ),
pathloss bm
L = + × d dB
where dbm is the distance between the BS and the MS in kilometers. Assume the
log-normal shadowing is with zero mean and standard deviation of 8 dB. The Jakes model [23] is used to simulate the small-scale fading channel. Furthermore, the channel is assumed to be fixed within a frame and varies independently from frame to frame.
2.3 Mobility Model
For a high mobility MS, it is assumed that the estimated speed v and direction of motion are unchanged. As shown in Fig. 2.2, r is the radius of cell coverage, θ is the angle between BS and the moving direction of MS, where 0≤ ≤ , and θ π is the distance between BS and MS, where
bm d
0≤dbm≤ . Then the total travel distance in the r
cell, denoted by d, can be obtained by
2 ( sin )2 cos , where 0 2 .
bm bm
d = r − d ⋅ θ +d ⋅ θ ≤ ≤ rd
v
(2.7) So we can calculate the estimated dwell time of the MS in this cell, Tdwell, by
/ .
dwell
T =d (2.8)
Fig. 2.2 : High mobility MS model
For a pedestrian or a normal mobility MS, they are also assumed that the speed is unchanged. But the direction will be changed randomly every certain fixed duration.
2.4 Traffic Classes
There are four traffic classes considered [24]: conversational class, streaming class, interactive class and background class. The conversational class represents real-time multi-media applications such as Voice over IP (VoIP). The streaming class
class is composed of applications for Web-browsing, chat room, etc. Finally, the background class is the service using best effort transmission, such as file transfer protocol (FTP). It can be found that the first two classes are delay-sensitive (real-time), and the last two classes are delay-tolerant (non-real-time).
Each call request has different QoS parameters according to their service types. Intuitively, the real-time traffic requests low delay, low jitter, and the number of handoff must keep as low as possible. But they are tolerant of certain level of packet loss. On the other hand, non-real time traffic may request high bandwidth, and low packet dropping rate, etc. However, variable transmission rate is acceptable to them.
2.5 Source Model
The conversational class traffic is modeled as the ON-OFF model [25] shown in Fig. 2.3. During ON period, voice packets are generated with rate Dv bps. During OFF
period, there is no packet generated. This model has a transition rate with value y in the ON state and a transition rate with value z in the OFF state.
Fig. 2.3 : Packet trace of a typical on-off voice model
Fig. 2.4 depicts the packet trace of one video streaming session model, which is composed of a sequence of video frames generated regularly with a constant interval
Tf [22]. Each video frame consists of a fixed number of slices Ns, where each slice
corresponds to a single packet. The size of packet is denoted by Ps, and the
Fig. 2.4 : Packet trace of one video streaming session model
Fig. 2.5 shows the Packet trace of one HTTP session model. The interactive class traffic can be modeled as a sequence of packet calls (pages), and each packet call consists of a sequence of packet arrivals, which is composed of a main object and several embedded objects [22]. Four parameters, including the inter-arrival time
Treading (reading time), main object size Sm, embedded object size Se, the number of
embedded objects per packet call Ne, and the packet inter-arrival time Tp are used in
this model.
The background class traffic is modeled as a sequence of file downloads [22] and is shown in Fig. 2.6. Denote the size of each file by Sf, and the inter-arrival time
between each file by Tf.
Chapter 3
Preference Value-Based Cell
Selection (PVCS) Scheme
3.1 Introduction
The proposed preference value-based cell selection (PVCS) scheme is composed of three stages, candidate cells selection, preference value calculation, and target cell
determination. As shown in Fig. 3.1, for a MS’s call request, the candidate cells selection is used to filter out unsuitable cells. All suitable cells form candidate cell set
C, where C={C1 , C2 , ... , CK }. The preference value calculation calculates each
preference value Pi of candidate cell Ci , i =1, 2, ... , K, in the candidate cell set. These
preference values are evaluated by considering the factors of loading, QoS, and mobility to maximize overall system utilization, maintain the call request’s QoS requirements, and minimize handoff occurrence frequency. Ultimately, the target cell
determination selects a best-fit cell for the call request of a MS. In the following, each
Fig. 3.1 : The block diagram of PVCS scheme
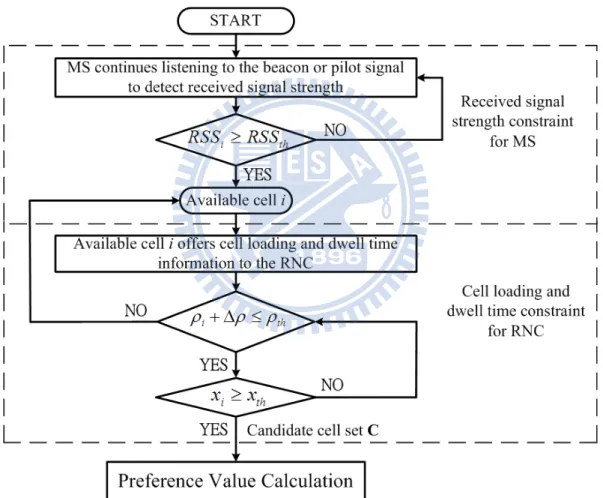
3.2 Candidate Cells Selection Stage
This is the first stage to sift out the candidate cells for the call request from all cells according to received signal strength constraint, cell loading constraint and
dwell time constraint. A feasible cell has to meet these three constraints so as to be
included in the candidate cell set C for a call request. If there is no cell in the candidate cell set C, the call request is blocked.
3.2.1 Received Signal Strength Constraint
The MS measures the received signal strength of pilot or beacon signal from the neighboring BSs or APs in order to pick out the cells which offer sufficient connection quality. If the received signal strength of pilot/beacon from cell i, denoted by RSSi, exceeds a given received signal strength threshold RSSth, the cell i will be
categorized as an available cell which offer sufficient connection quality. In addition, the different power characteristics of different wireless radio interfaces make the predefined received signal strength threshold different.
3.2.2 Cell Loading Constraint
This constraint is used to guarantee that the admittance of a call request will not influence the QoS requirements of existing connections. The admission controller gathers loading information from all available cells. Assume that a call request is required to notify the BSs of its QoS requirements when it asks to access one cell to transmit data. The QoS requirements contain maximum bit rate, packet error ratio, transfer delay, etc. [24] Consequently, the loading intensity of cell i before admitting a new call request, denoted by ρi( 0≤ρi ≤ ), can be calculated as the sum of the 1
loading intensity of existing call requests in the cell i,
1 N i e e ρ ρ = =
∑
, where N is the number of existing call requests in the cell i [18].Moreover, if infinite buffer size is assumed, the equivalent capacity can be derived as mean bit rate [26]. Thus we define the mean bit rate of a call request as its equivalent capacity to estimate the cell loading intensity increment Δ when the ρ call request enters the cell. If the call request is admitted by cell i, the cell loading intensity should not exceed a predefined threshold, ρth, which is set by the radio network planning. The cell loading constraint can be expressed by
.
i th
ρ + Δ ≤ρ ρ (3.1)
Otherwise, the cell will be excluded from the candidate cell set.
In the WCDMA system, the loading incrementΔ can be estimated as [18] ρ
0 1 (1 ) , 1 /( b/ ) f W R v E N ρ Δ = + + ⋅ ⋅ (3.2)
where f is the other cell to own cell interference ratio, W is the chip rate of the WCDMA system, R is the bit rate of the new call request, v is the activity factor of the new call request, and Eb/N0 is the bit-energy divided by noise spectral density for
In the OFDMA-based WMAN system, the mean equivalent capacity of WMAN can be estimated as 4 q L N T× × × / (bps). Then the loading incrementΔ can be ρ
estimated as
/(4Δ = ×ρ R v × × ×q L N T/ ), (3.3)
In the WLAN system, the measurement-based cell loading estimation is used. Let Ts be the total busy occupation transmission time consisting of successful
transmission time and collision time in the latest observation duration Td. The loading
of cell i is defined as ρi =T Ts/ d. The available cell i will be included in the candidate cell set if the following condition is satisfied,
.
i th
ρ ≤ρ (3.4)
Note that the values of ρth in WCDMA, WMAN, and WLAN systems could be different.
3.2.3 Dwell Time Constraint
Generally speaking, if an MS can stay in the cell as long as possible, the MS’s call request has high probability to finish data transmission in this cell. This also implies that the handoff occurrence frequency and signaling overhead for handoffs could be reduced. Assume that the maximal dwell time of an MS, which is acquired from the diameter of the cell i divided by the estimated velocity of the MS, is
Tmaximum,i. The dwell time Tdwell,i for an MS in cell i can be calculated according to the
estimated velocity, position, and direction of motion of the MS and cell coverage by using (2.7) and (2.8). Let xi =Tdwell,i/Tmaximum,i. xi = 1 means that the MS travels along
the diameter of the cell i and has larger chance to reduce handoff occurrence frequency. On the contrary, if xi is smaller than a predefined threshold xth, this means
initiate handoff. Note that the values of xth in WCDMA, WMAN, and WLAN systems
could be different.
Accordingly, the constraint is designed to check if the dwell time for an MS in cell i is too temporal to be suitable for the candidate cell. That is
.
i th
x ≥x (3.5)
Otherwise, the cell will be excluded from the candidate cell set.
3.3 Preference Value Calculation Stage
After obtaining candidate cells for the call request, all candidate cells in C compete with each other to serve the call request according to their preference values. The meaning of preference value is to judge the degree of suitability for the target cell, which considers maximizing overall system utilization, maintaining the call request’s QoS requirements, and decreasing the number of handoff. To achieve these goals, the preference value of candidate cell Ci, denoted by Pi, is defined as a linear combination
of three factors given by
+ ,
i i i
P =αL βQ +γMi (3.6)
where Li is the loading factor of candidate cell i, Qi is the QoS factor of candidate cell
i, Mi is the mobility factor of candidate cell i, and α ,β,γ are the weights of
different factors whose relation is α β γ+ + = . The meaning of the three factors and 1 how to design these factors are described as follows.
3.3.1 Loading Factor
The main concept of loading factor is to strike a balance between system utilization and cell loading. When a call request arrives, the PVCS scheme prefers to arrange it to the cell which can minimize overall cell loading differences. Through load balancing, it can achieve the objective of maximizing overall system utilization. Accordingly, the loading factor Li can be defined as
K K K 1 1 1 1 , 1 i i j j k j j k j i j i k i k j L ρ ρ ρ = = = ≠ ≠ ≠ ≠ = ′ +
∑
- +∑∑
-ρ (3.7)where ρi′ is the loading intensity of cell i after accepting new call request, ρj and k
denominator of equation (3.8), the first summation represents the differences in loading intensity between the cell i if the new call request is accepted and other cells. The last dual summation represents all combinations of loading intensity differences except the cell i. Obviously, if the denominator of Li is smaller, it implies that the new
call request would cause less loading difference if it is admitted by Ci, which is more
likely to be a target cell.
3.3.2 QoS Factor
Utility is a measurement of call request’s satisfaction level with the perceived QoS. The different forms of utility function characterize different elastic traffic class. In this thesis, voice services are assumed to be constant bit rate (CBR) traffic. Its QoS requirements on data rate, packet delay, packet dropping rate are so stringent that its utility function can be represented by a steep concave function. Video and HTTP services are assumed to be variable bit rate (VBR) traffic. Their QoS requirements are less stringent than voice services. Thus the slope of utility function is gentler than voice services. FTP services are assumed to be available bit rate (ABR) and greedy traffic, which means more data rate leads higher satisfaction level. An increasing concave function can describe its utility. Based on these utility concepts, a QoS factor
Qi for each candidate cell i is expressed as a product of three QoS-related utility
functions, which is given by
(3.8) ( ) ( ) ( ),
i i i
Q =U B ×U D ×U Ri
where U(Bi), U(Di), and U(Ri) are the normalized utility functions of data rate, packet
delay, packet dropping rate for candidate cell i, respectively. Note that the last two utility functions are only used for real time services. As shown in Fig. 3.2, Fig. 3.3, Fig. 3.4, if a candidate cell has greater QoS measures to fulfill the QoS requirements
from utility functions would increase exponentially. On the contrary, if a candidate cell does not have sufficient QoS measures to satisfy the QoS requirements of the call request, the utility values would be zero.
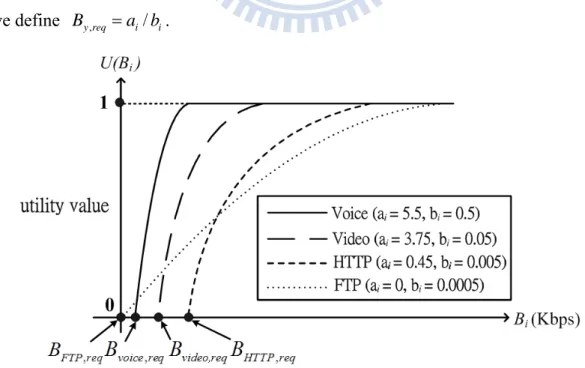
Therefore, the utility functions of data rate for four traffic classes described in Section 2.4 are defined as
{
}
( ) max 1- a b Bi i i,0 , 0, 0,
i i
U B = e − × a ≥ bi ≥ (3.9)
where BBi is the allowed data rate measured in the candidate cell i, ai is the requirement
parameter, bi is the elasticity parameter, and By,req, y=voice, video, HTTP, and FTP
denote the data rate requirement of the call request for four traffic classes, respectively. Note that the allowed data rate measured in WCDMA can be obtained by (2.1), the achievable modulation order in WMAN can be estimated by (2.2), (2.3), and the allowed data rate measured in WLAN is obtained by measurement-based cell loading intensity estimation. Besides, the larger value of requirement parameter ai means
higher data rate requirement and the larger value of elasticity parameter bi means
steeper curve, that is, less elasticity in data rate requirement. To ensure , we define ( ) [0,1]i U B ∈ , / y req i i B =a b .
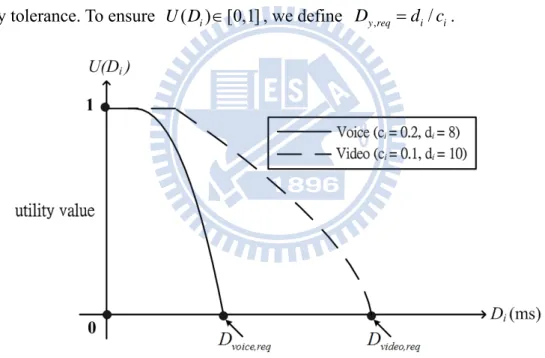
Moreover, the utility functions of packet delay are defined as
(3.10)
( ) max{1- c Di i di,0}, 0, 0,
i i
U D = e × − c ≥ di ≥
where Di is the average packet delay measured in the candidate cell i, ci is the
elasticity parameter, di is the requirement parameter, and Dy,req, y=voice, video, is the
maximum delay tolerance of the call request, respectively. Note that the values of average packet delay for real time services are computed separately. Different traffic class has different average packet delay in the same candidate cell. In addition, the larger value of requirement parameter di means higher maximum delay tolerance and
the larger value of elasticity parameter ci means steeper curve, that is, less elasticity in
delay tolerance. To ensure U D( ) [0,1]i ∈ , we define Dy req, =d ci/ i.
Fig. 3.4 : Utility functions of packet delay for real time services Similarly, the utility functions of packet dropping rate are defined as
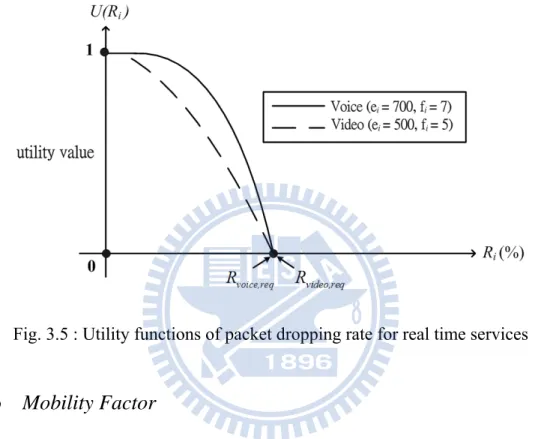
(3.11)
( ) max{1- e Ri i fi,0}, 0, 0,
i i
U R = e × − e ≥ fi ≥
where Ri is the average packet dropping rate measured in the candidate cell i, ei is the
elasticity parameter, fi is the requirement parameter, and Ry,req, y=voice, video, is the
respectively. Similar to the above case, the values of average packet dropping rate for real time services are computed separately. Furthermore, the larger value of requirement parameter fi means higher maximum allowable packet dropping rate and
the larger value of elasticity parameter ci means steeper curve, that is, less elasticity in
packet dropping rate. To ensure U R( ) [0,1]i ∈ , we define Ry req, = f ei/ i.
Fig. 3.5 : Utility functions of packet dropping rate for real time services
3.3.3 Mobility Factor
The mobility factor considers two aspects of an MS, inclusive of the dwell time and the relative position. In this thesis, the proposed PVCS scheme favors to arrange a high mobility MS to large cell for the purpose of avoiding frequent handoffs. A small cell that would incur more handoffs has a less chance of becoming the target cell.
For an MS, it is assumed that the average dwell time of total candidate cells is
Taverage. Let ri =Tdwell i, /Taverage. If ri is larger than one, the MS has larger chance to
finish data transmission in the large candidate cell i. However, if ri is smaller than one,
this means that the MS has high probability to initiate handoff when it enters the candidate cell i. Consequently, the mobility factor Mi for the aspect of dwell time can
, 0, 0.25 0.25, 0.25 1 . 0.75 ( -1), 1 1.25 1, 1.25 i i dwell i i i i if r r if M r if r if r ≤ ⎧ ⎪ i r − < ≤ ⎪ = ⎨ + < ≤ ⎪ ⎪ < ⎩ (3.12)
On the other hand, the candidate cell i will be more suitable if the MS is nearer to the BS of candidate celli. The mobility factor will be larger. In order to decrease
the number of handoff, the mobility factor will get smaller if the MS is farther from the BS of candidate celli. Therefore, the mobility factor Mi for the aspect of relative
position can be defined as
, , , , 1, ( ) /( ), 0, bm i th position i i bm i i th i th bm i i bm if d cr , M cr d cr cr if cr d cr if cr d ≤ ⎧ ⎪ =⎨ − − < ≤ ⎪ < ⎩ (3.13)
where dbm is the distance between the BS of candidate celli and the MS, cri is the cell
radius of candidate celli, and cri,th is a predefined threshold. Note that the values of
cri,th in WCDMA, WMAN, and WLAN systems could be different. Finally, the
3.4 Target Cell Determination Stage
The preference value contains the preference from the viewpoints of the call request and the service provider. If the preference value of the candidate cell is maximal, it has the largest opportunity to satisfy the QoS requirement of call request and achieve the objective of service provider to maximize overall system utilization. Consequently, the target cell determination is formulated as an optimization problem given by (3.14) * arg max{ }, i i i = P
where i is the ith candidate cell in the candidate cell set C, and i* is the index of
Chapter 4
Simulation Results and Discussions
4.1 Simulation Environment
The simulation environment contains 7 subnetworks overlapping with each other, which subnetwork is as shown in Fig. 2.1. The system parameters in the heterogeneous wireless access environment are listed in Table 4.1. The channel model and pedestrian (3 km/hr) and normal mobility (30 km/hr) and high mobility (80 km/hr) models of MS have been introduced in Chapter 2.
Table 4.1: System parameters for WCDMA, WMAN, and WLAN
Parameters WCDMA WMAN WLAN
Cell radius 2 Km 2 Km 0.1 Km Frame (slot) duration 10 ms 5 ms 9 us
Carrier frequency 2 GHz 2.5 GHz 2.4 GHz
Number of cells 7 7 28
Loading intensity threshold (ρth) 0.85 1 0.85 Dwell time threshold (xth) 0.05 0.05 0.2
the other cell to own cell interference ratio (f)
0.55
Number of subchannels (L) 4
Number of data subcarriers per subchannel (q)
48
4.2 Traffic Model Parameters and QoS Requirements
As described in chapter 2, there are four classes of traffic considered. The traffic model parameters for conversational, streaming, interactive, and background traffic classes are shown in Table 4.2, 4.3, 4.4, and 4.5, respectively.
Table 4.2: Conversational Class Traffic Model Parameters
Component Distribution Parameters
ON time Exponential Mean = 1 sec OFF time Exponential Mean = 1.35 sec Packets per second Deterministic 50
Packet size Deterministic 28 bytes
Call holding time Normal Mean = 90 sec, Variance = 20 sec Data rate during active period 11.2 Kbps
Activity factor 0.426
Mean data rate 4.77 Kbps
Table 4.3: Streaming Class Traffic Model Parameters
Component Distribution Parameters
Inter-arrival time between each video frame (Tf)
Deterministic 100 ms Number of packets (slices) in a
video frame (Ns)
Deterministic 8 Packet size (Ps) Truncated
Pareto
Min. = 40 bytes, Max. = 250 bytes Mean = 100 bytes, α = 1.2 Inter-arrival time between
packets in a frame (Tp)
Truncated Pareto
Min. = 2.5 ms, Max. = 12.5 ms Mean = 6 ms, α = 1.2 Call holding time Normal Mean = 120 sec, Variance = 30 sec Data rate during active period 80 Kbps
Activity factor 0.8
Table 4.4: Interactive Class Traffic Model Parameters
Component Distribution Parameters
Main object size (Sm) Truncated
Lognormal
Min. = 100 bytes, Max. = 2 Mbytes Mean = 10710 bytes, Std. dev. = 25032bytes Embedded object size (Se) Truncated
Lognormal
Min. = 50 bytes, Max. = 2 Mbytes Mean = 7758 bytes, Std. dev. = 126168 bytes Number of embedded objects
per page (Ne)
Truncated Pareto
Min. = 2, Max. = 53 Mean = 5.64, α = 1.1 Inter-arrival time between each
page (Treading)
Exponential Mean = 30 sec
Packet size Deterministic Chop from objects with size 1500 bytes
Packet inter-arrival time (Tp) Exponential Mean = 0.13 sec
Call holding time Normal Mean = 120 sec, Variance = 30 sec Data rate during active period 92.3 Kbps
Activity factor 0.136
Mean data rate 12.55 Kbps
Table 4.5: Background Class Traffic Model Parameters
Component Distribution Parameters
File size (Sf) Truncated
Lognormal
Min. = 50 bytes, Max. = 5 Mbytes Mean = 2 Mbytes, Std. dev. = 722 Kbytes Inter-arrival time between each
file (Tf)
Exponential Mean = 180 sec Packet size Deterministic 3000 bytes
Call holding time Normal Mean = 180 sec, Variance = 40 sec Data rate during active period 88.9 Kbps
Activity factor 1
Different traffic classes have different QoS requirements. The QoS requirements of each traffic class are listed in Table 4.6.
Table 4.6: The QoS Requirements of each traffic class
Traffic class Requirement Value
Required BER 10-3
Required Eb/No 4 dB
Max. delay tolerance 40 ms Conversational
(Voice)
Max. allowable packet dropping rate 1% Required BER 10-4 Required Eb/No 3 dB
Max. delay tolerance 100 ms Streaming
(Video)
Max. allowable packet dropping rate 1% Required BER 10-6 Interactive (HTTP) Required E b/No 2 dB Required BER 10-6 Background (FTP) Required E b/No 1.5 dB
4.3 UGT based network selection scheme
The proposed PVCS scheme is compared with the UGT based network selection scheme [12]. When a new call or a handoff call arrives, UGT will find which networks are suitable for the call request first. After obtaining the candidate networks, UGT will compute the utility value from the satisfaction of QoS requirements of the call request and the network preference from predefined cooperative game for each candidate network. Finally, by choosing the maximum linear combination of utility values and network preference from all candidate networks, the most suitable network for the call request can be obtained.
4.4 Simulation Results and Discussions
It is assumed that a call request could only connect to one cell at the same time in this thesis. For each cell, it is assumed that the new call arrival rate of conversational, streaming, interactive, and background traffic class calls in the heterogeneous wireless access environment are AR, AR×1/3, AR×1/3, and AR×1/6 (calls/second), respectively, where AR is the unit arrival rate. In the simulation, AR is chosen from 0.1 to 0.9.
Fig. 4.1 shows the new call blocking rate. It can be found that PVCS has lower new call blocking rate in the high arrival rate. The reason is that PVCS chooses the cell which can minimize overall cell loading differences by using loading factor in order to achieve load balancing. However, UGT selects the cell which has the most resource. It may cause non-real-time calls to be blocked when the cell loading is close to the predefined threshold. The result comparison also implies that the system with PVCS can accommodate more calls than the system with UGT when the arrival rate becomes high. Number of accommodated calls is shown in Fig. 4.2.
Fig. 4.3 shows the handoff call dropping rate, which is defined as the probability that a call will be forced terminated during the call holding time. It can be found that PVCS has lower handoff call dropping rate. The reason is that PVCS utilizes dwell time constraint to reduce forced termination probability and the number of handoff. Nevertheless, UGT may still have the chance to permit a few high mobility MSs to enter and leave the WLAN cells quickly. Some of these MSs may have no enough time to complete handoff procedure due to contention and backoff. Number of total handoff calls is shown in Fig. 4.4.
Moreover, it can be found that the trends of new call blocking rate and handoff call dropping rate are different. That is because the system always reserves 5% resource for handoff calls. When the loading intensity of one cell exceeds 95% of
0.1 0.2 0.3 0.4 0.5 0.6 0.7 0.8 0.9 0 2 4 6 8 10 12 14
Arrival rate (calls/second)
N e w c a ll bl oc k ing r a te (% ) PVCS UGT
Fig. 4.1 : New call blocking rate
0.1 0.2 0.3 0.4 0.5 0.6 0.7 0.8 0.9 0 200 400 600 800 1000 1200 1400 1600 1800 2000
Arrival rate (calls/second)
N u m ber o f a c c o m m o dat e d c al ls PVCS: Total PVCS: WCDMA PVCS: WMAN PVCS: WLAN UGT: Total UGT: WCDMA UGT: WMAN UGT: WLAN
0.1 0.2 0.3 0.4 0.5 0.6 0.7 0.8 0.9 0 0.2 0.4 0.6 0.8 1 1.2
Arrival rate (calls/second)
H a n d o ff c a ll d ro p p in g r a te ( % ) PVCS UGT
Fig. 4.3 : Handoff call dropping rate
0.1 0.2 0.3 0.4 0.5 0.6 0.7 0.8 0.9 0 50 100 150 200 250 300 350 400 450
Arrival rate (calls/second)
N u m be r of t ot al h ando ff c a lls PVCS UGT
predefined threshold, a new call will be blocked immediately. On the other hand, a handoff call will not be dropped until the loading intensity reaches predefined threshold. This causes the new call blocking rate to increase exponentially, while handoff call dropping rate rises slightly when the arrival rate becomes high.
Fig. 4.5 shows the handoff occurrence frequency, which is defined as the average number of handoff that a call has experienced during the call holding time. Generally, the total handoff occurrence frequency in PVCS is about 20% lower than that in UGT. The reason is that PVCS uses dwell time constraint to reduce the number of handoff and the mobility factor in PVCS has higher influence on target cell decision than that in UGT. Besides, it can be found that PVCS has lower real-time and non-real-time handoff occurrence frequency in the high arrival rate. Since the high mobility MS with PVCS has more chances to finish data transmission in the large cell than that with UGT.
0.1 0.2 0.3 0.4 0.5 0.6 0.7 0.8 0.9 0.05 0.1 0.15 0.2 0.25 0.3 0.35 0.4 0.45 0.5 0.55
Arrival rate (calls/second)
H an dof f oc c u renc e f req uenc y PVCS: Total PVCS: real-time PVCS: non-real-time UGT: Total UGT: real-time UGT: non-real-time
Fig. 4.6 shows the total throughput and throughput of each system. It can be found that PVCS has higher total throughput than UGT. Fig. 4.7 (a) and (b) depict the number of accommodated real-time calls and non-real-time calls, respectively. It can be found that PVCS allows more non-real-time calls of WLAN than UGT does. By using PVCS, the non-real-time calls will tend to select WLAN cells, which have the highest capacity by loading factor, so the throughput increment would be significant. Besides, we can also find that the real-time calls in WCDMA cells are more than those in WLAN cells when the arrival rate is low. It is because the allowed data rate in WCDMA and WLAN systems is much higher than the calls’ requirement. The real-time calls will tend to select larger WCDMA cell because of mobility factor. On the other hand, PVCS allows more non-real-time calls in WCDMA cells than UGT does when the arrival rate is high. The reason is that PVCS allows more real-time calls to select WMAN cells than UGT does, so WCDMA cells would have enough resource to accommodate more non-real-time calls. Therefore, the throughput of WCDMA in PVCS gradually approaches that in UGT.
0.1 0.2 0.3 0.4 0.5 0.6 0.7 0.8 0.9 0 5 10 15 20 25 30 35
Arrival rate (calls/second)
A v e rage t hr o ughpu t (M bps ) PVCS: Total PVCS: WCDMA PVCS: WMAN PVCS: WLAN UGT: Total UGT: WCDMA UGT: WMAN UGT: WLAN
0.1 0.2 0.3 0.4 0.5 0.6 0.7 0.8 0.9 0 100 200 300 400 500 600 700
Arrival rate (calls/second)
N u m ber o f ac c om m odat ed r eal -t im e c al l PVCS: WCDMA PVCS: WMAN PVCS: WLAN UGT: WCDMA UGT: WMAN UGT: WLAN
(a) Number of accommodated real-time calls
0.1 0.2 0.3 0.4 0.5 0.6 0.7 0.8 0.9 0 50 100 150 200 250 300
Arrival rate (calls/second)
N um ber of ac c om m odat ed non-real -t im e c al l PVCS: WCDMA PVCS: WMAN PVCS: WLAN UGT: WCDMA UGT: WMAN UGT: WLAN
(b) Number of accommodated non-real-time calls
Fig. 4.7 : (a) Number of accommodated real-time calls (b) Number of accommodated non-real-time calls
The average delay of voice and video calls in the heterogeneous wireless networks are shown in Figs. 4.8 and 4.9, respectively. It can be found that the results of average delay with PVCS and UGT are almost the same in WCDMA and WMAN systems and the delay requirements are all satisfied. The reason is that voice and video calls have the highest priority and the scheduler will serve the real-time calls first. As for the result in WLAN systems, the average delay with UGT only increases slowly. It is because the WLAN cell with the most available resource for the real-time calls is not necessarily the most suitable cell if the mobility of MS is considered. However, it is equally important for the available resource and mobility to decide the target cell in PVCS. Accordingly, the average delay with PVCS is kept low.
The packet dropping rate of voice and video calls are shown in Figs. 4.10 and 4.11, respectively. It can be found that the maximum packet dropping rate requirement is satisfied in both schemes. However, the packet dropping rate of WLAN system is higher in UGT than that in PVCS. The reason is similar to the average delay of WLAN system in UGT. More voice and video calls with high mobility in UGT are allowed to enter the WLAN cell than that in PVCS. Therefore, it increases collision probability and has more chances to exceed the delay tolerance bound. On the contrary, PVCS uses dwell time constraint to prevent high mobility MSs from entering the WLAN cell, so the collision probability can be decreased. Moreover, PVCS would jointly consider the load balancing and handoff occurrence frequency, and the results also show that the candidate cell with the most available resource for the real-time calls is not necessarily the most suitable one. Consequently, the packet dropping rate in WLAN systems for the real-time calls would be improved significantly.
0.1 0.2 0.3 0.4 0.5 0.6 0.7 0.8 0.9 0 5 10 15 20 25 30 35 40
Arrival rate (calls/second)
A v er ag e d el ay of v oi c e t ra ff ic ( m s )
Voice delay requirement PVCS: WCDMA PVCS: WMAN PVCS: WLAN UGT: WCDMA UGT: WMAN UGT: WLAN
Fig. 4.8 : Average delay of voice traffic
0.1 0.2 0.3 0.4 0.5 0.6 0.7 0.8 0.9 0 10 20 30 40 50 60 70 80 90 100
Arrival rate (calls/second)
A v er a ge de lay o f v id eo t ra ff ic ( m s )
Video delay requirement PVCS: WCDMA PVCS: WMAN PVCS: WLAN UGT: WCDMA UGT: WMAN UGT: WLAN
0.1 0.2 0.3 0.4 0.5 0.6 0.7 0.8 0.9 0 0.1 0.2 0.3 0.4 0.5 0.6 0.7 0.8 0.9 1
Arrival rate (calls/second)
P a c k et dr oppi ng r at e of v oi c e t raf fi c ( % )
Packet dropping rate requirement PVCS: WCDMA PVCS: WMAN PVCS: WLAN UGT: WCDMA UGT: WMAN UGT: WLAN
Fig. 4.10 : Packet dropping rate of voice traffic
0.1 0.2 0.3 0.4 0.5 0.6 0.7 0.8 0.9 0 0.1 0.2 0.3 0.4 0.5 0.6 0.7 0.8 0.9 1
Arrival rate (calls/second)
P a c k et dr oppi ng r at e of v ideo t raf fi c ( % )
Packet dropping rate requirement PVCS: WCDMA PVCS: WMAN PVCS: WLAN UGT: WCDMA UGT: WMAN UGT: WLAN
Chapter 5
Conclusions
In this thesis, a preference value-based cell selection (PVCS) scheme is proposed for heterogeneous wireless access environment, where four multimedia services are considered, including conversational, streaming, interactive, and background. The PVCS scheme contains three stages, candidate cells selection,
preference value calculation, and target cell determination. The candidate cells
selection is used to filter out unsuitable cells by checking three thresholds including the received signal strength constraint, cell loading constraint and dwell time constraint. All suitable cells form a candidate cell set. The preference value calculation of each cell in the candidate cell set is optimized by considering the factors of loading, QoS, and mobility to maximize overall system utilization, maintain the call request’s QoS requirements, and minimize handoff occurrence frequency. Finally, the target cell, which has the maximum preference value, could be selected for the call request.
Simulation results show that PVCS scheme can achieve higher total throughput than UGT while satisfying the QoS requirements of each traffic class. The WLAN system has significant improvement in throughput and accommodates more non-real-time calls. In addition, the PVCS scheme has lower new call blocking rate and handoff call dropping rate than UGT, which means the heterogeneous wireless
system with PVCS scheme can accommodate more calls than that with UGT when the arrival rate becomes high. Besides, the total handoff occurrence frequency in PVCS is about 20% lower than that in UGT because PVCS uses dwell time constraint to reduce the number of handoff. As a result, the handoff overhead can be reduced significantly. The average delay and packet dropping rate of real-time calls satisfies QoS requirements in PVCS and UGT, but the results in UGT is slightly higher than those in PVCS in WLAN. It is because that the cell with the most available resource for the real-time calls is not necessarily the most suitable one if the mobility of MS is considered.
Bibliography
[1] M. Katz and F. H. P. Fitzek, “Cooperative Techniques and Principles Enabling Future 4G Wireless Networks,” EUROCON., vol. 1, pp. 21-24, Nov. 2005
[2] H. Chan, P. Fan, and Z. Cao, “A utility-based network selection scheme for multiple services in heterogeneous networks,” IEEE International Conf. on
WNCMC, vol. 2, pp. 1175–1180, June 2005.
[3] O. Ormond, J. Murphy, and G.-M. Muntean, “Utility-based intelligent network selection in beyond 3G systems,” IEEE ICC, vol. 4, pp. 1831–1836, June 2006. [4] F. Bari and V. C. M. Leung, “Automated network selection in a heterogeneous
wireless network environment,” IEEE Network, vol. 21, no. 1, pp. 34-40, Jan.-Feb. 2007.
[5] Y.-H. Chen, N.-Y. Yang, C.-J. Chang, and F.-C. Ren, “A utility function-based access selection method for heterogeneous WCDMA and WLAN networks,”
IEEE 18th International Symposium on PIMRC, pp. 1-5, Sept. 2007.
[6] P. D. Straffin, “Game theory and strategy,” The Mathematical Association of
America, 1993.
[7] A. B. MacKenzie and L. A. DaSilva, “Game theory of wireless engineers,”
Morgan and Claypool, 2006.
[8] J. Antoniou and A. Pitsillides, “4G converged environment: modeling network selection as a game,” IEEE Proc. on IST Conf., pp. 1-5, July 2007.
[9] D. Niyato and E. Hossain, “A cooperative game framework for bandwidth allocation in 4G heterogeneous wireless networks,” IEEE ICC, vol. 9, pp. 4357–4362, June 2006.
[10] D. Niyato and E. Hossain, “A noncooperative game-theoretic framework for radio resource management in 4G heterogeneous wireless access networks,”
IEEE Trans. on Mobile Computing, vol. 7, no. 3, pp. 332-345, March 2008.
[11] D. Charilas, O. Markaki, and E. Tragos, “A theoretical scheme for applying game theory and network selection mechanisms in access admission control,” IEEE
ISWPC, pp. 303-307, May 2008.
[12] T.-L. Tsai, C.-J. Chang, and Y.-H. Chen, “Utility and game-theory based network selection scheme in heterogeneous wireless networks,” IEEE Proc. on WCNC, pp. 1-5, April 2009.
[13] K. H. Suleiman, H. A. Chan, and M. E. Dlodlo, “Load balancing in the call admission control of heterogeneous wireless networks,” IWCMC, July 2006. [14] G. Ning, G. Zhu, L. Peng, and X. Lu, “Load balancing based on traffic selection
in heterogeneous overlapping cellular networks,” The First IEEE and IFIP
International Conference in CANET, Sept. 2005.
[15] G. Ning, G. Zhu, Q. Li, and R. Wu, “Dynamic load balancing based on sojourn time in multitier cellular systems,” IEEE VTC, vol. 1, pp. 111-116, May 2006. [16] Y. U. Chung, D. J. Lee, D. H. Cho, and B. C. Shin, “Macrocell/microcell
selection schemes based on a new velocity estimation in multitier cellular system,” IEEE Trans. on Vehicular Technology, vol. 51, no. 5, pp. 893-903, Sept. 2002.
[17] 3GPP TS 23.271, “Functional stage 2 description of Location Services (LCS), release 8,” V8.0.0, Dec. 2008.
[18] H. Holma and A. Toskala, “WCDMA for UMTS 3rd ed.,” John Wiley and Sons,
Ltd, 2004.
[19] IEEE Std. 802.16e, “IEEE standard for local and metropolitan area networks part 16: air interface for fixed broadband Wireless access systems amendment for physical and medium access control layers for combined fixed and mobile operation in licensed bands,” Oct. 2005.
[20] A. J. Goldsmith and S. G. Chua, “Variable-rate variable-power MQAM for fading channels,” IEEE Trans. on Communications, vol. 45, pp. 1218-1230, Oct. 1997. [21] IEEE Std 802.11™-2007, “IEEE Standard for Wireless LAN Medium Access
Control (MAC) and Physical Layer (PHY) specifications: MAC sublayer functional description,” June 2007.
[22] 3GPP TR 25.892, “Feasibility study for OFDM for UTRAN enhancement, release 6,” V6.0.0, 2004-06.
[23] G. L. Stuber, “Principles of Mobile Communication 2nd ed.,” Kluwer Academic, 1958
[24] 3GPP TS 23.107, “QoS concept and architecture, release 6,” V6.4.0, Mar. 2006. [25] Universal Mobile Telecommunication System, “Selection procedures for the
choice of radio transmission technologies of the UMTS”, UMTS Std. 30.03, 1998.
[26] R. Guerin, H. Ahmadi, and M. Naghshineh, “Equivalent capacity and its application to bandwidth allocation in high-speed networks,” IEEE Journal on
Vita
Chih-Yuan Hsieh was born in 1984 in Pingtung, Taiwan. He received the B.E. and M.E. degree in the department of communication engineering, college of electrical and computer engineering from National Chiao-Tung University, Hsinchu, Taiwan, in 2007 and 2009, respectively. His research interests include radio resource management and wireless communication systems.