Contents lists available atScienceDirect
Landscape and Urban Planning
journal homepage:www.elsevier.com/locate/landurbplanLinkage between residential green spaces and allergic rhinitis among Asian
children (case study: Taiwan)
Hsiao-Yun Lee
a, Yan-Huei Wu
b, Aji Kusumaning Asri
c, Tsun-Hsuan Chen
d, Wen-Chi Pan
e,
Chia-Pin Yu
f, Huey-Jen Su
g, Chih-Da Wu
c,h,⁎aDepartment of Leisure Industry and Health Promotion, National Taipei University of Nursing and Health Sciences, Taipei 112, Taiwan bDepartment of Forestry and Natural Resources, National Chiayi University, Chiayi 600, Taiwan
cDepartment of Geomatics, National Cheng Kung University, Tainan 701, Taiwan
dDepartment of Epidemiology, Human Genetics and Environmental Sciences, The University of Texas Health Science Center at Houston (UTHealth) School of Public Health,
Houston, TX 77030, USA
eInstitute of Environmental and Occupational Health Sciences, National Yang-Ming University, Taipei 112 Taiwan fSchool of Forestry and Resource Conservation, National Taiwan University, Taipei 106, Taiwan
gDepartment of Environmental and Occupational Health, National Cheng Kung University, Tainan 701, Taiwan hNational Institute of Environmental Health Sciences, National Health Research Institutes, Miaoli 350, Taiwan
A R T I C L E I N F O
Keywords: Allergic rhinitis (AR) Asian children Cohort study
Normalized difference vegetation index (NDVI) Residential green space
Urban climate
A B S T R A C T
Background: The prevalence of allergic rhinitis (AR) continues to increase, and the greatest increases were observed mostly in non-Western regions, particularly Asian and Pacific regions; however, only a few studies have been conducted in Asia.
Objectives: Using Taiwan as an example of a typical Asian country, this study aimed to evaluate the association between green areas and the frequency of clinical visits for AR among children in Asia.
Methods: We used the Longitudinal Health Insurance Database to identify subjects diagnosed with AR at four years old in 2003, who were then followed up with until 2011. Greenness exposure was assessed using the MODIS Normalized Difference Vegetation Index (NDVI). The Generalized Additive Mixed Model (GAMM) was applied to examine the association between green areas and the rate of AR after controlling for confounders. Results: The major results indicate a positive correlation, as green areas significantly increased the risk of AR by up to 8.4%. Further, sensitivity test analyses confirmed the robustness of the model estimates, even after ad-justing for confounders. Stratified analysis results also display areas with high humidity and low temperatures increasing the risk of AR by up to 14% and 27%, respectively. In contrast, areas with low humidity and high temperatures decreased the risk of AR by up to 4% and 22%, respectively. Moreover, the positive relationship between greenness and AR among children was consistent across different sub-populations.
Conclusions: Greenness exposure contributes to an increased risk of allergic rhinitis (AR). Thisfinding could serve as a reference for designing green landscapes, especially in residential areas.
1. Introduction
Allergic rhinitis (AR) is the most common allergic disease, affecting more than 400 million people worldwide (Dykewicz & Hamilos, 2010). AR is an immunoglobulin E (IgE)-driven inflammation of the nasal mucosa induced by allergen exposure that causes major illness, impairs quality of life, and is responsible for reduced levels of work productivity and school performance. However, the causes of AR are complex and diagnosis is not straight-forward, meaning there exists a risk for un-derdiagnosis. Moreover, the general belief flu-like symptoms do not
warrant medical attention leads patients to choose over-the-counter medicines rather than to visit a doctor. Despite the fact there may be more cost-effective ways of treating AR in the long-term, antihistamines are the most commonly used medicine in the treatment of allergies (Kuna, 2016). With that in mind, the aforementioned prevalence of AR and the burden of medication costs may both be underestimated, which insinuates that this is a more serious public health problem than people realize.
AR is often caused by exposure to perennial or seasonal allergens that exist in indoor and outdoor environments. Among the most
https://doi.org/10.1016/j.landurbplan.2020.103868
Received 3 August 2019; Received in revised form 10 April 2020; Accepted 28 May 2020
⁎Corresponding author at: Department of Geomatics, National Cheng Kung University, Tainan 701, Taiwan. E-mail address:[email protected](C.-D. Wu).
Landscape and Urban Planning 202 (2020) 103868
Available online 07 June 2020
0169-2046/ © 2020 Elsevier B.V. All rights reserved.
common allergens, Wang said pollen from greenness exposure or ve-getation (e.g. weeds, trees, and grass) is the main cause of seasonal AR (Wang, 2005). In fact, in tropical and subtropical areas pollen may become a perennial allergen. Although AR is prevalent at all ages, sensitivity to allergens may begin in early childhood (Prescott, 1999). Children can exhibit symptoms of allergies and even be diagnosed with AR when the immune system isfirst exposed is allergens. Regarding allergens from green exposure, a previous cohort study reported re-sidential greenness was positively related to allergic rhinitis in children ages 6–8 years old (Fuertes, 2016).
While time spent in natural environments has been linked to several positive health outcomes, the evidence for time spent in natural en-vironments being linked to a reduction in allergies remains limited and are not consistent (Lambert, 2017). A study conducted in Finland found exposure to residential greenness could alleviate the atopic sensitiza-tion of children (Ruokolainen, 2015). However, a study conducted in Lithuania came to the opposite conclusion that exposure to residential greenness was associated with slightly increased risks of asthma in children (Andrusaityte, 2016). Moreover, a study conducted in Ger-many found greenness effects varied depending on geographic regions and the degree of urbanization. The risks of AR were found to be ele-vated with residential greenness in the urban area, while, on the con-trary, residential greenness showed a protective effect of aeroallergen sensitization in the rural area (Fuertes, 2014). Given the mixedfindings and heterogeneous associations between residential greenness and AR, studies varying in geography, urbanization and populations are needed to further clarify the role of greenness on AR.
Furthermore, the prevalence of AR continues to increase and the greatest increases were observed mostly in non-Western regions, par-ticularly Asian and Pacific regions; however, only a few studies have been conducted in Asia. Along with rapid economic growth and in-creased urbanization, not to mention the considerable high levels of air pollution, the prevalence of allergies has increased rapidly in Asia, and there are wide inter-and intra-regional differences (Pawankar, 2020; Zhang, Qiu, Chung, & Huang, 2015). Situated in the western Pacific on the Tropic of Cancer, Taiwan encompasses a range of climates, varying from subtropical in the north to tropical in the south, and temperate in
the mountainous regions. This marine tropical climate nurtures a wide variety of vegetation and may play an important role in housing al-lergens which contribute to the development of AR. It was estimated 10.9% of preschool children were diagnosed with AR between 2007 and 2011 in Taiwan (Chung, Hsieh, Tseng, & Yiin, 2016). Because of the high prevalence of childhood AR and variation of climate features and vegetation structures in Taiwan, it is an ideal country for studying spatial heterogeneity. By integrating the health information from a nationwide cohort database and spectrum-based greenness measuments, this study aims to investigate the relationship between re-sidential greenness and childhood AR in Taiwan, positing Taiwan as representative of countries in Asia.
2. Materials and methods
2.1. Longitudinal Health INSURANCE Database (LHID2000)
Data collection for the Longitudinal Health Insurance Database (LHID2000) occurred from 2003 to 2011 and was used to diagnose children with allergic rhinitis (ICD-9-CM 477, 4770, 4778, 4779). LHID2000 is a nationally representative health database in Taiwan that randomly sampled beneficiaries of the National Health Insurance pro-gram. This dataset provides de-identified information of a million participants, and this information includes age, gender, date of birth, and International Classification of Diseases, Ninth Revision-Clinical Modification (ICD-9-CM) diagnosis codes. In this cohort study the participants were children diagnosed with allergic rhinitis (AR) at the age of 4 in 2003, and these children were followed up with to age 12 in 2011. Children under four years old in 2003 were excluded due to the high number of missing data in this age group. Moreover, because viral respiratory infections occur frequently in young children with similar symptoms as AR, it is difficult to diagnose AR in children under four years. In total, we identified 11,281 children at the age of four in 2003 and the sample size remained stable in the follow-up year. The number of outpatient children for AR was then aggregated by season at the township level. For model adjustments, information was obtained from LHID2000 regarding the sex ratio and population size of children at the Fig. 1. The geographic location of Taiwan and the population size at township level during the study period.
township level. Moreover, the location of the hospital or clinics where subjects visited was identified as the proxy of the subjects' residence areas.Fig. 1shows the geographic location of study areas and the po-pulation size at the township level during the study period.
2.2. Assessment of residential greenness
Residential greenness exposure was assessed using the MODIS Normalized Difference Vegetation Index (NDVI). The NDVI is a sa-tellite-image-based vegetation index provided by the National Aeronautics and area Administration (NASA) for measuring and mon-itoring plant growth, vegetation cover, and biomass production, as well as for representing the information of greenness including leaf area, chlorophyll, and canopy structure (Gascon, 2016). This measurement is based on chlorophyll from plants, which absorbs visible light to be used in photosynthesis while leaves reflect near-infrared light. The relative algorithm of NDVI produces a range of values from−1.0 to 1.0 with positive values indicating more green vegetation and negative values indicating non-vegetation features, such as rocks, soil, water, snow, ice, and clouds (Wu, 2017). The NDVI data are provided every 16 days with a 250 m spatial resolution as a gridded product in the sinusoidal pro-jection (Chen, 2006). This study used MODIS NDVI because a single MODIS NDVI image can cover the entire island of Taiwan, and this avoids the problems encountered in using other higher resolution sa-tellite images that cannot cover the entire island in one image. Linked to this study, other applications of NDVI have been mapped for vege-tation and allergens: specifically, a satellite-based map of onset of birch flowering (Karlsen et al., 2009), as well as identifying urban sources as causes of elevated grass pollen concentrations using GIS and remote sensing (Skjøth et al., 2013).
We used seasonal resolution of NDVI from 2003 to 2011 as the long-term exposure. Images from January, April, July, and October represent NDVI in winter, spring, summer, and autumn, respectively. Therefore, for each NDVI value 36 images were combined to generate a map for study area at the township level. Geocoding processes were performed using ArcGIS 10.5 (ESRI, Redlands, California, US). In addition to natural greenness exposure from NDVI we also considered exposure to artificial greenness. GIS-based urban park areas (%) on the township scale were used in the model development.
2.3. Data set of confounders
In this study, we employedfive datasets, each of which controlled for confounding variables in the model development, variables in-cluding (1) Meteorological database; (2) Air quality database (re-presented by PM2.5 exposures); (3) Socioeconomic status; (4) Road network; (5) Industrial areas; and (6) Township urbanization level. 2.3.1. Meteorological database
Previous study denoted meteorological elements as potentially im-pacting allergies or stimulating asthma (D’Amato, 2016). In order to account for meteorological factors, we included air temperatures and relative humidity in the analysis with data obtained from the Central Weather Bureau. An Ordinary Kriging interpolation combined with a spherical semi-variogram model was used to generate the gradient surface of these meteorological variables. Averaged air temperature and relative humidity from the interpolated estimates were then calculated at the township level.
2.3.2. Air quality database
Several studies have demonstrated the association between air pollution and AR (Hwang, Jaakkola, Lee, Lin, & Guo, 2006; Teng, 2017). Among all known pollutants, fine particulate matter, or PM2.5 (i.e. atmospheric particles with a diameter less than 2.5 µm), has been discussed the most. Because of its small size, PM2.5can enter the body through the respiratory system and increase the risk of respiratory
diseases and cardiovascular diseases (Fanizza, 2018). Since it has such a clear impact on human health, PM2.5was included in the study; con-centration of PM2.5 was obtained from an air-quality database and further interpolated using ordinary kriging with a spherical semi-var-iogram model at the township level. In Taiwan, PM2.5wasfirst mon-itored and recorded in 2006, while the records of particulate matter (PM10) can be traced dating back to 1997. Since previous studies have found a strong correlation between PM2.5and PM10, concentrations of PM2.5during 2003–2005 were imputed using a simple linear regression model developed between these two pollutants at each monitoring station. With a median R2value of 0.83, µg/m3,the developed regres-sion model showed a high explanatory power to estimate PM2.5 dis-tributions from PM10in the earlier years (Wu, 2017).
2.3.3. Socioeconomic status
Studies have suggested AR is more prevalent in higher socio-economic status (SES) groups (Torfi, Bitarafan, & Rajabi, 2015). There was a positive relationship between prevalence of AR and SES in South Africa (Mercer, 2004). We incorporated income tax as a surrogate for SES and the information was retrieved from an income tax statistics database prepared by the Fiscal Information Agency–Financial and Taxation Data Processing and Examination Center (2020).
2.3.4. Road network
Data from the Ministry of Transportation and Communications, Taiwan (2020) reported the registered motor vehicle numbers (in-cluding both motorbikes and cars) reached 22 million, with a vehicle density of nearly 93.8 vehicles per 100 people. Vehicle density being this high-highlights how traffic and pollution can impact AR. A study conducted in South Australia showed a strong correlation between chronic respiratory diseases and a higher density of motor vehicles in a population (Nitschke, 2016). Due to the limited availability of vehicle density data for all townships in Taiwan, this study used the 2005 road network digital atlas data as representative. A previous study noted how traffic flow theory postulates that vehicle density is closely related to road networks (Horvat, Kos, &Ševrović, 2015). Referring to that related study, we have assessed whether there is a relationship between vehicle density and the road network in Taiwan. Using vehicle density survey data available for 41 townships in northern Taiwan and ap-plying Spearman correlation analysis, we found a significant positive relationship between vehicle density and road networks (r = 0.40, p-value = < 0.001). Moreover, we considered this confounder because the previous study showed roadway conditions may increase the pre-valence of allergic respiratory symptoms in children (Porebski, Woźniak, & Czarnobilska, 2014).
2.3.5. Industrial area database
A previous study indicated an association between density of in-dustrial areas and respiratory diseases (Yuzbekov & Yuzbekov, 2015). To eliminate the effect of industrial areas on the risk of AR, a 2010 map of the industrial park was obtained from the Industrial Development Bureau and was used to calculate the percentage of the industrial area of each township, which was then included in the model as a con-founding variable.
2.3.6. Urbanization level
The urban degree of each township was considered in this study because of the possibility of differences in the impact of greenness ex-posure between urban hubs and areas outside of those hubs. In the developed models, two confounding variables, population size and township income tax level, have been considered for to adjust for the effects of urbanization. Population size is strongly associated with built areas, which also impacts the presence of urban green spaces and townships’ abilities to provide ecosystem services (Tian, Jim, Tao, & Shi, 2011). Also, townships’ income tax levels were considered since economic conditions can be strongly correlated with urban
development (Tian et al., 2011). 2.4. Statistical analysis and sensitivity test
Descriptive statistics were performed to describe the distribution of outpatients for AR visits among children by metropolitan areas, as well as for the spatial temporal trend in Taiwan. In generating the main model, the Generalized Additive Mixed Model (GAMM) was used to estimate, controlling for confounding variables, the impacts of re-sidential greenness on outpatient children with AR. Other covariates, such as population size and sex ratio at the township level, year, season, and spatial-temporal autocorrelation were also included. Given the fixed effects and random effects in calculations, GAMM provides a more flexible approach for analyzing count outcomes and has been used in several studies to assess the relationship between environmental ex-posures and health outcomes (Fang et al., 2016; Xu et al., 2014).
To evaluate the robustness of the association models a sensitivity test analysis was applied using three approaches. The sensitivity test is designed to gradually enter confounding variables one by one. This test seeks to determine whether the effects of exposure to AR will remain stable even with the removal of confounding factors. First, we included different variables (confounders) in five separate models to discern the change of coefficients and relative risks. In detail, Model 1 included only residential greenness; Model 2 included both residential greenness and meteorological variable; Model 3 included the variables in Model 2 in addition to PM2.5exposures; Model 4 included demographic statistics such as townships’ urbanization levels, and child population and the sex ratio were further adjusted; and Model 5 included townships’ income tax rates to merit adjusting economic factors. Second, we included an indication of city as a mean of differentiated urbanicity. Previous stu-dies have shown greenness effects vary depending on geographic re-gions and degree of urbanization (Fuertes, 2014). Prior analysis showed three metropolitan areas (i.e. Taipei City, New Taipei City, and
Kaohsiung city) were associated with a higher number of hospital visits among children for AR. Hence, Model 6 included both Taipei City and New Taipei city (so-called as Taipei metropolis), and Model 7 included all three metropolitan areas (Taipei metropolis and Kaohsiung City) as part of the sensitivity analysis. Third, we considered exposure to arti-ficial greenness such as park areas. For Model 8 GIS-based urban park areas (%) on the township scale were used in the model development. 2.5. Stratified analysis
Stratified analysis was performed to identify the effects of greenness among different conditions in relation to children with AR. Variation in seasonal and weather factors was then assessed to identify differences in greenness effects on AR. Season not only affects the condition of greenness or vegetation but also the amount of allergens produced. Thus, this study developed four association models based on seasonal conditions in Taiwan (winter, spring, summer, and fall). Furthermore, weather factors were found to be a potential effect modifier in relation to greenness and allergic rhinitis (D’Amato, 2016; Ouyang, 2017). The median of humidity (high humidity is ≥median and low humidity is < median) and median of air temperature (high temperature is ≥median and low temperature is < median) were the thresholds ap-plied in the subsequent analysis based on weather factors. This double-stratified analysis also considers all confounding variables (pollutants represented by PM2.5concentrations, socioeconomic status, road net-work, industrial area, population size, sex ratio, year, season, air tem-perature, relative humidity, township urbanization level, and spatial-temporal autocorrelation).
All the statistical analyses were performed using R version 3.3.2 (The R packages Foundation for Statistical Computing, Vienna, Austria) and SAS version 9.4 (Cary, NC). Coefficient and risk estimates with corresponding confidence intervals (CIs) of 95% were reported and p-values < 0.05 were considered statistically significant.
3. Results
3.1. Descriptive statistics
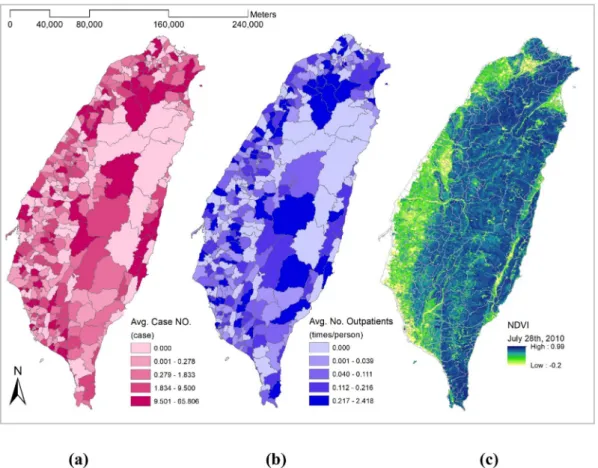
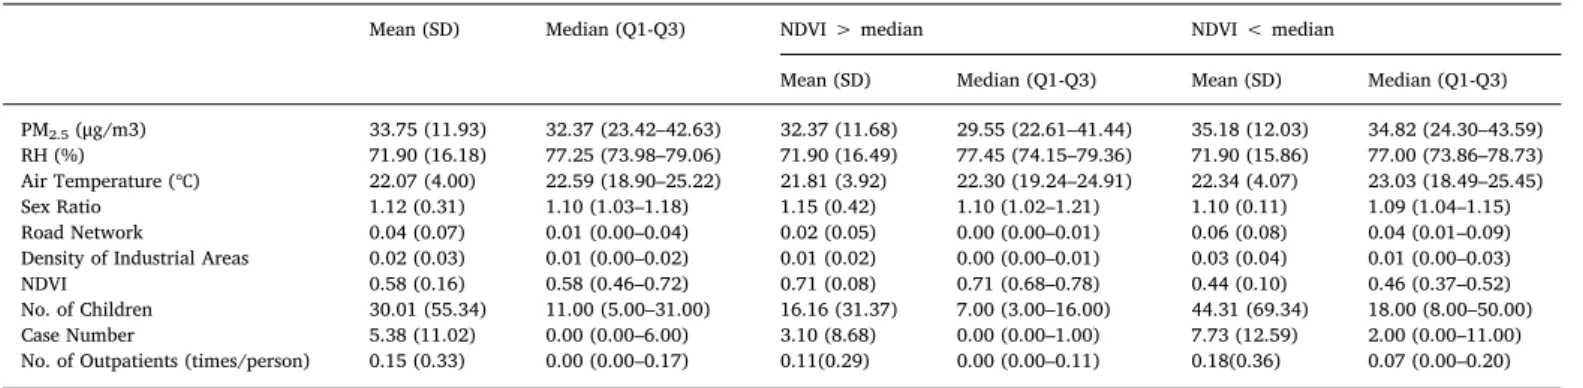
Fig. 2shows the highest NDVI was found from the central moun-tainous area to the eastern portion of the island, while no obvious spatial pattern was found in the counts of AR cases nor the average counts of outpatient visits per person-times. Higher counts of AR cases were found sporadically spread throughout the western two-thirds of the island. Table 1presents the distribution of all the covariates in-cluded in the study from 2003 to 2011. Consistent with the NDVI map generated inFig. 2, Taiwan had a moderate to high NDVI value of 0.58, indicating dense vegetation coverage. The average air temperature and relative humidity were 22.07 degrees Celsius (℃) and 71.9%, respec-tively. The concentration of PM2.5ranged from 32.37 to 35.18μg/m3, with slightly higher concentration found in lower NDVI (NDVI < median) areas. In general, air temperature, road network, and density of industrial areas, size of child population, counts of AR visits, and the number of outpatients tended to be higher in lower NDVI areas com-pared to higher NDVI areas.
3.2. Generalized additive mixed model analysis and sensitivity test Table 2shows the results of the statistical analysis related to the linkage between green areas and allergic rhinitis. After adjusting for confounding variables the main model in this study showed a positive correlation between green areas at the township level and the number of allergic rhinitis outpatient visits among children (coefficient 95% CI = 0.081). Moreover, this model shows greenness correlates sig-nificantly with an increased risk of allergic rhinitis, with a relative risk of 1.084 (p-value < 0.01). This value indicates a one unit increase in
greenness as represented by NDVI will increase the risk of allergic rhinitis among children by up to 8.4%.
To determine the robustness of the association, this study developed models in the analysis by considering different confounding variables. Reflecting the first approach, which only included the greenness vari-able, Model 1 shows a significant positive correlation between green areas and allergic rhinitis, with a relative risk of 1.111 (coefficient 95% CI = 0.106, p-value < 0.05). Model 2 examines weather (relative hu-midity and air temperature) as the key variable and found green areas to have a positive correlation with allergic rhinitis and a relative risk of 1.102 (coefficient 95% CI = 0.097, p-value < 0.05). Model 3 shows the relationship between green areas and allergic rhinitis considering the weather and air pollution (represented by PM2.5) has a positive correlation with a relative risk of 1.105 (coefficient 95% CI = 0.099, p-value < 0.05). Model 4 considered demographic factors besides weather variables and PM2.5,and it shows green areas to have a relative risk of 1.089 (coefficient 95% CI = 0.099, p-value < 0.05) in relation to increased cases of allergic rhinitis. Model 5 also shows a significant positive correlation between green areas and allergic rhinitis, using adjusted economic status in analysis, with a relative risk of 1.082 (coefficient 95% CI = 0.079, p-value < 0.01). The results reflect a statistically significant relationship between green areas and the in-creased number of outpatient visits for allergic rhinitis among children. Moreover, the models also show a stable estimation, as indicated by the number of coefficients not changing significantly.
Reflecting the second approach of our sensitivity tests, Model 6 and Model 7 focused on three metropolitan areas (i.e., Taipei City, New Taipei, City, Kaohsiung City) in examining the relationship between green areas and the number of hospital visits for allergic rhinitis. Model 6 considered Taipei City and New Taipei City (Taipei Metropolis) and found a relative risk of 1.14 (coefficient 95% CI = 0.13, p-value < Table 1
Descriptive statistics.
Mean (SD) Median (Q1-Q3) NDVI > median NDVI < median
Mean (SD) Median (Q1-Q3) Mean (SD) Median (Q1-Q3)
PM2.5(μg/m3) 33.75 (11.93) 32.37 (23.42–42.63) 32.37 (11.68) 29.55 (22.61–41.44) 35.18 (12.03) 34.82 (24.30–43.59)
RH (%) 71.90 (16.18) 77.25 (73.98–79.06) 71.90 (16.49) 77.45 (74.15–79.36) 71.90 (15.86) 77.00 (73.86–78.73) Air Temperature (℃) 22.07 (4.00) 22.59 (18.90–25.22) 21.81 (3.92) 22.30 (19.24–24.91) 22.34 (4.07) 23.03 (18.49–25.45) Sex Ratio 1.12 (0.31) 1.10 (1.03–1.18) 1.15 (0.42) 1.10 (1.02–1.21) 1.10 (0.11) 1.09 (1.04–1.15) Road Network 0.04 (0.07) 0.01 (0.00–0.04) 0.02 (0.05) 0.00 (0.00–0.01) 0.06 (0.08) 0.04 (0.01–0.09) Density of Industrial Areas 0.02 (0.03) 0.01 (0.00–0.02) 0.01 (0.02) 0.00 (0.00–0.01) 0.03 (0.04) 0.01 (0.00–0.03) NDVI 0.58 (0.16) 0.58 (0.46–0.72) 0.71 (0.08) 0.71 (0.68–0.78) 0.44 (0.10) 0.46 (0.37–0.52) No. of Children 30.01 (55.34) 11.00 (5.00–31.00) 16.16 (31.37) 7.00 (3.00–16.00) 44.31 (69.34) 18.00 (8.00–50.00) Case Number 5.38 (11.02) 0.00 (0.00–6.00) 3.10 (8.68) 0.00 (0.00–1.00) 7.73 (12.59) 2.00 (0.00–11.00) No. of Outpatients (times/person) 0.15 (0.33) 0.00 (0.00–0.17) 0.11(0.29) 0.00 (0.00–0.11) 0.18(0.36) 0.07 (0.00–0.20)
Table 2
GAMM analysis and sensitivity test.
Models Coefficient (95% CI) RR (95% CI) p-value
Main Modela 0.081 (0.057, 0.105) 1.084 (1.059, 1.111) < 0.01
Sensitivity test adjusted by confounders
Model 1(Green areas)b 0.106 (0.022, 0.190) 1.111 (1.022, 1.209) < 0.05
Model 2(Green areas + Weather)b 0.097 (0.012, 0.181) 1.102 (1.012, 1.198) < 0.05
Model 3(Green areas + Weather + PM2.5)b 0.099 (0.015, 0.184) 1.105 (1.015, 1.202) < 0.05
Model 4(Green areas + Weather + PM2.5+ Township children population + Sex)b 0.085 (0.0002, 0.170) 1.089 (1.001, 1.185) < 0.05
Model 5(Green areas + Weather + PM2.5+ Township children population + Sex + Income Tax)b 0.079 (0.039, 0.119) 1.082 (1.040, 1.126) < 0.01
Sensitivity test for metropolitan areas
Model 6(Taipei metropolis)a 0.13 (0.07, 0.19) 1.14 (1.07, 1.21) < 0.01
Model 7(Taipei metropolis + Kaohsiung city)a 0.13 (0.03, 0.23) 1.14 (1.03, 1.26) < 0.05
Sensitivity test for artificial green areas
Model 8(% of urban park areas)a 0.056 (0.055–0.056) 1.057 (1.056–1.058) < 0.01
a Confounding-variables included air temperature, relative humidity, PM
2.5concentrations, socioeconomic status (income tax level as a proxy), road network, industrial area, population size, sex ratio, year, season, township urbanization level, and spatial-temporal autocorrelation.
b Additionally adjusted for township children population size, year, season, and spatial-temporal autocorrelation
0.01). Having considered all the potential confounders, this value in-dicates one unit of NDVI will significantly increase the risk of allergic rhinitis by up to 14%. Similar results are also listed in Model 7, which included all three metropolitan areas (Taipei Metropolis and Kaohsiung City). Moreover, having considered urban park areas in Model 8, this study can claim consistentfindings that greenness may increase the risk of AR in outpatient children. For every 1% increase in urban parks, the risk of AR increases by 5.7% (RR: 1.057, coefficient 95% CI = 0.106, p-value < 0.01).
3.3. Stratified analysis
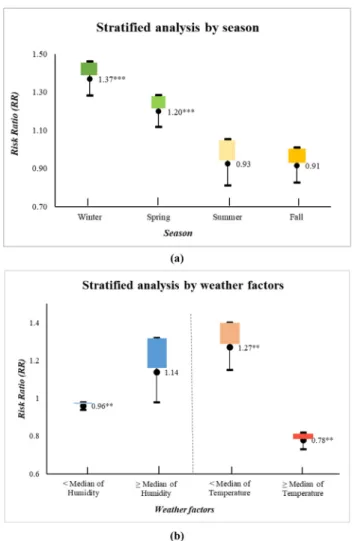
As shown inFig. 3(a), from the four seasons analyzed we found a significant positive correlation between greenness and AR in the cold season. We identified that for one unit increase in NDVI the risk of allergic rhinitis in children would increase by up to 36.9% (RR = 1.369, coefficient 95% CI = 0.314, p-value < 0.001) in winter and 19.9% (RR = 1. 199, coefficient 95% CI = 0.181, p-value < 0.001) in spring. The results of stratified analysis by weather factors, including relative humidity and air temperature, with all adjusted confounders are shown inFig. 3(b). Using the median as a threshold, we found green areas to have a positive correlation with AR and the value of relative risk to be 1.14 (coefficient 95% CI = 0.13, p-value 0.09) in areas with high hu-midity (≧median of huhu-midity). Meanwhile, green areas have a
significant negative correlation with AR and the value of relative risk is 0.96 (coefficient 95% CI = −0.04, p-value < 0.01) in areas with low humidity (< median of humidity). These results indicate, in relation to greenness exposures, the higher humidity areas will have increased rates of allergic rhinitis by up to 14%, and the lower humidity areas will have decreased rates of allergic rhinitis by up to 4%. Different results were found in stratifying by air temperature. We found green areas to have a significant negative correlation with AR and a relative risk of 0.78 (coefficient 95% CI = -0.25, p-value < 0.01) in areas with high temperature (≧median of temperature). In contrast, green areas had a significant positive correlation with AR and a relative risk of 1.27 (coefficient 95% CI = 0.24, p-value < 0.01) in the areas with low temperature (< median of temperature). These findings indicate, in relation to greenness exposures, areas with high temperatures can de-crease the rate of allergic rhinitis by up to 22%, and areas with lower temperatures can increase the rate of allergic rhinitis by up to 27%. In sum, the stratification analyses indicate areas with high humidity and low temperatures can increase the number of hospital visits for allergic rhinitis. Therefore, areas with low humidity and high temperatures can decrease the rate of allergic rhinitis attributable to green areas among children.
4. Discussion
Although the association between green areas and allergic rhinitis has been discussed in previous studies (Andrusaityte, 2016; Fuertes, 2016; Payam, 2014), the majority of them focused on Western countries rather than Asian countries. Research on allergic rhinitis in relation to several influencing factors are lacking in Asia (Liao, 2009). Given that prevalence of allergic rhinitis in developing countries has been in-creasing, more studies focusing on Asian countries are needed. This study, examining the long-term effects of greenness exposure on allergic rhinitis in Taiwan, can be viewed as a representative study of Asia.
4.1. Greenness and allergic rhinitis
A sizable body of literature demonstrated the health benefits of greenness, including improved psychological health and increased le-vels of physical activity (Amano, Butt, & Peh, 2018). Nonetheless, greenness could have the opposite effect in terms of AR in children. In other words, green areas could increase risk of having AR, and poten-tially even worsen the condition of AR among children. Thisfinding is consistent with previous studies about AR among children (Fuertes et al., 2014; 2016). The reason for increased prevalence of AR may be pollen from greenness.Shakurnia (2013)indicated outdoor allergens, such as pollen from greenness, are the most common allergens. Un-fortunately, greenness is a source of a large amount of pollen, occurring not only temperate areas, but also in subtropical and tropical areas (Dudek, Kasprzyk, & Dulska-Jez, 2018; Wu, Su, Lung, Chen, & Lin, 2019).Wu et al. (2019)conducted a study in Taiwan located in sub-tropical and sub-tropical zones and found vegetation pollen to be an ample allergen found in Taiwan, thus increasing clinical risk for asthma and allergies within the Taiwanese population. A previous study reported the pollen sensitivity rate in patients with respiratory allergies to be nearly 9% for green vegetation, such as rice fields, and rice is the dominant crop in Taiwan (Huang, Chen, Guo, Chang, & Tsou, 1998). Pollen is more than just a seasonal allergen; Wang’s study (2005) ad-dressed how pollen may become a perennial allergen in tropical and subtropical areas (Wang, 2005). In sum, natural greenness increases the risk among children to experience AR. It may be because nature green areas are generally composed of diverse plants which are sources of pollen. Accordingly, future studies are recommended in order to dis-tinguish which kinds of plants may be the major sources of pollen causing allergic rhinitis.
Fig. 3. Stratified analyses by (a) season and (b) weather factors, related to the linkage between allergic rhinitis and green areas. Confounding variables in-cluded air temperature and relative humidity, PM2.5 concentrations, socio-economic status (income tax level as a proxy), road network, industrial area, township children population size, sex ratio, year, township urbanization level, and spatial-temporal autocorrelation.
4.2. Season, weather and allergic rhinitis
The results of this study demonstrated how both season and weather are important factors influencing the risk of experiencing AR. For in-stance, children are more likely to experience AR during the winter and spring seasons. Moreover, low temperature and high humidity increase risks of children experiencing AR. The study results are consistent with previous studies conducted in Taiwan.Kao, Huang, Ou, and See (2005) surveyed 6190 first grade (ages 6–8) and eight grade (ages 13–15) students in Taiwan. They found that winter, especially December, was peak season for rhinitis in both age groups. They made assumptions that the high prevalence of rhinitis in winter in Taiwan might be due to the high humidity in its subtropical climate (Kao et al., 2005). In another study conducted in Taiwan,Wu et al. (2019)tried to identify the major aeroallergen in Taiwan and found that pollen from Broussonetia pa-pyrifera plays an important role in allergen sensitivity in Taiwan. Furthermore, pollen of Broussonetia papyrifera is abundant in spring because the warmer weather enhances pollen quantity (Ito, 2015; Wu et al., 2019). So, it is not a surprise hospital visits increase for allergic illness during that time of year. Given that Taiwan is located in tropical and subtropical zones, winter and spring seasons in Taiwan are cold and humid, leading to higher risks of experiencing AR. Accordingly, re-sidents in this area or in areas with similar weather conditions should have preventive strategies to protect against AR. In indoor environ-ments, dehumidifiers may be used to lower humility levels. In outdoor environments, plants with allergy pollens (e.g. Broussonetia papyrifera) should be avoided, or residents should wear facial masks when exposed to the allergens.
This study is thefirst to focus on Taiwan by using nine years of a data from a cohort study in order to examine the relationship between green areas and allergic rhinitis in children. The extensiveness of the study’s scope is expected to make contributions to policymaking and further studies. Given that study results show a positive association between green areas and the number of outpatient visits for allergic rhinitis among children, it is suggested government-and-related de-partments examine present species of plants comprehensively. Plants, some that produce a large number of allergens, may be transplanted to areas far away from residents. Although green areas are proven to offer health benefits, species of plants causing allergies should be considered when performing urban planning. Needs of vulnerable groups such as children should be considered.
Multiple sensitivity analyses and stratified analyses were conducted in this study and their consistent results demonstrate the robustness of the studyfindings. Nonetheless, several limitations should be noted in this study. First, we were unable to obtain the AR outpatients’ ad-dresses. Therefore, we used the location of the hospital or clinics where subjects visited to represent the subjects’ areas of residence. Second, due to the limitation of residential green space data for all townships in Taiwan we used NDVI data that does not specifically identify vegetation characteristics such as variations of plant species. Considering plant variations that may affect the amount of allergen production (e.g. pollen) will be performed in a future study. Third, Dávila's study shows genetic factors may be implicated in AR (Dávila, 2009) and we have not included that in the analysis. Therefore, for further study, a genetic analysis must be considered. Lastly, this study used aggregated data for analysis, so it is suggested future studies conduct cohort studies at the individual level.
5. Conclusion
The results displayed a positive relationship between green areas and the number of outpatient visits for allergic rhinitis among children. Further, the developed models were consistent in theirfindings, even with the removal of confounding variables. It should be noted that urbanization is still in progress, and proper urban planning is critical to our lives. When living environments include the appropriate plants, not
only the health of residents but even weather and outdoor conditions can be improved. Moreover, the main findings from this study also suggest patients with allergic rhinitis should reduce visits to green areas that are the source of allergens (e.g. pollen).
Acknowledgements
This research was funded by Ministry of Science and Technology, Taiwan, grant number MOST 2813-C-006-200-M and MOST 107-2119-M-006-030. This study is based in part on data from the National Health Insurance Research Database provided by the National Health Insurance Administration, Ministry of Health and Welfare and managed by National Health Research Institutes (Registered number NHIRD-104-139). We also appreciate USGS and NASA for their supports in pro-viding the land use and GIS database.
References
Amano, T., Butt, I., & Peh, K. S. (2018). The importance of green spaces to public health: A multi-continental analysis. Ecological Applications, 28(6), 1473–1480.https://doi. org/10.1002/eap.1748.
Andrusaityte, S., et al. (2016). Associations between neighbourhood greenness and asthma in preschool children in Kaunas, Lithuania: A case–control study. British Medicine Journal, 6, e010341.https://doi.org/10.1136/bmjopen-2015-010341. Chen, P.-Y., et al. (2006). Assessment of MODIS-EVI, MODIS-NDVI and vegetation-NDVI
composite data using agricultural measurements: An example at cornfields in wes-tern Mexico. Environmental Monitoring and Assessment, 119, 69–82.https://doi.org/ 10.1007/s10661-005-9006-7.
Chung, H. Y., Hsieh, C. J., Tseng, C. C., & Yiin, L. M. (2016). Association between thefirst occurrence of allergic rhinitis in preschool children and air pollution in Taiwan. International Journal of Environmental Research and Public Health, 13(3), 268.https:// doi.org/10.3390/ijerph13030268.
Dávila, I., et al. (2009). Genetic aspects of allergic rhinitis. Journal of Investigational Allergology and Clinical Immunology, 19(1), 25–31.
Dudek, T., Kasprzyk, I., & Dulska-Jez, A. (2018). Forest as a place for recreation but also the source of allergenic plant pollen: To come or avoid? European Journal of Forest Research, 137(6), 849–862.https://doi.org/10.1007/S10342-018-1144-X. Dykewicz, M. S., & Hamilos, D. L. (2010). Rhinitis and sinusitis. Journal of Allergy and
Clinical Immunology, 125(2), 103–S115.https://doi.org/10.1016/j.jaci.2009.12.989. D’Amato, G., et al. (2016). Climate change and air pollution: Effects on respiratory
al-lergy. Allergy Asthma Immunology Research, 8(5), 391–395.https://doi.org/10.4168/ aair.2016.8.5.391.
Fang, X., Li, R., Kan, H., Bottai, M., Fang, F., & Cao, Y. (2016). Bayesian model averaging method for evaluating associations between air pollution and respiratory mortality: A time-series study. BMJ Open, 6(8), e011487. https://doi.org/10.1136/bmjopen-2016-011487.
Fanizza, C., et al. (2018). Analysis of major pollutants and physicochemical character-istics of PM2.5at an urban site in Rome. Science of the Total Environment, 616–617,
1457–1468.https://doi.org/10.1016/j.scitotenv.2017.10.168.
Financial and Taxation Data Processing and Examination Center. 2020. Income tax da-tabase. Available: https://www.fia.gov.tw/Default.aspx (accessed 18 March 2019). Fuertes, E., et al. (2014). Greenness and allergies: Evidence of differential associations in
two areas in Germany. Journal of Epidemiology and Community Health, 68(8), 787–790.https://doi.org/10.1136/jech-2014-203903.
Fuertes, E., et al. (2016). Residential greenness is differentially associated with childhood allergic rhinitis and aeroallergen sensitization in seven birth cohorts. European Journal of Allergy and Clinical Immunology, 71(10), 1461–1471.https://doi.org/10. 1111/all.12915.
Gascon, et al. (2016). Normalized Difference Vegetation Index (NDVI) as a marker of surrounding greenness in epidemiological studies: The case of Barcelona City. Urban Forestry and Urban Greening, 19, 88–94.https://doi.org/10.1016/j.ufug.2016.07.001. Huang, T. C., Chen, S. H., Guo, C. S., Chang, H. C., & Tsou, C. H. 1998. Airborne pollen
grains and spores in Taiwan. Taipei, Taiwan R.O.C.
Hwang, B. F., Jaakkola, J. J., Lee, Y. L., Lin, Y. C., & Guo, Y. L. (2006). Relation between air pollution and allergic rhinitis in Taiwanese schoolchildren. Respiratory Research, 7(1), 23.https://doi.org/10.1186/1465-9921-7-23.
Horvat, R., Kos, G., &Ševrović, M. (2015). Traffic flow modelling on the road network in the cities. Tehnički vjesnik, 22(2), 475–486. https://doi.org/10.17559/TV-20150127093334.
Ito, K., et al. (2015). The associations between daily spring pollen counts, over-the-counter allergy medication sales, and asthma syndrome emergency department visits in New York City, 2002–2012. Environmental Health, 14, 71.https://doi.org/10. 1186/s12940-015-0057-0.
Kao, C. C., Huang, J. L., Ou, L. S., & See, L. C. (2005). The prevalence, severity and seasonal variations of asthma, rhinitis and eczema in Taiwanese schoolchildren. Pediatric Allergy and Immunology, 16(5), 408–415. https://doi.org/10.1111/j.1399-3038.2005.00268.
Karlsen, S. R., Ramfjord, H., Høgda, K. A., Johansen, B., Danks, F. S., & Brobakk, T. E. (2009). A satellite-based map of onset of birch (Betula)flowering in Norway. Aerobiologia, 25(1), 15–25.https://doi.org/10.1007/s10453-008-9105-3.
Kuna, P., et al. (2016). The role and choice criteria of antihistamines in allergy man-agement– expert opinion. Advances in Dermatology and Allergology, 33(6), 397–410.
https://doi.org/10.5114/pdia.2016.63942.
Lambert, K. A., et al. (2017). Residential greenness and allergic respiratory diseases in children and adolescents– A systematic review and meta-analysis. Environmental Research, 159, 212–221.https://doi.org/10.1016/j.envres.2017.08.002.
Liao, P. F., et al. (2009). Prevalence of childhood allergic diseases in central Taiwan over the past 15 years. Pediatrics and Neonatology. 50(1), 18–25.https://doi.org/10.1016/ S1875-9572(09)60025-5.
Mercer, M. J., et al. (2004). Socioeconomic status and prevalence of allergic rhinitis and atopic eczema symptoms in young adolescents. Pediatric Allergy Immunology, 15(3), 234–241.https://doi.org/10.1111/j.1399-3038.2004.00125.x.
Ministry of Transportation and Communications, R.O.C. Retrieved March 20, 2020 http://www.motc.gov.tw/en/index.jsp.
Nitschke, M., et al. (2016). Lung function reductions associated with motor vehicle density in chronic obstructive pulmonary disease: A cross-sectional study. Respiratory Research, 17, 138.https://doi.org/10.1186/s12931-016-0451-3.
Ouyang, Y., et al. (2017). A model to predict the incidence of allergic rhinitis based on meteorological factors. Scientific Reports, 7, 10006. https://doi.org/10.1038/s41598-017-10721-3.
Payam, D., et al. (2014). Risks and benefits of green spaces for children: A cross-sectional study of associations with sedentary behavior, obesity, asthma, and allergy. Environmental Health Perspectives, 122(12), 1329–1335.https://doi.org/10.1289/ehp. 1308038.
Pawankar, R., et al. (2020). Asia Pacific Association of Allergy Asthma and Clinical Immunology White Paper 2020 on climate change, air pollution, and biodiversity in Asia-Pacific and impact on allergic diseases. Asia Pacific Allergy, 10(1), e11.https:// doi.org/10.5415/apallergy.2020.10.e11.
Porebski, G., Woźniak, M., & Czarnobilska, E. (2014). Residential proximity to major roadways is associated with increased prevalence of allergic respiratory symptoms in children. Annals of Agricultural and Environmental Medicine. 21(4), 760–766.https:// doi.org/10.5604/12321966.1129929.
Prescott, S. L., et al. (1999). Development of allergen-specific T-cell memory in atopic and normal children. The Lancet, 353(9148), 196–200. https://doi.org/10.1016/S0140-6736(98)05104-6.
Ruokolainen, L., et al. (2015). Green areas around homes reduce atopic sensitization in children. European Journal of Allergy and Clinical Immunology, 70, 195–202.https:// doi.org/10.1111/all.12545.
Shakurnia, A., et al. (2013). Prevalence of aeroallergens in allergic patients in Ahvaz. Jundishapur Scientific Medical Journal, 12(1), 587–595.
Skjøth, C. A., Ørby, P. V., Becker, T., Geels, C., Schlünssen, V., Sigsgaard, T., et al. (2013). Identifying urban sources as cause of elevated grass pollen concentrations using GIS and remote sensing. Biogeosciences, 10(1), 541–554. https://doi.org/10.5194/bg-10-541-2013.
Teng, B., et al. (2017). The association between ambient air pollution and allergic rhinitis: further epidemiological evidence from Changchun, Northeastern China. International Journal of Environmental Research and Public Health, 14(3), 226.https://doi.org/10. 3390/ijerph14030226.
Tian, Y., Jim, C. Y., Tao, Y., & Shi, T. (2011). Landscape ecological assessment of green space fragmentation in Hong Kong. Urban Forestry & Urban Greening, 10(2), 79–86.
https://doi.org/10.1016/j.ufug.2010.11.002.
Torfi, Y., Bitarafan, N., & Rajabi, M. (2015). Impact of socioeconomicand environmental factors on atopic eczema and allergic rhinitis: A cross sectional study. EXCLI Journal, 14, 1040–1048.https://doi.org/10.17179/excli2015-519.
Wang, De-Yun (2005). Risk factors of allergic rhinitis: Genetic or environmental? Therapeutics and Clinical Risk Management, 1(2), 115–123.https://doi.org/10.2147/ tcrm.1.2.115.62907.
Wu, C. D., et al. (2017). Land-use regression with long-term satellite-based greenness index and culture-specific sources to model PM2.5spatial-temporal variability.
Environmental Pollution, 224, 148–157.https://doi.org/10.1016/j.envpol.2017.01. 074.
Wu, P. C., Su, H. J., Lung, S. C. C., Chen, M. J., & Lin, W. P. (2019). Pollen of Broussonetia papyrifera: An emerging aeroallergen associated with allergic illness in Taiwan. Science of The Total Environment, 657, 804–810.https://doi.org/10.1016/j.scitotenv. 2018.11.324.
Xu, M., Guo, Y., Zhang, Y., Westerdahl, D., Mo, Y., Liang, F., et al. (2014). Spatiotemporal analysis of particulate air pollution and ischemic heart disease mortality in Beijing, China. Environmental Health: A Global Access Science Source, 13(1), 109.https://doi. org/10.1186/1476-069X-13-109.
Yuzbekov, A. K., & Yuzbekov, M. A. (2015). Effects of industrial pollution on respiratory disease. Moscow University Biological Sciences Bulletin, 70(1), 17–22.https://doi.org/ 10.3103/S0096392515010101.
Zhang, Q., Qiu, Z., Chung, K. F., & Huang, S.-K. (2015). Link between environmental air pollution and allergic asthma: East meets West. Journal of Thoracic Disease, 7(1), 14–22.https://doi.org/10.3978/j.issn.2072-1439.2014.12.07.