i
利用電場調變紅外線吸收光譜研究
N,N-Dimethyl-p-nitroaniline 在混合溶液乙晴和四氯乙
烯中溶質的溶解和乙晴的結構
學生: 王威傑 指導教授:重藤真介 博士
國立交通大學應用化學研究所碩士班
摘要
本論文主要以電場調變紅外線吸收光譜技術和傅立葉轉換紅外線吸收
光譜技術研究 N,N-Dimethyl-p-nitroaniline(DMPNA)於乙腈和四氯乙烯混合
溶劑中溶質的溶解和乙晴的結構。先前的文獻是利用拉曼光譜技術和電場
調變紅外線吸收光譜技術觀測與 DMPNA 結構類似的 p-nitroaniline(PNA)在
乙腈與四氯甲烷混合溶劑中的光譜,結果顯示 PNA 與混合溶劑具有特定的
溶質與溶劑的分佈情形。為了瞭解 PNA 胺基上的氫被雙甲基取代後對溶質
與溶劑分佈情形的影響,我們對 DMPNA 溶液測量乙腈莫耳分率相關性的
傅立葉轉換紅外線吸收光譜和角度
χ 相關性的電場調變紅外線吸收光譜
(
A),在此,角度 χ 是指外加電場的與紅外線光源的電場向量方向的夾角。
在傅立葉轉換紅外線吸收光譜中,DMPNA 的硝基對稱伸縮的波峰隨著乙腈
莫耳分率增加而逐漸朝長波長位移,這個結果指出 DMPNA 並不同於 PNA
分子會與混合溶劑形成特定的結構。而利用特徵值分解法分析角度
χ 相關
ii
性的紅外線吸收光譜(
A)也呈現出 DMPNA 應是以單體的形態存在於溶液
中。更有趣的是,經過改善光譜訊號後,於接近 DMPNA 吸收峰附近能觀
察到乙腈吸收度變化的訊號(甲基的變形吸收峰)。我們以溶質不會在溶液
中形成特定結構的 DMPNA 吸收度訊號變化作為光譜內部的標準去估計乙
腈的偶極矩,並且再加上文獻中單體 DMPNA 偶極矩為 7.0 D,得到乙腈的
偶極矩為 5.7 D,此數值約為單體乙腈(3.4 D)分子偶極矩的 1.7 倍。因此我
們認為兩個乙腈分子最可能以頭對尾相接的線型雙體結構存在於此混合溶
液中。
iii
Infrared Electroabsorption study of
N,N-Dimethyl-p-nitroaniline in Mixed Solvents of
Acetonitrile and Tetrachloroethylene: Solvation of the
Solute and Association Structure of Acetonitrile
Student: Wei-Chieh Wang Advisor: Dr. Shinsuke Shigeto
Department of Applied Chemistry
National Chiao Tung University
Abstract
N,N-Dimethyl-p-nitroaniline (DMPNA) in mixed solvents of acetonitrile (ACN) and
tetrachloroethylene (C2Cl4) was studied with FT-IR spectroscopy and IR electroabsorption
spectroscopy. Previous studies using Raman and IR electroabsorption spectroscopy show that
p-nitroaniline (PNA), an analogue of DMPNA, forms specific solvation structures with ACN
in ACN/CCl4. To examine the effect of N,N-dimethyl substitution on the formation of those
solvation structures, we measured the ACN mole fraction dependence of FT-IR spectra and the angle dependence of IR electroabsorption (A) spectra of DMPNA in ACN/C2Cl4. Here
χ is the angle between an applied electric field and the electric field vector of IR probe light. In the FT-IR spectra, the NO2 symmetric stretch band of DMPNA shows continuous redshift
with increasing ACN mole fraction, indicating that, unlike PNA, DMPNA does not exhibit specific solvated forms in the mixed solvents. Singular value decomposition analysis of the
-dependent A spectra also supports this conclusion. More interestingly, through efforts to
improve the data, we observed a A signal (CH3 symmetric deformation of ACN) in the
vicinity of the DMPNA band. We used the A signal of DMPNA, which has been shown to
form no specific solvation structures, as an internal intensity standard to evaluate the dipole moment of ACN. Using the value of the dipole moment P, of DMPNA in the literature, we
obtained P of ACN as 5.7 D, which is about 1.7 times as large as that of individual ACN
molecules (~3.4 D). Thus a head-to-tail linear dimer in which two ACN molecules align linearly pointing to the same direction is most plausible as the association structure in the mixed solvents.
iv
Acknowledgments
時光飛逝,兩年匆匆過去了。首先我要感謝我的指導教授重藤真介教授,它提供了 我們這個環境並且不會過度的去規定我們的作息和實驗時間。因此在這兩年裡不僅學到 了如何做實驗,並且學到如何去一步一步的完成分配好事情。接著我要感謝日本東京大 學的濱口宏夫教授,它使邀請我們參加 summer school 使我們了解作實驗就應該要開心 的作才有意義,並且時常抽空來台灣給予我們許多建議和指教。 感謝實驗室的成員們,藪本宗士學長總是在我遇到麻煩沒辦法解決的時候不遺餘力 的幫助我,小胖子學長、海曼特學長、蘇打可學長、岡岡學弟、塞塞學弟、辰文學弟、 小阿芳學妹他們時常陪我吃飯聊天在我實驗遇到瓶頸的時候也給予我許多安慰或建議 讓我可以堅持下去更加努力。 最後感謝我的父母,感謝他們提供我經濟上的幫助,讓我可以心無旁騖在交通大學 順利完成學業。v
Tables of Contents
Page Abstract(Chinese) ... i Abstract ... iii Acknowledgments ... iv Tables of Contents... vList of Figures and Tables ... vii
Chapter I Introduction ... 1
Chapter II Theoretical background ... 6
II-1. Introduction ... 7
II-2. Absorbance change (A) spectra ... 7
II-3. Three distinct types of molecular responses ... 7
II-3-1. Orientational polarization ... 8
II-3-2. Electronic polarization... 13
II-3-3. Equilibrium shift ... 14
Chapter III Experimental and Analysis ... 20
III-1. Introduction ... 21
III-2. Experimental setup ... 21
III-2-1 IR electroabsorption spectrometer ... 21
III-2-2. Sample cell ... 23
III-3. Sample preparation ... 26
III-4. Analytical method: Singular value decomposition ... 27
Chapter IV IR Electroabsorption Study of N,N-dimethyl-p-nitroanline (DMPNA) in Mixed Solvents of Acetonitrile (ACN) and C2Cl4: Solvation of DMPNA and Association Structure of ACN ... 35
IV-1. Introduction ... 36
IV-2. Methods and Materials ... 37
IV-3. Results and discussion ... 38
vi
IV-3-2. IR electroabsorption spectra and band assignments ... 39
IV-3-3. dependence of IR electroabsorption spectra ... 40
IV-3-4. On the association structure of ACN in ACN/C2Cl4 ... 40
vii
List of Figures and Tables
Fig. ΙΙ-1. Scheme description of expected value of vibrational transition moment α = 0°. ... 15
Fig. II-2. Scheme description of expected value of vibrational transition moment α = 90°. ... 16
Fig. ΙΙ-3. The scheme of angle χ. ... 17
Fig. ΙΙ-4. (a) Electric field effect on the ground and excited states. (b) An induced peak shift to lower frequency. ... 18
Fig. ΙΙ-5. (a) Electric field effect on the distribution between ground to an excited state. (b)induced change on bandwidth. ... 19
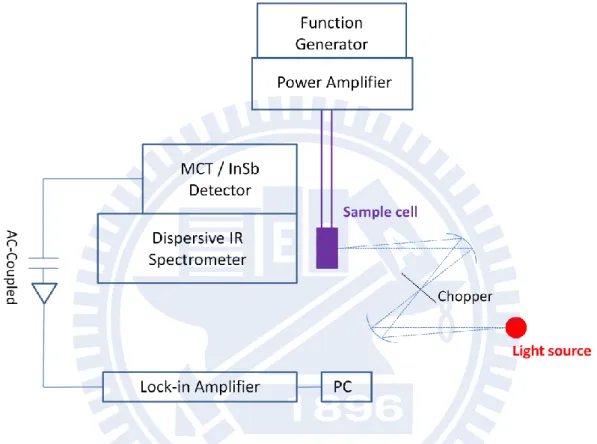
Fig. ΙIΙ-1. Experimental setup of IR electroabsorption spectroscopy. ... 30
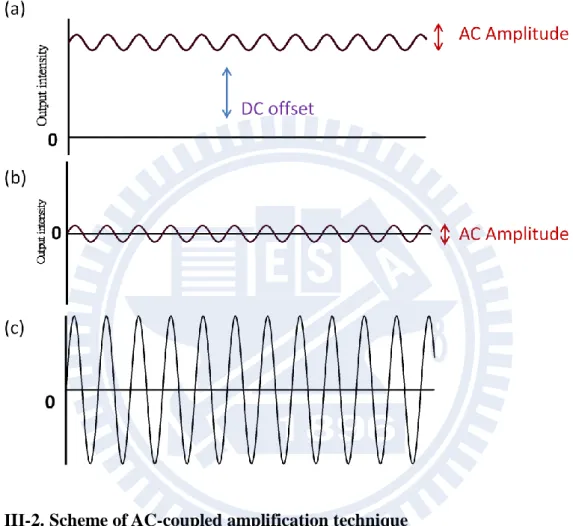
Fig. ΙIΙ-2. Scheme of AC-coupled amplification technique ... 31
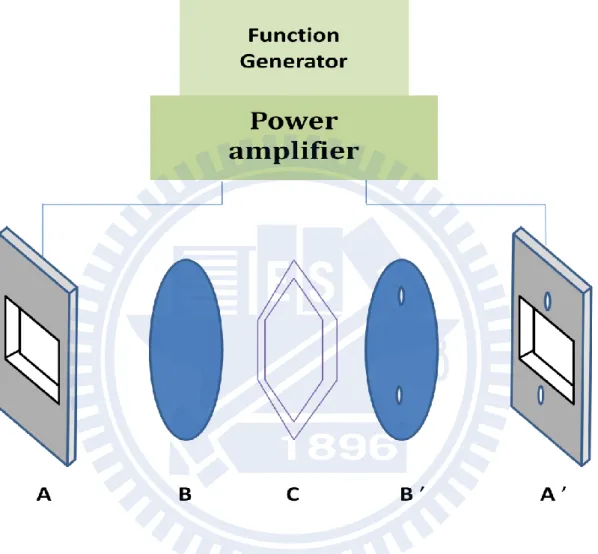
Fig. IΙΙ-3.Configuration of sample cell. ... 32
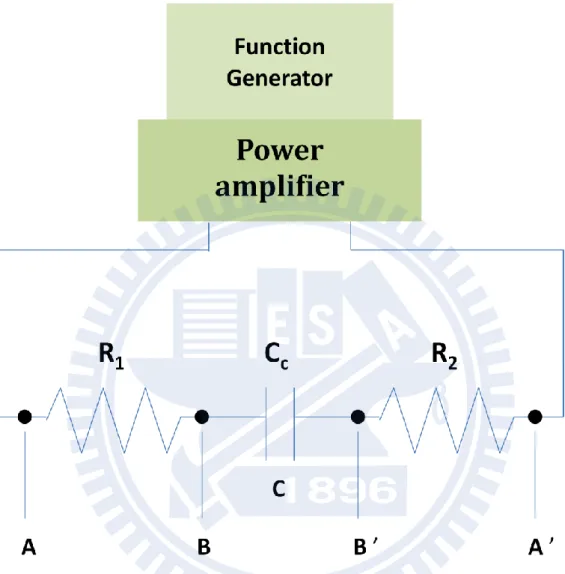
Fig. ΙIΙ-4. A RC circuit equivalent to the sample cell. ... 33
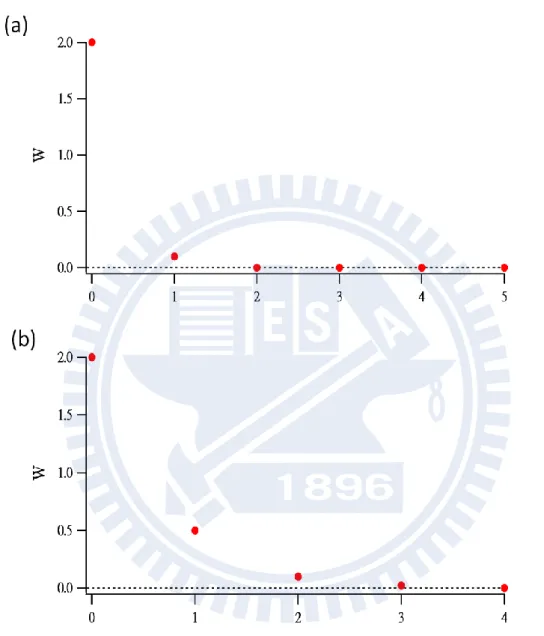
Fig. ΙIΙ-5. Plots of singular values typically obtained in SVD analysis. ... 34
Fig. IV-1. Chemical structure of PNA and structures of the two distinct solvated forms of pNA (the 1:1 and 1:2 species) proposed in previous studies [24, 31] ... 45
Fig. IV-2. ACN mole fraction dependence of FT-IR spectra of DMPNA (a) and PNA (b) in ACN/ C2Cl4. The concentration of DMPNA and PNA was 30 mM. ... 46
Fig. IV-3. Observed IR electroabsorption (a) and absorption (b) spectra of DMPNA in ACN/C2Cl4... 47
Fig. IV-4. (a, b) -dependent A and absorption spectra of DMPNA in ACN/C2Cl4 (xACN = 0.18). (c) Plot of singular values obtained from the SVD of the -dependent A spectra. (d) SVD spectra of components 1, 2, and 3. ... 48
Fig. IV-5. (a) IR absorption spectrum, the same as in Fig. IV-3(b). Also shown is the best fit to a sum of three Gaussian functions representing ACNs(CH3), the combination band of C2Cl4, and DMPNA s(NO2). (b) A spectra of the solution (xACN = 0.18) recorded at = 55º (▲) and 90º (●), and the best fit (solid curve) to a superposition of the zeroth, first, and second derivatives of the absorption bands. ... 49
Fig. IV-6. Decomposition of the A spectrum of DMPNA in ACN/C2Cl4 ((a) 90° (b)55°) into the zeroth, first, and second derivative components ... 50
Fig. IV-7. Possible dimer structures of ACN. (a) An anti-parallel dimer. (b) A head-to-tail linear dimer ... 51
viii
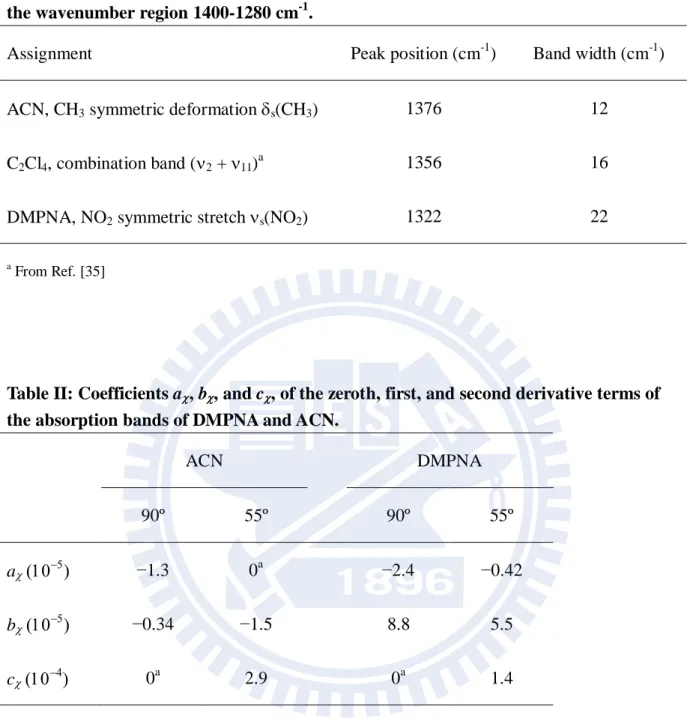
Table I: Assignments, peak positions, and band widths of the three IR bands observed in the wavenumber region 1400-1280 cm-1. ... 44 Table II: Coefficients a, b, and c, of the zeroth, first, and second derivative terms of the
1
Chapter I
2
Fundamental properties of molecules such as dipole moments and polarizabilities are influenced profoundly by electrostatic interaction. Responses to an externally applied electric field are highly sensitive to those molecular properties. Stark spectroscopy is a powerful technique for probing electrostatic interactions of molecules exposed to an external electric field and for obtaining quantitative information on the molecular properties. The Stark effect refers to the effect of an applied electric field on an absorption and emission spectrum. The terms electroabsorption, electro-optic absorption, and electrochromism have also been used in the literature to describe the same phenomenon.
Stark spectroscopy provides unique information on molecular properties in diverse systems ranging from isolated gas-phase molecules to complex biological systems. The Stark effect has been extensively studied in the visible region [1-3]. A series of pioneering work was done by Liptay and co-workers [4]. They demonstrated experimental determination of electric properties of many aromatic molecules in solution [4]. In addition, they developed a theoretical basis of Stark spectroscopy [5], which is now widely used in this field. By working with frozen glasses at liquid N2 temperature, Boxer and co-workers applied Stark
spectroscopy to molecular systems such as donor-acceptor polyenes, transition metal complexes (metal-to-ligand and metal-to-metal mixed valence transitions), and nonphotosynthetic biological systems [2, 6]. They discussed quantitatively the amount of charge transfer based on two characteristic parameters obtained directly from experiment: the change in dipole moment, Δ𝜇, and the change in polarizability, 𝛼, between the ground and excited electronic states. Experimental values of 𝜇 and 𝛼 determined by Stark spectroscopy can also serve as a test for quantum chemical calculations. Ohta and co-workers [1, 7-9] examined the electric-field effects on absorption and fluorescence spectra of polymer films with specific dopant molecules. For instance, they obtained 𝜇 and 𝛼 of two different dopants (2-hydroxyquinoline or 6-hydroxyquinoline) embedded in a polymer film through
3
temperature dependence [9]. In another Stark study [8], they found that the photoirradiation of S3-PPV (sulfide-substituted PPV) in ambient air results in rapid degradation of the polymer film. These parameters and properties are useful when developing and designing novel optical devices.
Because vibrational spectra are sensitive to molecular structures, one can expect that electroabsorption in the mid-infrared region is an excellent tool for studying the Stark effect in relation to structural properties of molecules. To our knowledge, the first vibrational Stark measurement is attributed to Handler and Aspnes [10]. As early as in 1967, they applied IR electroabsoption spectroscopy to study the Stark effect on the O-H stretch mode of 2,6-diisopropyl phenol in CCl4 and obtained the parameters associated with the dipole
moment and the polarizability of the phenol.
Close to 30 years later, in 1995, Chattopadhyay and Boxer [11] reported the use of vibrational Stark spectroscopy to study the electric-field effect on the C≡N stretch mode of anisonitrile in toluene at 77 K. They evaluated Δ𝜇 and Δ𝛼 between the vibrational states involved. The Boxer group extended their research to a series of compounds that contain the CN group [12]. In 2002 [13], they applied the technique to free CO and CO bound to myoglobin (Mb). It is shown that the change in dipole moment for the CO bound to Mb is larger than that for the free CO because of d back-bonding. Extensive studies from the Boxer group have recently been reviewed [3].
These studies have all been performed with frozen glass at 77 K, where orientational motion of molecules is literally frozen or suppressed to a great extent. Under this experimental condition, Stark spectra can be more easily interpreted, because the electronic response via 𝜇 and 𝛼 are the only dominant contribution. However, those spectra lack in the information on the orientational response to an applied electric field, which is very useful for understanding molecular structures and association in liquid/solution.
4
Hiramatsu and Hamaguchi developed an electroabsorption spectrometer in the infrared that was intended for room-temperature measurements [14]. Using a dispersive spectrometer equipped with an AC-coupled amplifier, rather than using the FT-IR method, they were able to detect IR absorbance changes as small as 10-7. Hamaguchi and co-workers used their unique technique to investigate the trans/gauche conformational equilibrium of liquid 1,2-dichloroethane [15], followed by the studies of the self-association of N-methylacetamide in 1,4-dioxane [16], association forms of liquid crystal (5CB) at different temperatures [17], and solvated forms of p-nitroaniline (PNA) in mixed solvents of acetonitrile (ACN) and CCl4
[18]. In 2007, the whole system of the IR electroabsorption spectrometer was transferred and reconstructed at NCTU by Shigeto and co-workers. Using the setup at NCTU, they studied the trans/gauche conformational equilibrium and associated thermodynamic parameters of liquid 1,2-dibromoethane [19]. In present work, the author utilizes the apparatus to investigate the solvation of N,N-dimethy-p-nitroaniline (DMPNA) in ACN/C2Cl4 and association
structures of ACN in the solution.
The rest of this thesis is organized as follows. In Chapter II, the theoretical background of IR electroabsorption spectroscopy is outlined. Major molecular responses to an externally applied electric field that contribute to IR absorbance changes are considered, and their mathematical expressions are derived. Chapter III provides details of our IR electroabsorption spectrometer and a home-made sample cell. Furthermore, analysis using singular value decomposition is also briefly described. In Chapter IV, the author presents an IR electroabsorption study of DMPNA in mixed solvents of ACN and C2Cl4. ACN mole fraction
dependence of FT-IR spectra and angle dependence of electroabsorption (A) spectra of
DMPNA in ACN/C2Cl4 reveal that DMPNA shows no specific solvated forms with ACN, as
opposed to PNA. Here is the angle between the electric vector of IR probe light and the direction of the applied electric field. The author also presents an approach to use DMPNA
5
A signals as an internal intensity standard for evaluating the dipole moment of ACN without
referring to the local field strength. Based on the dipole moment so obtained, we discuss self-association structures of ACN in the solution.
6
Chapter II
7 II-1. Introduction
In this chapter the theoretical background of IR electroabsorption spectroscopy is described in detail. Three distinct molecular responses to an externally applied electric field are considered: orientational polarization, electronic polarization, and equilibrium shift. Mathematical expressions are derived for the IR absorbance changes arising from those responses.
II-2. Absorbance change (A) spectra
When an electric field is externally applied to the sample, changes in absorption intensity are induced. The absorbance change A is calculated from the intensity change
∆𝐼 = 𝐼on − 𝐼off as on off on off 0 0 log log log 1 A A A I I I I I I (II -1)
Here 𝐼0 is the intensity spectrum of the IR probe light. 𝐼on and I (= 𝐼off) represent the intensity spectra of the transmitted IR light through the sample with and without the applied electric field, respectively.
II-3. Three distinct types of molecular responses
We consider three distinct types of molecular responses to an externally applied electric field: orientational polarization, electronic polarization, equilibrium shift [14]. In what follows, we derive expressions for the A spectrum arising from each molecular response and see how
8 II-3-1. Orientational polarization
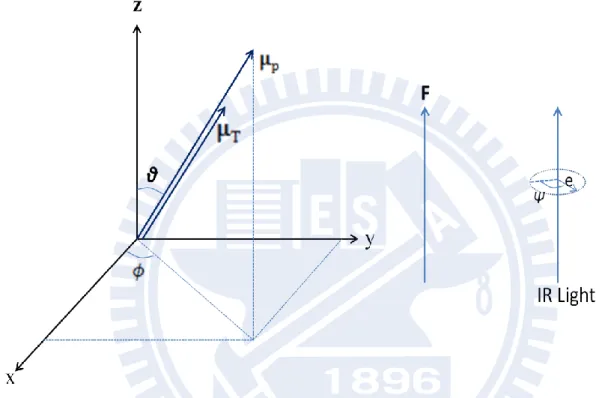
Consider a polar molecule that has a permanent dipole moment 𝜇P. Upon application of an external electric field, the dipole moment aligns along the direction of the electric field, giving rise to orientational anisotropy. This induced polarization can contribute to changes in absorption spectrum.
(1) Normally incident nonpolarized light
To derive the expression for the orientational polarization signal, let us begin by the Beer-Lambert law: 2 2 2 T 0 0 0 1 1 sin d ( ) d d ( ) 2 2 A c c K f
e μ (II-2)where 𝜀 is the molar extinction coefficient, c the concentration of the sample (mol), the path length (cm) of the sample, K a proportionality constant, 𝑣 the wavenumber (cm-1), and e a unit vector designating the direction of the electric field of the incident light. In Figs. II-1 and II-2, we set the molecule-fixed coordinates system such that the x-axis coincides with the direction of the applied electric field and the propagation direction of the IR light. The orientations of the permanent dipole moment μP and the transition moment μT are determined
by the angles θ, 𝜙, and 𝜑. In Eq. II-2 there are two integrands to be evaluated explicitly; one is the spatial distribution function f 𝜃 , and the other is the square of the inner product of the transition moment and the unit vector, (e μ T)2.
The distribution function f 𝜃 is proportional to the probability of finding the dipole moment 𝝁P in the direction 𝜃 with respect to the applied electric field F. Using the coordinate system shown in Figs.II-1 and II-2, we have
9 p p sin cos sin sin , cos θ μ θ θ μ , 1 0 0 F F cos sin 0 e (II-3)
The number of molecules that have energy E is proportional to exp −𝑘𝐸
𝐵𝑇 , with E being the
dipolar interaction energy
T
P P P
sin cos 0
sin sin 0 cos
cos 1 θ E μ θ F μ F θ μ F (II-4)
Thus the distribution function f 𝜃 becomes
p B
cos
( ) C exp μ F C exp( cos ) f k T (II-5) with p B μ F k T . (II-6)
Here C is a normalization factor, T is the temperature, and 𝑘𝐵 is the Boltzmann constant, and
F is the electric field strength. Note that the electric field F in Eq. II-6 is not the external field
but local field which is exerted on individual molecules. The parameter 𝛾 reflects the magnitude of the electrostatic interaction and is a key quantity in evaluating μP. The factor C
is determined by the normalization condition 2 ( )s i n 1
0 0
f dd (II-7) In the presence of the electric field (F0), f()becomes from Eqs. II-5 and II-7on( ) 1 exp( cos ) 2 exp( ) exp( ) f (II-8)
10 Eq. II-8 4 1 ) ( o f f f (II-9)
The scalar product of 𝝁T and e can be calculated as follows. The electric field vector e, of the incident light lies in the xy-plane, and a projection of 𝝁T onto the xy-plane is related to
2 T
(μ e . 𝝁 ) T is expressed as
T T
cos cos cos sin sin sin sin cos sin cos sin cos cos sin cos sin sin sin sin cos sin cos sin cos cos
μ μ (II-10)
If 𝛍P is parallel to 𝛍T, i.e., α=0º as shown in Fig. II-1, Eq. II-10 is reduced to T T sin cos sin sin cos θ φ μ θ φ θ μ (II-11)
Using Eqs. II-3 and II-11, (e μ T)2 is obtained as
2 2 2 T T 1 ( ) sin 2μ θ e μ (II-12) Here we replace cos2𝜓, sin2𝜓, and cos 𝜓 sin 𝜓 by their mean values (1/2, 1/2, and 1, respectively). In the absence of the external electric field, the absorbance 𝐴off for an α= 0° vibrational mode is calculated from Eqs. II-2, II-9, II-12 as
2 2 off off T 0 0 2 2 3 T 0 0 2 T ( ) sin 1 1 sin d 4 2 1 3 A f d d d
e μ (II-13)Similarly, substitution of Eqs II-8 and II-12 into Eq. II-2 results in the absorbance for the α= 0º mode when the electric field is turned on
11 2 2 on on T 0 0 2 T 2 3 ( ) sin 1 2 2 (e e ) (e e ) 2 (e e ) A f d d
e μ (II-14)By expanding the exponential functions and retaining terms up to third-order in γ, we have on 2 T2 6 2 A (II-15)
To confirm that this approximation is valid, suppose 50 V is applied across liquid acetone 5 μm thick. The electric field strength 𝐹 = 1 × 10⁷ V m−1. For simplicity, we do not consider
the local field correction. Using the dipole moment of acetone, μP = 2.7 D (1 D = 3.33564 ×
10-30 C m), we obtain = 0.02, for which << 1 holds.
The absorbance change caused by the applied electric field is the difference between 𝐴on (Eq. II-15) and 𝐴off (Eq. II-13). The absorbance change ratio is thus
o n o f f 2 o f f o f f 2 6 A A A A A (II-16)
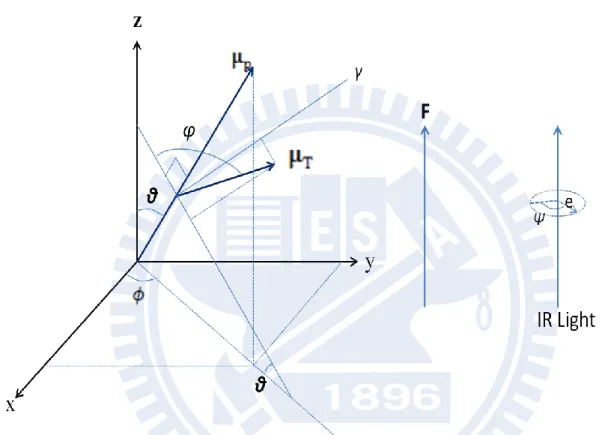
Next we consider the α= 90º case where 𝝁T is perpendicular to 𝝁P (Fig. II-2). Equation II-10 reduces to
T T
cos cos cos sin sin sin cos cos sin cos cos sin μ μ (II-17) and 𝝁T∙ 𝒆 2 yields 2 2 2 T T 1 ( ) (cos 1) 4μ θ μ e (II-18) Making use of Eqs. II-2, II-8, II-9, and II-18, we end up with the absorbance change ratio of the form 6) 2( 2 2 off A A (II-19)
Generalization of Eqs. II-16 and II-19 to an arbitrary angle α is straightforward. The absorbance change for angle can be decomposed into its parallel (𝛼 = 0°) and
12 perpendicular (α= 90°) components as follows:
2 2 T T 0 90 cos sin A A A μ μ A A (II-20)
Substitution of Eqs. II-16 and II-19 into Eq. II-20 yields the following expression for the orientational polarization signal probed with the normal incidence
A A 1 3cos 6) 2( 2 2 2 (II-21) Again γ2 ≪ 6 in the present study, so the first term in the denominator of the right-hand side of Eq. II-21 is safely neglected. Therefore we are left with
2 2 1 3 cos 12 A A (II-22)(2) p-Polarized light with tilted incidence
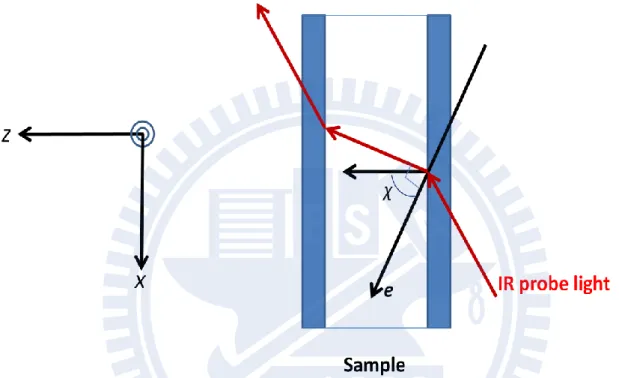
So far we considered the case where the electric field vector of the incident, nonpolarized light on the xy-plane is parallel to the sample cell. In other words, is equal to 90°, where is the angle between the applied electric field F and the electric field vector e of the incoming IR light (see Fig. II-3) When p-polarized light whose electric field vector e has only x-component is incident upon the sample with the angle , the absorbance change ratio is shown to be given by [14]
2 , 1 2 2 1 3 cos 1 3 cos 12 p B F A A k T , (II-23)It follows from Eq. II-23 that the orientational polarization signal disappears at χ= cos−1 1 3 = 54.7° . Furthermore the orientational polarization A spectrum is
proportional to the absorption spectrum A, so that it appears as its zeroth derivative. An important application of Eq. II-23 is experimental determination of the dipole moment μP with
13 II-3-2. Electronic polarization
Absorbance changes also arise from electronic polarization, which is the change by an externally applied field in molecule’s electronic properties such as the dipole moment and the polarizability. A general theory of the electronic polarization signal was established by Liptay and co-workers [4-5]. For a molecule in solution, the electronic polarization spectrum ∆𝐴 𝑣 is modeled by the following formula [20-21]
2
2
2 2 d d 15 d 30 d B A C A A F A A h h (II-24)where h is Planck’s constant. 𝐴 𝑣 comprises the zeroth, first, and second derivatives of the absorption band 𝐴 𝑣 . The coefficients 𝐴χ, 𝐵χ, and 𝐶χ are given by
2 g 2 2 gm g 2 2 B B 1 1 ˆ 3 cos 1 3m 1 30 10 3 A k T k T (II-25)
g B 2 2 g m 5 5 Tr 2 1 ˆ 3 1 3 cos 1 3m 1 Tr 2 2 B k T kT μ μ α μ μ α α (II-26) C μ25
3 cos21 3m
ˆ21
(II-27) Here 𝝁 and 𝜶 denote the changes in permanent dipole moment and polarizability tensor between the vibrational ground state (g) and an excited state (e), respectively, i.e., 𝝁 = 𝝁e− 𝝁g and 𝜶 = 𝜶e − 𝜶g. m is a unit vector in the direction of the transition dipole moment. αgm and αm are the components of the ground-state polarizability and the polarizability change along the direction of the transition dipole moment, i.e., 𝛼gm= m ∙ 𝜶g ∙ m and𝛼m = m ∙ ∆𝜶 ∙ m . The changes in dipole moment and polarizability upon vibrational excitation are in general very small, because the vibrational states involved belong to the same electronic state. So the electronic polarization signal in IR electroabsorption is usually small
14 too.
The zeroth-derivative component represents the intensity change of the absorption spectrum. Note that the first term in the square brackets in Eq. II-25 corresponds to the orientational polarization contribution, which we already derived above. The first-derivative component depends on both 𝝁 and 𝜶, and is responsible for the peak shift, as illustrated in Fig. II-4. The second-derivative component, which is characterized solely by 𝝁, shows the
change in the bandwidth of the absorption spectrum (see Fig. II-5)
II-3-3. Equilibrium shift
The shift of a chemical equilibrium caused by an external electric field can also contribute to the A signal. If the electrostatic interaction differs among molecular species
coexisting in the equilibrium, the equilibrium would shift towards more stable species. Take 1,2-dicholoroethane [15] as an example for better understanding the A signal induced by the
equilibrium shift. In 1,2-dicholoroethane, the trans and gauche conformers coexist in equilibrium. The trans conformer is nonpolar, while the gauche is polar. When an electric field is applied to the liquid, the gauche conformer gets stabilized via the electrostatic (dipolar) interaction. On the other hand, the nonpolar trans conformer is not affected by the electric field. As a result, the equilibrium shifts towards the gauche conformer. Thus IR absorption of the gauche conformer is expected to increase, while that of the trans conformer should decrease. Since this equilibrium shift A signal is a change in absorption intensity, it has the
same shape as the absorption spectrum and hence contributes to the zeroth-derivative component as is the orientational polarization signal. The equilibrium shift signal does not depend on the angle , so it is possible to differentiate between the orientational polarization and equilibrium shift contributions to the A spectrum by studying angle dependence of the
15
Figure ΙΙ-1. Coordinate system used in derivation of the orientational polarization signal. α is the angle between μP and μT. This figure corresponds to the α = 0° case where μP is
16
Figure II-2. Coordinate system used in derivation of the orientational polarization signal. This figure corresponds to the α = 90° case where μP is perpendicular to μT.
17
Figure ΙΙ-3. Angle χ between the applied electric field F and the electric field vector e of the incoming IR probe light.
18
Figure ΙΙ-4. (a) Electric field effect in the vibrational ground and excited states. (b) An absorption peak shifts to lower frequency (Δα>0), and the ΔA spectrum exhibits a first-derivative line shape (not to scale).
19
Figure ΙΙ-5. (a) Electric field effect on the distribution of the transition frequency from the vibrational ground to an excited state. (b) The difference in the absorption spectrum shows a second-derivative line shape (not to scale).
20
Chapter III
21 III-1. Introduction
The measurement system used in the present study was originally developed by Hiramatsu and Hamaguchi [14] and subsequently reconstructed at NCTU by us. In this chapter, the principle of IR electroabsorption spectroscopy and our experimental setup are described, followed by the details of our home-built sample cell. It is highlighted that owning to an AC-coupled amplification technique the detection limit of absorbance change has been lowered to ~10-7. Next sample preparation for IR electroabsorption and FT-IR measurements are described. Finally analysis using singular value decomposition (SVD) is presented with some mathematical accounts.
III-2. Experimental setup
III-2-1 IR electroabsorption spectrometer
The experimental setup for IR electroabsorption spectroscopy is described in this section. A schematic of the experimental setup is shown in Fig. III-1. The system consists of a light source, a home-made sample cell, an optical chopper (Stanford Research System Inc. SR540), a dispersive IR monochromator, a photoconductive HgCdTe (MCT) detector (New England Research Center, MPP12-2-J3), an AC-coupled amplifier, and a lock-in amplifier (Stanford Research System Inc. SR844). The probe light source which we used to illuminate the sample was a ceramic mid-IR emitter. As shown in Fig. III-1, the optical chopper and the sample cell were set at the co-focus of two ellipsoidal mirrors and at the other focus of the second ellipsoidal mirror, respectively. A chopper blade with 6 windows generated a modulation of 240 Hz to the probe light source. A function generator (IWATSU, FG-330) produced a 25 kHz sinusoidal wave and, after amplified by a power amplifier, it was applied across the sample of about 6 m thick. By combining the dispersive IR monochromator and the AC-coupled technique, the sensitivity to absorbance changes induced by electric field
22
modulation reaches as small as 1 × 10⁻⁷, which is better than or at least comparable to that achieved by the latest FT-IR method.
The AC-coupled technique is briefly outlined. It is a powerful technique to detect a small AC component lying on top of a large DC offset. In the present case the intensity of the transmitted IR probe light corresponds to the DC offset and an intensity change due to electric field modulation to the AC component [Fig. III-2(a)]. The amplitude of the AC component is typically three or even higher orders magnitude smaller than that of the DC offset. In order to detect such small AC amplitude, we used a low-noise preamplifier to remove the DC offset and amplified the AC component only [Fig. III-2(b)]. Then the output of the preamplifier was amplified once again by the main amplifier (Stanford Research System Inc. SR560, gain;1 × 50000 variable) and fed to the lock-in amplifier. In this way, only the intensity change due to electric field modulation can be detected with a wide dynamic range [Fig. III-2(c)].
In the experiment, we first measure the intensity spectrum of IR probe light without the sample (I0) and subsequently, that with the sample but without electric field modulation (I). I0
and I are obtained using a digital sampling oscilloscope (LeCroy, LC334-DSO) and the mechanical chopper operating at about 240 Hz. Then the absorbance can be calculated from I0
and I as follows
∆𝐴 = −log 𝐼 𝐼0
Next, we perform an electroabsorption measurement, where an AC-coupled detection technique combined with a lock-in amplifier is employed to detect the intensity difference spectrum, 𝐼, recorded with and without the applied electric field. The absorbance change (spectrum is computed using Eq. II-1. In the following chapters, we will present our data in the format of 𝐴 spectra.
23 III-2-2. Sample cell
The configuration of our sample cell is schematically shown in Fig. III-3. The sample cell consists of two brass cell holder (A/A’ ), two Si wafers (B/B’ ) and a polyethylene telephthalate (PET) thin film (C) as a spacer. The Si wafers used were p-type boron doped Si plates (resistivity = 0.8–2 Ω cm), so they also serve as electrodes. Because one side of the Si window was coated by a SiO2 layer (thickness = 0.3 μm, resistivity >1010 Ω cm), the
electrodes were electrically insulated from the sample. The resulting transmission of the Si wafers is about 60% in the mid-IR region. The thickness of the PET film must be thin enough to avoid using high voltages, and a 6 μm film was our choice of the spacer. Between A’ and B’, we put chemically durable perfluoroelastmer O-rings (As568A-008) to prevent a liquid sample from leaking out of the flow system during measurement. Flowing the sample was required in order to avoid sample evaporation.
Accurate estimation of the cell gap and the applied voltage is essential for calculating the external electric-field strength. We can estimate the actual cell gap from an interference fringe pattern that appears in the absorption spectrum of a vacant cell. The peak positions of two adjacent peaks of an interference fringe pattern, ω1 and ω2 (cm-1), are related to the cell
gap a (μm) as 2𝑛ω1𝑎 =10 4 ω1 × 2m−1 2 (III-1) 2𝑛ω2𝑎 =10 4 ω2 × 2m+1 2 (III-2)
where 𝑛𝜔1 and 𝑛𝜔2 are refractive indices at wavenumbers (cm-1) ω1 and ω2, respectively,
and m is an integer. Assuming 𝑛𝜔1 = 𝑛𝜔2, the cell gap a is obtained as
𝑎 =12× 10
4
24
In order to suppress unwanted work at the cell caused by non-zero resistance between A-A’ (VAA’) and B-B’ (VBB’), we should decrease the contact resistance between them as small
as possible. We scratched the surface of the Si plate at two points with a distance of ~2 cm to physically remove the naturally coated SiO2 layer. On those points was pasted indium gallium
alloy (Ga 40%), making electric contacts with the brass cell holder. The resistance between the two points was nominally smaller than ~20 Ω. It depends upon doping properties of the Si plates. A large resistance may give rise to a decrease in amplitude of the applied voltage and phase retardation with respect to the applied sinusoidal wave. The latter may result in nonzero out-of-phase ΔA signals. This phenomenon has been explained by regarding the sample cell as forming an RC circuit [14]. Fig. III-4 shows an RC circuit equivalent to the sample cell. R1
and R2 are the resistances between A and B and between A’ and B’, respectively, and Cc is the
capacitance between the electrodes. The exact voltage across the sample (VBB’) is related to
the applied voltage (VAA’) as [14]
𝑉BB ’ = 𝑉AA ’ 1 1+ ωRCC 2 1 1+ ωRCC 2+ і ωRCC 1+ ωRCC 2 (III-4)
where R=R1+R2, і is the imaginary unit, ω is the frequency of the electric field which we
apply. The amplitude and the phase retardation are thus given by
Amplitude = 𝑉𝐴𝐴 ’
1+ 2πfR CC 2 (III-5)
Retardation = φ = arc tan 2π𝑓𝑅𝐶𝐶 (III-6)
respectively. The capacitance CC changes depending on the concentration and the dielectric
constant of the sample. In this study, acetonitrile CH3CN and tetrachloroethylene C2Cl4 are
used as solvents. Because the dielectric constant of acetonitrile is fairly large (𝜀𝑟 = 35.8 at
room temperature [22]), compared with other solvents commonly used in the laboratory, the capacitance Cc rather than the resistance R is considered to be the main cause of the above
25 problem.
The magnitude of an externally applied electric field, Eext, can be calculated from the
applied voltage and the cell gap. However Eext is not the exact field magnitude that acts on
molecules in the sample. It is the local field F that is actually exerted on the molecules [14]. So we need to consider the relation between local and external electric fields. The local electric field Elocal is related to the external field as
𝐸𝑙𝑜𝑐𝑎𝑙 = 𝑓′∙ 𝑓′′𝐸𝑒𝑥𝑡 (III-7) Here the factor 𝑓′ is given by
𝑓′ = 1 1+ 𝜔𝑅 𝐶𝐶 2 1 1+ 𝜔𝑅 𝐶𝐶 2+ і 𝜔𝑅 𝐶𝐶 1+ 𝜔𝑅 𝐶𝐶 2 (III-8)
which accounts for the effect of the RC circuit that the sample cell may form, and f ’’ is the local-field correction. It is often very difficult to evaluate the factors f’ and f ’’ accurately, though they are of great significance in obtaining molecular properties, such as the dipole moment and polarizability, from ΔA signals. According to the Onsager theory, for instance, the local field correction is given by
𝑓′′ =2ε+13ε (III-9) where ε is the dielectric constant of the medium. By definition ε takes on values from unity to infinity, resulting in the value of f ’’ ranging from 1.0 to 1.5. However this theory is based on a simple model of intermolecular interactions and liquid structures, and there are many limitations to broad applications. Thus values of molecular properties are often quoted in the unit of f ’’ [23-24].
As will be described in Chapter IV, a more reliable alternative is to circumvent the direct use of the electric field strength. If there is an internal intensity standard of
26
electroabsorption signals that is associated with a known molecular property, comparison of electroabsorption signal intensities allows us to determine those properties quantitatively without referring to the electric field strength.
III-3. Sample preparation
The solutes we used were N,N-Dimethyl-p-nitroaniline (DMPNA) and p-nitroaniline (PNA). We dissolved DMPNA or PNA in binary mixtures of acetonitrile (ACN) and tetrachloroethylene (C2Cl4) with different mole fractions and measured FT-IR, and IR
electroabsorption spectra of those solutions. The concentration of DMPNA/PNA was 30mM for FT-IR and IR electroabsorption measurements.
The preparation procedure is summarized as follows:
1. Mix certain volumes of ACN and C2Cl4 in a 50ml flask to prepare binary mixtures with 10,
12.5, 15, 17.5, 20, 22.5, 25, 30, 35, and 40 volume % of ACN. These volume % corresponds to ACN mole fractions xACN = 0.18, 0.22, 0.26, 0.29, 0.33, 0.36, 0.39, 0.46,
0.51, and 0.57.
2. Weigh 0.1246g of DMPNA/PNA and add it to a 25ml volumetric flask
3. Fill the volumetric flask with the mixed solvent prepared in step 1 and dissolve the solute by stirring. When dilution of the solution is required, take 1 ml of the solution by a micropipette and add it to a 10ml volumetric flask.
4. Fill the volumetric flask with the mixed solvent to achieve the dilution needed.
FT-IR spectra were measured with JASCO FT-IR-6100. CaF2 windows were used in
27
III-4. Analytical method: Singular value decomposition
Singular value decomposition (SVD) is an important factorization method of a complex matrix. This technique can be employed in principal component analysis (PCA); thus it has found many applications in chemometrics and spectral analysis.
SVD is a mathematical method that decomposes an arbitrary (complex) matrix A (m × n, m > 𝑛) into the product of three matrices U, W, and T as
𝐴 = 𝑈𝑊𝑇t (III-10) where U is a column-orthogonal matrix (m × n) W a diagonal matrix (n × n), and T a orthogonal matrix (n × n). The diagonal elements of the matrix W are called singular values.
Equation III-10 can be written explicitly in terms of matrix elements:
A11 ⋯ ⋮ ⋯ Am1 ⋯ ⋯ A1n ⋯ ⋮ ⋯ Amn = U11 ⋯ ⋮ ⋯ Um1 ⋯ ⋯ U1n ⋯ ⋮ ⋯ Umn W1 0 0 0 ⋱ 0 0 0 Wn T11 ⋯ T1n ⋮ ⋱ ⋮ Tn1 ⋯ Tnn (III-11) The column vector (U1k⋯ Umk) is denoted uk (k = 1 ⋯ , n), the row vector (Tk1⋯ Tkn) denoted tk (k = 1 ⋯ , n). Equation III-11 is then simplified to
𝐴 = u1 ⋯ un W1 0 0 0 ⋱ 0 0 0 Wn t1 ⋮ tn (III-12) Supposed that the matrix A represents a set of time-resolved spectra with rows corresponding to spectra observed at specific times. In this case, uk represents a time dependence while tk correspond to the intrinsic spectrum for the kth component.
Contributions of the kth component to the overall matrix A are determined by the singular value Wk: the larger Wk is, the more significantly the kth component contributes. The
usefulness of SVD stems from the fact that components accompanying small singular values can be neglected.
28
How does SVD analysis work? Here let us consider the following two cases typically encountered in spectral analysis using SVD: (1) SVD yields only one or two major singular values [see Fig. III-5(a)]. (2) SVD yields several non-negligible singular values [Fig. III-5(b)]. In case 1 [Fig. III-5(a)], the presence of the two major singular values indicates that, in principle, two and only two molecular species are responsible for the original data set (matrix
A). Such a case can be found, for example, when performing the SVD of a series of
absorption spectra at different sample concentrations in which an absorption band increases and concomitantly another band decreases as a function of concentration. We are able to disregard all the other singular values and to focus on the behavior of the two components. In mathematical terms, this simplification is expressed as
𝐴 ≈ u1 u2 W01 W0 2
t1
t2 (III-13) Now that we are left with much reduced number of components, we can proceed with assigning physical meaning to the surviving components. It should be noted that SVD is a purely mathematical operation and hence there is no physical meanings in vectors u and t as they are. Those vectors need to be reconstructed by taking linear combinations of u and t. At this stage, physics (or chemistry) behind the observed phenomenon comes into play. In order to obtain physically meaningful vectors 𝐮′ and 𝐭′, we assume model functions that either u or t is expected to obey. By way of example, in an SVD analysis of -dependent IR electroabsorption spectra [18], -dependences of the components have been assumed to be 1 − 3cos2
and constant with respect to . Mathematically this reconstruction corresponds to inserting the product of a transformation matrix K and its inverse 𝐾−1 between matrices U and W. The matrix elements of K are determined by least-squares fitting to the model functions. 𝐴 ≈ u1 u2 K−1K W01 W0 2 t1 t2 = u1 ′ u 2 ′ t1′ t2′ (III-14)
29 u1′ u2′ = u1 u2 K−1 , t1 ′ t2′ = K W01 W0 2 t1 t2 (III-15) In case 2, there are many (typically more than three) singular values with non-negligible magnitudes, as shown in Fig. III-5(b). Such a plot is characteristic of the data in which one component undergoes continuous shift as a function of a variable such as concentration or time. If an absorption band continuously shifts from red to blue or vice versa with concentration, a plot of the singular values so obtained is known to resemble Fig. III-5(b). In comparison with case 1, SVD analysis is silent in this case. However it does provide important information on whether the observed data arise from a few components in equilibrium or a single, continuously changing component.
30
31
32
Figure ΙIΙ-3.Configuration of our sample cell A/A’ are brass cell holders, B/B’ are Si plates, and C is a PET film as a spacer.
33
Figure ΙIΙ-4. RC circuit equivalent to the sample cell (Fig. ΙΙΙ-3.). R1 is the resistance
between A and B, R2 is that between A’ and B’, and Cc is the capacitance of the capacitor
34
Figure ΙIΙ-5. Plots of singular values typically obtained in singular value decomposition analysis.
35
Chapter IV
IR Electroabsorption Study of
N,N-dimethyl-p-nitroanline (DMPNA) in Mixed
Solvents of Acetonitrile (ACN) and C
2
Cl
4
:
Solvation of DMPNA and Association Structure of
36 IV-1. Introduction
Solvation is one of the most fundamental phenomena that take place in solution phase [25-26]. It is an interaction of a solute molecule with surrounding solvent molecule(s), which leads to stabilization of the solute molecule in the solution. In a variety of solution-phase chemical reactions, solvation plays an important role in determining the direction and rate of the reactions and in changing the energies of excited as well as the ground state.
p-nitroaniline (PNA) is one of the simplest molecules that have electron donor and
acceptor moieties connected via an aromatic ring. It exhibits pronounced solvatochromism [27-28] and large nonlinear optical properties [29-30]. These and other photochemical features of PNA have long been the subject of various investigations. In previous studies, PNA in acetonitrile (ACN)/CCl4 mixed solvents was studied with UV/Vis absorption
spectroscopy and Raman spectroscopy [31] and with IR electroabsorption spectroscopy [18]. As already demonstrated [14, 16, 18], IR electroabsorption spectroscopy is a powerful technique for experimental determination of the structure of solvated forms. It is shown from these studies that PNA occurs as two distinct solvated forms, that is, the 1:1 species (PNA associated with one ACN molecule on the amino group, Fig. IV-1) and the 1:2 species (PNA associated with one ACN molecule on the amino group and one on the nitro group, Fig. IV-1).
In the present study, we apply IR electroabsorption spectroscopy to study
N,N-dimethyl-p-nitroaniline (DMPNA) [32-33] in mixed solvents of ACN and C2Cl4. Our
original goal was to understand the effect of N,N-dimethyl substitution on forming solvated structures by comparing the results on DMPNA and PNA. In case of PNA, solvation by ACN occurs on the amino group first (the 1:1 species), and then the attachement of another ACN to the nitro group is induced (the 1:2 species) [31]. Methyl substitution of the hydrogen atoms in the amino group would hinder interaction between DMPNA and ACN on the amino group, resulting in the absence of the 1:1 species. Since the formation of the 1:2 species occurs
37
through the 1:1 species, there would also be no 1:2 species. If this scenario is the case, DMPNA will show no specific solvated forms with ACN. To test our hypothesis, we measure the ACN mole fraction dependence of FT-IR spectra and the IR electroabsorption spectrum of DMPNA in ACN/C2Cl4. We find that, as expected, DMPNA forms no specific solvation
structures with ACN in the mixed solvents.
In the course of our efforts to obtain decent A spectra of DMPNA, we noticed that the
band at 1378 cm-1 assigned to ACN was observed in addition to the DMPNA band. In our independent work, we investigated the electric field effect on the C≡N stretch mode (~2250 cm-1) of ACN in the pure solvent, but so far never succeeded in observing the A signal. The
fact thatA signals were not observed for the C≡N stretch mode could imply that the dipole
moment of ACN is in effect zero or decreased due to the formation of association structures such as anti-parallel dimers. However, since the C≡N stretch band of ACN is nearly isolated from other IR bands, we were unable to conclude whether the absence of the A signal for the
C≡N stretch mode is a consequence of molecular association or simply due to failure in experiment. The latter possibility can be ruled out in the present case, because the clearly observed DMPNA band ascertains that the measurement was done appropriately. We use the DMPNA A signal as an internal intensity standard to estimate the effective dipole moment of
ACN in the solution and discuss the result in relation to possible self-association structures of ACN.
IV-2. Methods and Materials
The experimental apparatus and the sample cell for IR electroabsorption spectroscopy used in this study have already been described in Chapter III. In measuring the angle dependence of A spectra, we used a wire-grid mid-IR polarizer to obtain p-polarized light.
Seven runs were averaged for each A spectrum, which required about 2 h. During
38
heat accumulation and solvent evaporation. The molar concentration of DMPNA was 30 mM, and the ACN mole fraction in the mixed solvent was 0.18. FT-IR spectra were recorded on a JASCO FT/IR-6100 spectrometer using a sample cell composed of two CaF2 windows and a
lead spacer (50 μm thick). Resolution of 1 cm-1 was used.
ACN (HPLC-grade ≥99.9%) was commercially obtained from J.T Baker; DMPNA (≥98% ) from Alfa-Aesar; C2Cl4 (HPLC-grade ≥ 99.9%) and PNA ( ≥ 99%) from
Sigma-Aldrich. Those chemicals were used as received. All the experiments were done at room temperature (298 K). We used C2Cl4 instead of CCl4 because of health and
environmental safety reasons. Both solvents are nonpolar, have similar molecular weights (C2Cl4, 165.8 vs. CCl4, 153.8), densities (1.62 vs. 1.58 g/cm3), and dielectric constants (2.3 vs.
2.2); thus we assume that the use of C2Cl4 in place of CCl4 will cause no significant
differences on the solution properties. IV-3. Results and discussion
IV-3-1. ACN mole fraction dependence of FT-IR spectra
Figure IV-2 shows the ACN mole fraction (xACN) dependence of FT-IR spectra of
DMPNA and of PNA in ACN/C2Cl4 in the 1360-1270 cm-1 region for 10 different mole
fractions. The mixed solvents studied contained 10, 12.5, 15, 17.5, 20, 22.5, 25, 30, 35, and 40 volume % of ACN, which correspond to mole fractions 0.18, 0.22, 0.26, 0.29, 0.33, 0.36, 0.39, 0.46, 0.51, and 0.57. The IR band observed in Fig. IV-2 is assigned to the NO2 symmetric
stretch s(NO2) of DMPNA or PNA. The s(NO2) band of DMPNA appears to be a single,
relatively broad band [Fig. IV-2(a)], while that of PNA shows a doublet [Fig. IV-2(b)]. The previous study [31] revealed that the doublet originates from a superposition of the IR bands of the free PNA, the 1:1 species, and the 1:2 species. The spectral change of the DMPNA
39
increases, the DMPNA s(NO2) band appears to undergo continuous redshift with the peak
position changing from 1320 to 1314 cm-1 [Fig. IV-2(a)]. In contrast, for PNA, the higher-wavenumber band intensity decreases with slight redshift and concomitantly the lower-wavenumber band intensity increases as xACN becomes larger. Comparison of the xACN
dependences of DMPNA and PNA suggests that the DMPNA s(NO2) band does consist of a
single component that shows solvatochromism upon changing xACN and that there exists only
free DMPNA in ACN/C2Cl4. The fact that the s(NO2) band is well fit to a single Gaussian
function (see below) supports this picture. Additional support is provided by a recent work done by Fujisawa and co-workers [34], in which they investigated excitation wavelength dependence of the Raman spectrum of DMPNA and reached a similar conclusion.
IV-3-2. IR electroabsorption spectra and band assignments
The IR absorption and electroabsorption (A) spectra of DMPNA in ACN/C2Cl4 are
shown in Fig. IV-3 for the wavenumber region 1400-1280 cm-1. The absorption spectrum was measured with a 50 m path-length cell to yield a better signal-to-noise ratio. The A
spectrum was measured with normal incidence of the IR probe light. In the absorption spectrum [Fig. IV-3(b)], three IR bands are observed at 1376, 1356, and 1321 cm-1. The 1376 cm-1 band is assigned to the CH3 symmetric deformation s(CH3) of ACN and the 1356 cm-1
band to the combination band 2 +11 of C2Cl4 [35]. As discussed above, the 1321 cm-1 is
assigned to s(NO2) of DMPNA. In the ΔA spectrum [Fig. IV-3(a)], negative features are
observed at 1376 and 1321 cm-1, unequivocally corresponding to the ACN and DMPNA vibrations, respectively. Note that the C2Cl4 band has no noticeable features in the A
spectrum. This observation is consistent with the fact that orientational polarization signals, a major contribution to room-temperature A spectra in general, are not observed for nonpolar C2Cl4.
40
IV-3-3. dependence of IR electroabsorption spectra
Figure IV-4(a) and (b) show -dependent A spectra and the stationary IR spectrum of
DMPNA in ACN/C2Cl4. The A spectra were measured at five different angles= 55, 64, 73,
81, and 90º. The dependence of the A spectra of DMPNA is quite different from that of
PNA [18]. As increases, the negative peak centered at 1330 cm-1 grows and the small hump centered at 1310 cm-1 disappears. To examine the number of independent components underlying the observed -dependence, we performed SVD of the data. A plot of the singular values obtained from the SVD is displayed in Fig. IV-4(c), and the spectral components associated with the largest three singular values are shown in Fig. IV-4(d). The spectral component 1 shows a clear feature that resembles the flipped pattern of the A spectra, while
components 2 and 3 are dominated by noises. It follows that the observed dependence can be accounted for by assuming only one component. This result contrasts with that of PNA obtained in our previous study [18], where two components which we assigned to the dependent and independent components were found. The independent component of PNA is attributed mainly to an equilibrium shift caused by an external electric field (see Chapter II). Thus the fact that there is only -dependent component for DMPNA is in qualitative agreement with our conclusion on no solvated forms of DMPNA in ACN/C2Cl4.
IV-3-4. On the association structure of ACN in ACN/C2Cl4
As described in IV-3-1, our FT-IR study suggests that DMPNA does not form any specific solvation structure with ACN. Therefore the A signal of the DMPNA s(NO2) band
can be attributed to free DMPNA, and orientational polarization contributions to the DA signal is characterized by the permanent dipole moment of free DMPNA (6.9 D in benzene solution [36]). At this point, we came to an idea of using theA signal intensity of this
DMPNA band as an internal standard to estimate the dipole moment of ACN in the solution. Provided orientational polarization contributions can be extracted from the A spectrum, we
41
are able to obtain quantitative information on the dipole moment P using Eq. II-23. When
using Eq. II-23, we need to evaluate accurately the strength of the local field F; otherwise the resultant P has at most only qualitative significance. However, experimentally it is very
difficult to do so. Our method here can circumvent this problem. The angle in Eq. II-23 is 0º for both the ACN and DMPNA bands (i.e., the transition moments of those modes are parallel to their permanent dipole moments), so that the ratio of the normalized absorbance change
A/A for the ACN band to that of the DMPNA band is equal to the square of the ratio of the
dipole moment of ACN to that of DMPNA:
ACN DMPNA
2 P P ACN DMPNA / / A A A A (IV-1)The quantities in the left-hand side of Eq. IV-1 are obtained experimentally, and PDMPNA is
known. Thus we are able to evaluate PACN without using the local field strength.
To carry out the strategy outlined above, we need to decompose the ΔA spectrum into the distinct contributions described in Chapter ΙΙ by using least-squares fitting. The A spectra at = 55º and 90º and the absorption spectrum are shown in Fig. IV-5. First we fit the absorption spectrum to a superposition of three Gaussian functions plus a baseline represented by a sine function. The best fit is shown in Fig. IV-5(a), and the band widths and peak positions of the three bands so determined are tabulated in Table I. Lorentzian functions, which are usually employed in spectral fitting of homogeneously broadened vibrational bands, did not fit the spectrum well. With those band widths and peak positions fixed, the A spectra
were fit to a linear combination of the zeroth, first, and second derivatives of each absorption band: 2 2 d ( ) d ( ) ( ) ( ) d d A A A a A b c (IV-2)
42
small compared with those of the ACN and DMPNA bands, we did not include that band in the fitting of the A spectra. Adjust parameters in the fitting were the coefficients a, b, and
c, of the derivatives for the ACN and DMPNA bands. Figure IV-6 shows the decomposition of the fitted result into the zeroth, first, and second derivative components
The coefficients determined by the fitting are summarized in Table II. In fitting the 90º and 55º ACN A spectra and the 90º DMPNA A spectrum, we set the coefficients of the
second, zeroth, and second derivative terms fixed to zero, respectively, as the quality of the fit was not improved significantly by letting those parameters vary in the fitting. Here we focus on a’s and attribute b’s and c’s to electronic polarization signals [1]. Detailed analysis of those electronic polarization contributions are left for future studies. A small but nonzero value of afor DMPNA at 55º (−4.2 ×10⁻⁶) is due probably to a minor contribution of electronic polarization and/or to a slight deviation of the angle from 1
cos 1/ 3 54.73. By subtracting this value from the aat 90º, we obtain the orientational polarization contribution for DMPNA as (A/A)DMPNA = −2.0 ×10⁻⁵. For ACN, (A/A)ACN = −1.3 ×10⁻⁵. By
using Eq. IV-1, the ratio ACN DMPNA
P P
is calculated as 0.81. In the solution studied here, DMPNA is considered free, so the dipole moment of individual DMPNA molecule can be used as PDMPNA. We use the dipole moment of DMPNA in benzene, which is known to be 7.0
D at 25 ºC [36]. The choice of DMPNA’s dipole moment in benzene rests on the generally accepted view that benzene is an inert solvent. Therefore, the (effective) dipole moment of ACN in the mixed solvent is obtained as 5.7 D, which is about 1.7 times as large as that of an isolated ACN molecule (~3.4 D [36]). It should be emphasized that this value has been determined free of larger uncertainties almost always associated with local field correction.
We are now able to discuss possible association structures of ACN. There are three possibilities as the partner of ACN in molecular association: DMPNA, ACN, and C2Cl4.
43
Obviously DMPNA is excluded. C2Cl4, an inert solvent, is excluded as well. If C2Cl4 did form
some association structure with ACN, the A spectrum would show a feature at 1356 cm-1. Thus we are left with the possibility of self-association of ACN such as dimer or oligomer formation. There have been debates on association structures of ACN [37-41]. An IR matrix isolation work by Freedman and Nixon [37] suggested the formation of ACN dimers in the matrices, and the dimer structure illustrated in Fig. IV-6(a) was proposed. In this dimer structure, two neighboring ACN molecules strongly interact via the C≡N part and align side by side in an anti-parallel manner. For such an anti-parallel dimer, the two opposite dipole moments cancel out and the effective dipole moment will be nearly zero. This is not consistent with our result. Rather, the value of 5.7 D derived from our data points to a head-to-tail linear dimer shown in Fig. IV-6(b). It has been demonstrated that our approach in IR electroabsorption spectroscopy is useful for determining the dipole moment of molecular species by bypassing the use of the local field strength F.