行政院國家科學委員會專題研究計畫 成果報告
主管酬勞、內部持股與公司價值:以聯立模型分析台灣與美
國的資料
計畫類別: 個別型計畫 計畫編號: NSC90-2416-H-004-021-執行期間: 90 年 08 月 01 日至 91 年 07 月 31 日 執行單位: 國立政治大學會計學系 計畫主持人: 張清福 計畫參與人員: 王婉茲、吳祥福、施佩吟、黃曉惠 報告類型: 精簡報告 處理方式: 本計畫可公開查詢中
華
民
國 92 年 5 月 21 日
主管酬勞、內部持股與公司價值:以聯立模型分析台灣與美國的資料
摘要
本文同時利用台灣以及美國 1997-1999 的資料,探討比較高階主管酬勞、內 部持股與公司價值三者間的內生性關係。美國資料顯示,無論是最小平方法或者 三階段最小平方法(three-stage least squares),主管酬勞與內部持股,皆互為負向 的函數關係。台灣資料則顯示,在最小平方法下,雖然不顯著,但兩者仍互為負 向函數關係;在三階段最小平方法下則兩者互為顯著的負向函數關係。綜合而 言,在三階段最小平方法下,無論台灣或美國的資料均顯示,主管酬勞與內部持 股,顯著地互為負向的函數關係。 在內部持股與公司價值的關係方面,台灣資料顯示,在最小平方法下,內部 持股與公司價值互不具有內生的關係;只有在三階段最小平方法下,內部持股顯 著地為公司價值的正向函數。美國的資料則顯示,無論用最小平方法或三階段最 小平方法,內部持股與公司價值兩者顯著地互為正向的內生關係。 至於主管酬勞與公司價值間是否互相具有內生性,台灣與美國的實證結果迥 異。台灣資料顯示,最小平方法下,兩者間無顯著的關係;但在三階段最小平方 法下,兩者則顯著地互為內生關係。主管酬勞是公司價值的正向函數,而公司價 值則為前一期主管酬勞的正向函數,但為當期主管酬勞的負向函數。美國資料則 顯示兩者間並無顯著之關係。 關鍵字:主管酬勞、內部持股、公司價值、聯立模型
Simultaneous Equations Analysis of Executive Compensation, Insider Ownership, and Firm Value: Evidence from Taiwan and the USA
Abstract
This study examines if executive compensation, insider ownership, and corporate value are endogenously determined. Simultaneous system can cure the inconsistent estimation problem induced by ordinary least squares in the case that the variables are endogenously determined. This study compares the empirical results of Taiwan and the USA for the endogenicity among executive compensation, insider ownership, and corporate value.
The USA evidence shows that under both OLS and three-stage least squares (3SLS), executive compensation is a negative function of insider ownership, and vice versa. Taiwan evidence under OLS shows that the executive compensation is a negative but insignificant function of insider ownership, and vice versa. However, under 3SLS, Taiwan evidence shows the same results as those of the USA evidence. Putting together, under 3SLS, Taiwan and the USA evidences show the same results that executive compensation is a negative function of insider ownership and vice versa.
Taiwan evidence shows that under OLS the insider ownership and corporate value are not significantly correlated. But under 3SLS, insider ownership is a positive function of corporate value. However, the USA evidence shows that under both methods of OLS and 3SLS, insider ownership and corporate value are positively endogenously determined.
As for the relation between executive compensation and corporate value, Taiwan evidence is dramatically different from that of the USA. Taiwan evidence shows that they are not significantly related under OLS method. However, under 3SLS method, they are endogenously determined. On the other hand, corporate value is a positive function of 1-period lagged executive compensation but a negative function of current executive compensation. However, the USA evidence shows no relation between executive compensation and corporate value under both methods.
Key Words: Executive Compensation, Insider Ownership, Corporate Value, Simultaneous Equations
1. Introduction
Morck et al. (1988) and McConnell and Servaes (1990) find that the
ownership structure affects corporate value while Mconnell and Servaes (1990) also find that investment affects corporate value. Based on these prior studies, Cho (1998) further show that ownership structure affects investment which, then, affects
corporate value and that ownership structure, investment, and corporate value are endogenously determined. As with Demsetz and Lehn (1985), Cho (1998) contends that if ownership structure is endogenously determined, the estimates from OLS should be inconsistent leading to misinterpretation of the results. Chung and Pruitt (1996) find the simultaneous relation among executive ownership, corporate value, and executive compensation. Following this line of research, this study investigates endogenicity among executive compensation, insider ownership, and corporate value for the evidences from Taiwan and the USA.
Chung and Pruitt (1996) analyze the relation among CEO stockholding, CEO compensation and corporate value while controlling for CEO’s personal
characteristics such as years as the CEO, age, and founder status for the year 1987 and find that a firm’s market value, executive stock ownership, and executive
compensation are jointly determined. However, their executive compensation includes merely the cash compensation, i.e., salary and bonus. The executive compensation contains a large set of components including cash compensation, stock options, long-term performance plans, etc. More importantly, the compensation other than the cash compensation takes very large portion of the executive compensation. In addition, they primarily control for CEO’s personal characteristics while examining the relation among the executive ownership, corporate value, and executive compensation, though firm characteristics may play important role in the determination of their relation.
This study provides updated evidence concerning the simultaneous relation among executive compensation, insider ownership, and corporate value by using the mean value during 1997-1999 with executive compensation defined as executive total compensation while controlling for a variety of firm characteristics such as firm performance, growth, capital expenditure, size, leverage, capitalization, R&D expenditure, etc. This study compares the results from ordinary least squares and simultaneous systems for the evidences of Taiwan and the USA and also makes comparison of the results from three-stage least squares between Taiwan and the USA.
Chung and Pruitt (1996) primarily find the relation between compensation and corporate value and that between ownership and corporate value while we find the
mutual endogenicity of executive compensation and insider ownership and that between insider ownership and corporate value.
In modern agency theory, the executive compensation plays an important role in mitigating the agency problem so that the executive compensation is a function of firm performance. The incentive of compensation contract further motivates executive to perform in the interest of shareholders. In such a way, the executive compensation and firm performance are both endogenous in the principal-agent framework. In addition to firm performance, the determinants of executive compensation, among others, include firm value, insider ownership, and other firm characteristics. Are some of these determinants of executive compensation such as insider ownership and firm value also determined by the executive compensation?
Recent empirical studies find that investment affects firm value which, in turn, affects insider ownership. Based on data from Taiwan and the USA, this study applies simultaneous model to investigating the mutual endogenicity of executive
compensation, insider ownership and firm value. With firm characteristics as predetermined variables, do executive compensation, insider ownership and firm value affect each other?
Consistent with earlier research results of the US data, the findings of Taiwan’s research show that the insider ownership affects firm value. However, a recent US study using simultaneous equations analysis finds the reverse result that the insider ownership increases with the increase in firm value. The specification of OLS does not control for endogenicity. The misspecification of OLS without controlling for endogenicity will yield inconsistent coefficients. This study investigates the endogenicity among executive compensation, insider ownership, and firm value. Furthermore, the evidence from two economies, Taiwan and the US, will enrich the study findings.
2. Hypotheses
In this section, we discuss how the executive compensation, insider ownership, and corporate value are mutually related and how the firm characteristics may affect each of these variables.
2.1 Executive compensation and insider ownership
Executive compensation is a composite of salary, bonus, other annual, total value of restricted stock granted, total value of stock options granted (using Black-Scholes method), long-term incentive payouts, and all other total. In economic booming
period, a large portion of executive compensation comes from stock-based compensation which increases insider ownership. The insider ownership is an
accumulated amount while the stock-based compensation is an increase in the insider ownership. Suppose the executives are risk averse, they tend to reduce the holdings and therefore diversify risk if they could receive large amount of stock-based compensation from their companies every year. On the other hand, if the executive has held large amount of shares then the firm may provide the executive alternative compensation with higher utility than stock-based compensation provides. This inference leads to the following two hypotheses:
H1: Executive compensation is a negative function of insider ownership.
H2: Insider ownership is a negative function of executive compensation.
2.2 Insider ownership and corporate value
The greater the executive’s shareholding of the firm, the stronger the incentive s/he may have to put effort toward the shareholders’ wealth. This is the basic goal of the long-term incentive compensation plan which is designed to align the interests of managers and shareholders. The reduction in agency problem would leads to the increase of corporate value. Jensen and Meckling (1976) and Stulz (1988) find the insider ownership affects corporate value. We measure the corporate value as the Tobin’s q and have the third hypothesis.
H3: Corporate value is a positive function of insider ownership.
On the other hand, the higher the corporate value the stronger the executive’s incentive to hold the firm’s outstanding shares. In modern compensation scheme, the firm tends to pay large amount of stock-based compensation. The executive is willing to hold large shares when the firm performs well and has high corporate value.
H4: Insider ownership is a positive function of corporate value.
2.3 Executive compensation and corporate value
According to agency theory, executive compensation is designed to increase in firm performance which may be measured with a variety of proxies including corporate value. Therefore the higher the corporate value the more the executive
compensation. Corporate value is measured as Tobin’s q in this study. On the contrary, suppose the firm provides generous compensation package to motivate the manager to work, the corporate value, as a measure of firm performance, should increase.
Therefore the higher the corporate value the more executive compensation.
H5: Executive compensation is a positive function of corporate value.
H6: Corporate value is a positive function of executive compensation.
2.4 Firm characteristics as control variables
Firm performance
In literature, executive compensation and firm performance are found positively correlated (Murphy 1985; Smith and Watts 1992; Gaver and Gaver 1993). Firm performance can be categorized as financial and non-financial performance. Financial performance could either be accounting measure or market measure. Accounting measures and market measures of firm performance provide different information (Lambert and Larcker 1987) In this study, we use return on assets (ROA) and market return (RET) as measures for financial performance. Financial performance can also affect the corporate value and insider ownership since the better the firm performance the more the corporate value and, in turn, the more the manager’s shareholding.
Investment
McConnell and Muscarella (1985) show that investment positively affects
corporate value. The investment may indirectly affect insider ownership and executive compensation though corporate value. We measure the investment as R&D and capital expenditure.
Leverage
As a firm characteristic, leverage may directly affect the corporate value and indirectly affect insider ownership and executive compensation. We use two measures for leverage, i.e., the ratio of long-term debt to total assets and the ratio of total liabilities to equity.
Growth
Smith and Watts (1992) and Chakraborty et al. (1999) contend that growth represents the investment opportunity. The growth may affect the corporate value and, in turn, the executive compensation. In addition, a firm’s growth may attract managers
to devote in larger shareholding.
Size
The managers in larger firms face complex managerial task. In such a situation, large firms usually provide large compensation to the talented executives (Finkelstein and Hambrick 1989). Firm size may also affect the insider ownership and corporate value.
3. Methodology
This study uses simultaneous equations model to investigate the possibility that executive compensation, insider ownership, and firm value are endogenously determined.
The simultaneous equations model can be specified in a functional form:
Compensation = f (corporate value, insider ownership, firm performance, investment,
leverage, size)
Insider ownership = f (compensation, corporate value, firm performance, investment,
leverage, size)
Corporate value = f (compensation, insider ownership, one-period lagged
compensation, firm performance, investment, growth, size) Measure of variables:
1. Compensation: salary and bonus for Taiwan sample and total compensation for the USA sample
2. Insider ownership: percentage of insider equity shareholding 3. Corporate value: Tobin’s Q
4. Firm performance: market return (RET) and return on assets (ROA) 5. Investment: logarithm of capital expenditure and the ratio of R&D to total
assets
6. Leverage: the ratio of long-term debt to total assets and the ratio of total liabilities to equity
7. Growth: market-to-book equity ratio 8. Size: logarithm of sales
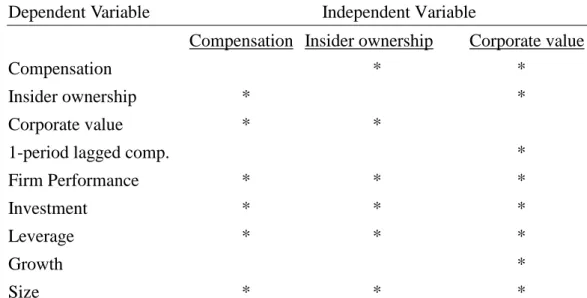
The following table presents simultaneous equations analysis of compensation, insider ownership and firm value in a diagram.
Simultaneous Equations Analysis of Compensation, Insider Ownership, and Corporate Value
Dependent Variable Independent Variable
Compensation Insider ownership Corporate value
Compensation * *
Insider ownership * *
Corporate value * *
1-period lagged comp. *
Firm Performance * * *
Investment * * *
Leverage * * *
Growth *
Size * * *
* Asterisks indicate the independent and dependent variables in each equation.
4. Sample
Taiwan government requires the listed firms provide executive compensation including salary, bonus and other fees for the public starting from 1996. However, since this study use 1-year lagged compensation and therefore we lose one-year data of 1996 in the sample. For comparison of the evidence from Taiwan and the USA, we have both samples during 1997-1999. Three-year average data are used as input to the simultaneous system. Therefore, firms should have 3-year complete data to be
included in the sample. Finally, Taiwan sample includes 66 firms while the USA sample 234 firms.
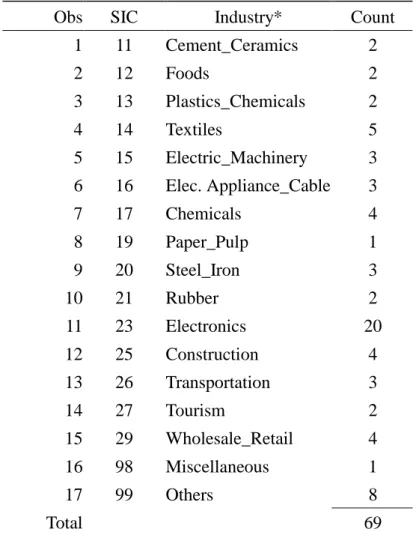
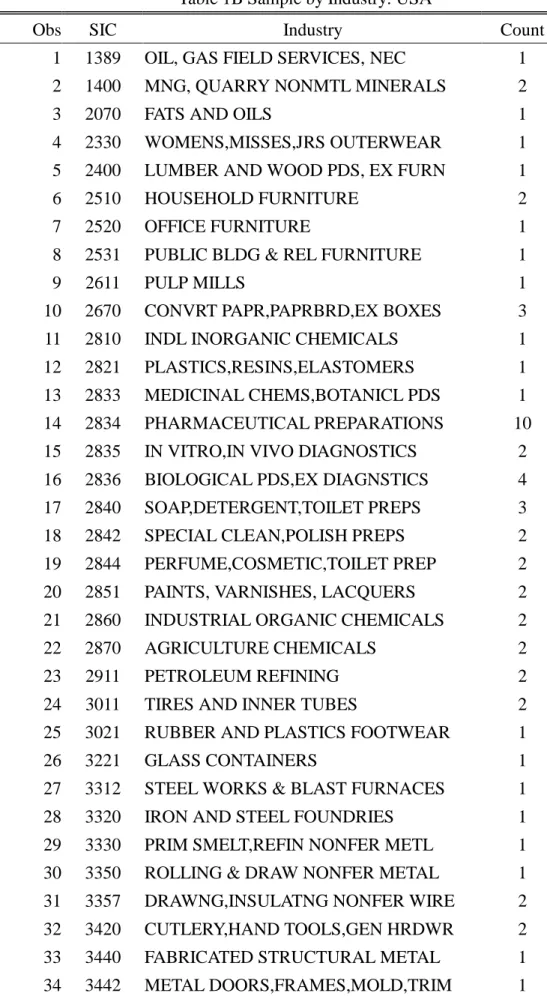
Listed firms in Taiwan are classified into 21 industries. As shown in Table 1A, Taiwan sample of 66 firms covers 17 out of 21 industries, except industry of glass and ceramics, automobile, electronics II, and finance. Table 1B shows that the 234 firms of USA sample are drawn from 116 industries based on four-digit SIC classification. On average each industry has 4 firms in Taiwan sample while 2 in the USA sample.
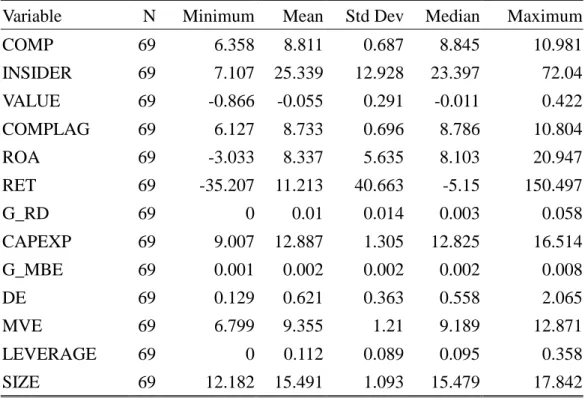
Table 2A and Table 2B are descriptive statistics for Taiwan sample and the USA sample, respectively. Overall the data distributions for these two samples are not skewed except for corporate value and market return in Taiwan sample and market return and the ratio of R&D to total assets in the USA sample.
Taiwan data come from Taiwan Economic Journal Database while the USA data from two databases, ExecuComp and COMPUSTAT.
5. Empirical Results
value are endogenously determined. Simultaneous system can cure the inconsistent estimation problem induced by ordinary least squares in the case that the variables are endogenously determined. This study compares the empirical results of Taiwan and the USA for the endogenicity among executive compensation, insider ownership, and corporate value.
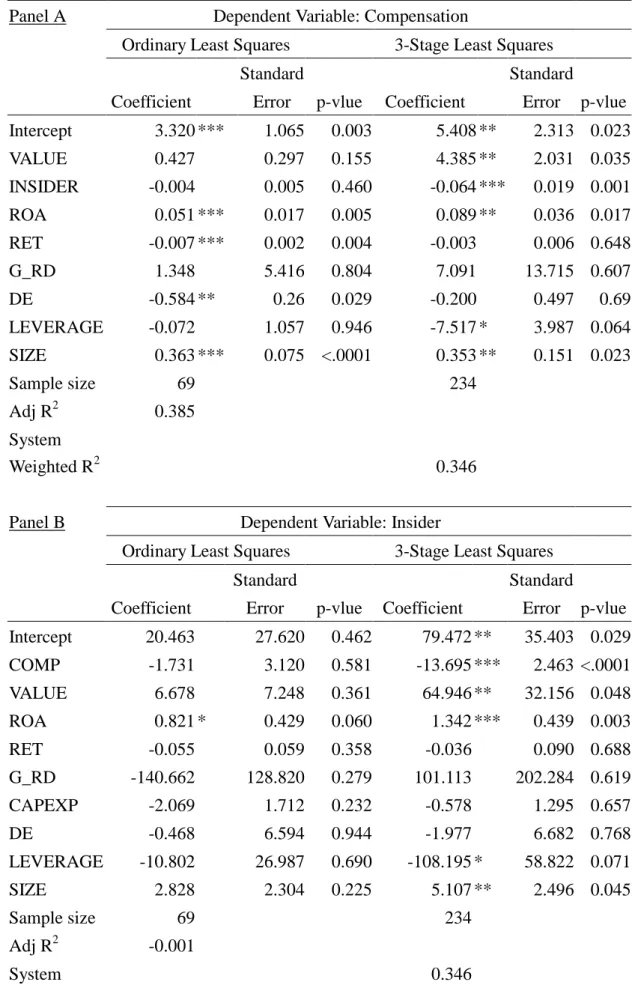
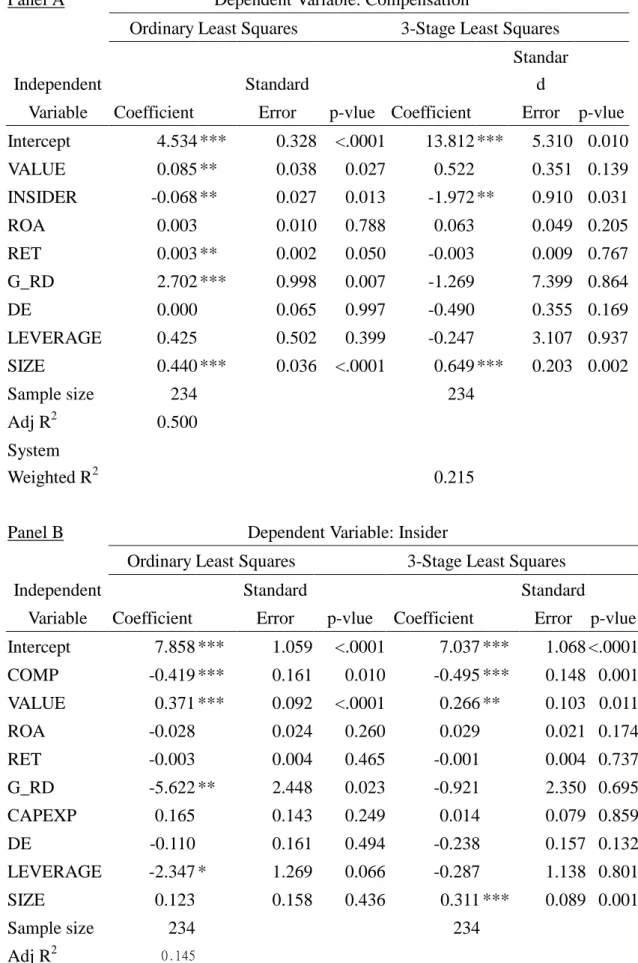
In Panel A and Panel B of Table 3B, the USA evidence shows that under both OLS and three-stage least squares (3SLS), executive compensation is a negative function of insider ownership, and vice versa. In Panel A and Panel B of Table 3A, Taiwan evidence under OLS shows that executive compensation is a negative but insignificant function of insider ownership, and vice versa. However, under 3SLS, Taiwan evidence shows the same results as those of the USA evidence. Putting together, under 3SLS, Taiwan and the USA evidences show the same results that executive compensation is a negative function of insider ownership and vice versa.
In Panel B and Panel C of Table 3A, Taiwan evidence shows that under OLS the insider ownership and corporate value are not significantly correlated. But under 3SLS, insider ownership is a positive function of corporate value. However, in Panel B and Panel C, the USA evidence shows that under both methods of OLS and 3SLS, insider ownership and corporate value are positively endogenously determined.
As for the relation between executive compensation and corporate value, in Panel A and Panel C, Taiwan evidence is dramatically different from the USA evidence. Taiwan evidence shows that they do not have significant relation under OLS method. However, under 3SLS method, they are endogenously determined. On the other hand, corporate value is a positive function of 1-period lagged executive compensation but a negative function of current executive compensation. However, in Panel A and Panel C, the USA evidence shows no relation between executive
compensation and corporate value under both methods.
References
Chakraborty, A. and M. Kazarosian and E. A. Trahan. 1999. Uncertainty in executive compensation and capital investment: A panel study. Financial Management 28:
126-139.
Cho. M. H. 1998. Ownership structure, investment, and the corporate value: An empirical analysis. Journal of Financial Economics 47: 103-121.
Chung, K. H. and S. W. Pruitt. 1996. Executive ownership, corporate value, and executive compensation: A unifying framework. Journal of Banking & Finance
20: 1135-1159.
consequences. Journal of Political Economy 93: 1155-1177.
Finkelstein, S. and D. C. Hambrick. 1989. Chief executive compensation: A study of the intersection of markets and political process. Strategic Management Journal,
47-53.
Gaver, J. J. and K. M. Gaver. 1993. Additional evidence on the association between the investment opportunity set and corporate financing, dividend, and
compensation policies. Journal of Accounting and Economics 16: 125-160.
Jensen, M. and W. H. Meckling. 1976. Theory of the firm: Managerial behavior, agency cost, and ownership structure. Journal of Financial Economics 3:
305-360.
Lambert, R. A. and D. F. Larcker. 1987. An analysis of the use of accounting and market measures of performance in executive compensation contracts. Journal of Accounting Research 25 (Supplement): 85-125.
McConnell, J. and C. J. Muscarella. 1985. Corporate capital expenditure decisions and the market value of the firm. Journal of Financial Economics 14: 399-422.
McConnell, J. and H. Servaes. 1990. Additional evidence on equity ownership and corporate value. Journal of Financial Economics 27: 595-613.
Morck, R., A. Shleifer, and R. W. Vishny. 1988. Management ownership and Market Valuation. Journal of Financial Economics 20: 293-315.
Murphy, K. 1985. Corporate performance and managerial remuneration. Journal of Accounting and Economics 7: 11-42.
Smith, C. W. and R. L. Watts. 1992. The investment opportunity set and corporation financing, dividend, and compensation policies. Journal of Financial Economics
32: 263-292.
Stulz, R. 1988. Managerial control of voting rights: Financing policies and the market for corporate control. Journal of Financial Economics 20: 25-54.
Table 1A Sample by Industry: Taiwan
Obs SIC Industry* Count
1 11 Cement_Ceramics 2 2 12 Foods 2 3 13 Plastics_Chemicals 2 4 14 Textiles 5 5 15 Electric_Machinery 3 6 16 Elec. Appliance_Cable 3 7 17 Chemicals 4 8 19 Paper_Pulp 1 9 20 Steel_Iron 3 10 21 Rubber 2 11 23 Electronics 20 12 25 Construction 4 13 26 Transportation 3 14 27 Tourism 2 15 29 Wholesale_Retail 4 16 98 Miscellaneous 1 17 99 Others 8 Total 69
Table 1B Sample by Industry: USA
Obs SIC Industry Count
1 1389 OIL, GAS FIELD SERVICES, NEC 1 2 1400 MNG, QUARRY NONMTL MINERALS 2
3 2070 FATS AND OILS 1
4 2330 WOMENS,MISSES,JRS OUTERWEAR 1 5 2400 LUMBER AND WOOD PDS, EX FURN 1
6 2510 HOUSEHOLD FURNITURE 2
7 2520 OFFICE FURNITURE 1
8 2531 PUBLIC BLDG & REL FURNITURE 1
9 2611 PULP MILLS 1
10 2670 CONVRT PAPR,PAPRBRD,EX BOXES 3
11 2810 INDL INORGANIC CHEMICALS 1
12 2821 PLASTICS,RESINS,ELASTOMERS 1 13 2833 MEDICINAL CHEMS,BOTANICL PDS 1 14 2834 PHARMACEUTICAL PREPARATIONS 10 15 2835 IN VITRO,IN VIVO DIAGNOSTICS 2 16 2836 BIOLOGICAL PDS,EX DIAGNSTICS 4 17 2840 SOAP,DETERGENT,TOILET PREPS 3 18 2842 SPECIAL CLEAN,POLISH PREPS 2 19 2844 PERFUME,COSMETIC,TOILET PREP 2 20 2851 PAINTS, VARNISHES, LACQUERS 2 21 2860 INDUSTRIAL ORGANIC CHEMICALS 2
22 2870 AGRICULTURE CHEMICALS 2
23 2911 PETROLEUM REFINING 2
24 3011 TIRES AND INNER TUBES 2
25 3021 RUBBER AND PLASTICS FOOTWEAR 1
26 3221 GLASS CONTAINERS 1
27 3312 STEEL WORKS & BLAST FURNACES 1
28 3320 IRON AND STEEL FOUNDRIES 1
29 3330 PRIM SMELT,REFIN NONFER METL 1 30 3350 ROLLING & DRAW NONFER METAL 1 31 3357 DRAWNG,INSULATNG NONFER WIRE 2 32 3420 CUTLERY,HAND TOOLS,GEN HRDWR 2 33 3440 FABRICATED STRUCTURAL METAL 1 34 3442 METAL DOORS,FRAMES,MOLD,TRIM 1
35 3452 BOLT,NUT,SCREW,RIVETS,WASHRS 1 36 3490 MISC FABRICATED METAL PRODS 1 37 3523 FARM MACHINERY AND EQUIPMENT 1 38 3531 CONSTRUCTION MACHINERY & EQ 3 39 3533 OIL & GAS FIELD MACHY, EQUIP 1 40 3540 METALWORKING MACHINERY & EQ 2 41 3559 SPECIAL INDUSTRY MACHY, NEC 4
42 3562 BALL AND ROLLER BEARINGS 1
43 3564 INDL COML FANS,BLOWRS,OTH EQ 2
44 3571 ELECTRONIC COMPUTERS 3
45 3572 COMPUTER STORAGE DEVICES 1
46 3576 COMPUTER COMMUNICATION EQUIP 1 47 3577 COMPUTER PERIPHERAL EQ, NEC 1 48 3578 CALCULATE,ACCT MACH,EX COMP 1 49 3585 AIR COND,HEATING,REFRIG EQ 1 50 3600 ELECTR, OTH ELEC EQ, EX CMP 1 51 3620 ELECTRICAL INDL APPARATUS 1
52 3621 MOTORS AND GENERATORS 2
53 3630 HOUSEHOLD APPLIANCES 1
54 3640 ELECTRIC LIGHTING,WIRING EQ 2 55 3661 TELE & TELEGRAPH APPARATUS 5 56 3663 RADIO,TV BROADCAST, COMM EQ 1 57 3669 COMMUNICATIONS EQUIP, NEC 1 58 3670 ELECTRONIC COMP, ACCESSORIES 2
59 3672 PRINTED CIRCUIT BOARDS 2
60 3674 VEHICULAR LIGHTING EQUIPMENT 11
61 3678 ELECTRONIC CONNECTORS 1
62 3714 MOTOR VEHICLE PART,ACCESSORY 7
63 3715 TRUCK TRAILERS 1
64 3728 AIRCRAFT PARTS, AUX EQ, NEC 2 65 3730 SHIP & BOAT BLDG & REPAIRING 1 66 3751 MOTORCYCLES,BICYCLES & PARTS 1 67 3821 LAB APPARATUS AND FURNITURE 1 68 3823 INDUSTRIAL MEASUREMENT INSTR 2 69 3825 ELEC MEAS & TEST INSTRUMENTS 1 70 3826 LAB ANALYTICAL INSTRUMENTS 1 71 3827 OPTICAL INSTRUMENTS & LENSES 1
72 3841 SURGICAL,MED INSTR,APPARATUS 3 73 3842 ORTHO,PROSTH,SURG APPL,SUPLY 4 74 3843 DENTAL EQUIPMENT & SUPPLIES 1 75 3844 X-RAY & RELATED APPARATUS 1
76 3845 ELECTROMEDICAL APPARATUS 4
77 3861 PHOTOGRAPHIC EQUIP & SUPPL 2
78 3942 DOLLS AND STUFFED TOYS 1
79 3949 SPORTING & ATHLETIC GDS,NEC 1 80 4813 PHONE COMM EX RADIOTELEPHONE 1
81 5000 DURABLE GOODS-WHOLESALE 1
82 5010 MOTOR VEH PARTS, SUPPLY-WHSL 1 83 5045 COMPUTERS & SOFTWARE-WHSL 1 84 5070 HARDWR, PLUMB, HEAT EQ-WHSL 1 85 5122 DRUGS AND PROPRIETARY-WHSL 2 86 5200 BLDG MATL,HARDWR,GARDEN-RETL 1 87 5211 LUMBER & OTH BLDG MATL-RETL 2
88 5311 DEPARTMENT STORES 3
89 5331 VARIETY STORES 6
90 5399 MISC GENERAL MDSE STORES 1
91 5411 GROCERY STORES 3
92 5500 AUTO DEALERS, GAS STATIONS 1 93 5531 AUTO AND HOME SUPPLY STORES 3 94 5600 APPAREL AND ACCESSORY STORES 2
95 5651 FAMILY CLOTHING STORES 5
96 5661 SHOE STORES 1
97 5700 HOME FURNITURE & EQUIP STORE 2 98 5731 RADIO,TV,CONS ELECTR STORES 1 99 5734 CMP AND CMP SOFTWARE STORES 1
100 5812 EATING PLACES 8
101 5912 DRUG & PROPRIETARY STORES 3 102 5940 MISC SHOPPING GOODS STORES 4 103 5945 HOBBY, TOY, AND GAME SHOPS 2 104 6200 SECURITY & COMMODITY BROKERS 1
105 7200 PERSONAL SERVICES 1
106 7370 CMP PROGRAMMING,DATA PROCESS 2
107 7372 PREPACKAGED SOFTWARE 8
109 7374 PREPACKAGED SOFTWARE 2 110 7812 MOTION PIC, VIDEOTAPE PRODTN 1 111 7990 MISC AMUSEMENT & REC SERVICE 3 112 8062 GEN MED & SURGICAL HOSPITALS 1 113 8090 MISC HEALTH & ALLIED SVC,NEC 1 114 8093 SPEC OUTPATIENT FACILITY,NEC 1 115 8700 ENGR,ACC,RESH,MGMT,REL SVCS 1
116 9997 CONGLOMERATES 1
Table 2A Descriptive Statistics for 1997-1999: Taiwan
Variable N Minimum Mean Std Dev Median Maximum
COMP 69 6.358 8.811 0.687 8.845 10.981 INSIDER 69 7.107 25.339 12.928 23.397 72.04 VALUE 69 -0.866 -0.055 0.291 -0.011 0.422 COMPLAG 69 6.127 8.733 0.696 8.786 10.804 ROA 69 -3.033 8.337 5.635 8.103 20.947 RET 69 -35.207 11.213 40.663 -5.15 150.497 G_RD 69 0 0.01 0.014 0.003 0.058 CAPEXP 69 9.007 12.887 1.305 12.825 16.514 G_MBE 69 0.001 0.002 0.002 0.002 0.008 DE 69 0.129 0.621 0.363 0.558 2.065 MVE 69 6.799 9.355 1.21 9.189 12.871 LEVERAGE 69 0 0.112 0.089 0.095 0.358 SIZE 69 12.182 15.491 1.093 15.479 17.842
COMP: executive total compensation; INSIDER: insider ownership;
VALUE: corporate value; COMPLAG: executive total compensation with one period lag; ROA: return on assets; RET: 1-year market return; G_RD: R&D; CAPEXP: capital expenditure; G_MBE: market-to-book equity ratio; DE: total liability over stockholders’ equity; MVE: market value of equity; LEVERAGE: long-term liability over total assets; SIZE: firm size.
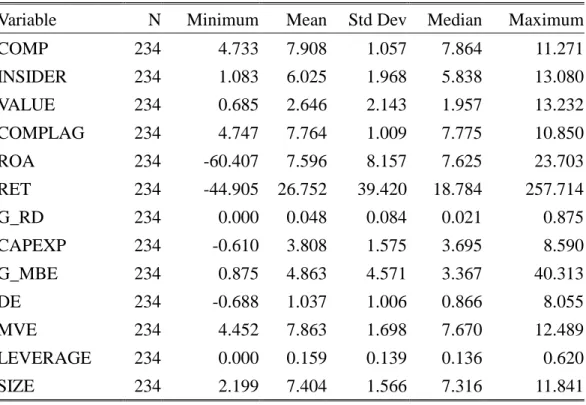
Table 2B Descriptive Statistics for 1997-1999: USA
Variable N Minimum Mean Std Dev Median Maximum COMP 234 4.733 7.908 1.057 7.864 11.271 INSIDER 234 1.083 6.025 1.968 5.838 13.080 VALUE 234 0.685 2.646 2.143 1.957 13.232 COMPLAG 234 4.747 7.764 1.009 7.775 10.850 ROA 234 -60.407 7.596 8.157 7.625 23.703 RET 234 -44.905 26.752 39.420 18.784 257.714 G_RD 234 0.000 0.048 0.084 0.021 0.875 CAPEXP 234 -0.610 3.808 1.575 3.695 8.590 G_MBE 234 0.875 4.863 4.571 3.367 40.313 DE 234 -0.688 1.037 1.006 0.866 8.055 MVE 234 4.452 7.863 1.698 7.670 12.489 LEVERAGE 234 0.000 0.159 0.139 0.136 0.620 SIZE 234 2.199 7.404 1.566 7.316 11.841 COMP: executive total compensation; INSIDER: insider ownership;
VALUE: corporate value; COMPLAG: executive total compensation with one period lag; ROA: return on assets; RET: 1-year market return; G_RD: R&D; CAPEXP: capital expenditure; G_MBE: market-to-book equity ratio; DE: total liability over stockholders’ equity; MVE: market value of equity; LEVERAGE: long-term liability over total assets; SIZE: firm size.
Table 3A Comparison of Results from OLS and 3SLS: Taiwan Panel A Dependent Variable: Compensation
Ordinary Least Squares 3-Stage Least Squares
Standard Standard
Coefficient Error p-vlue Coefficient Error p-vlue Intercept 3.320 *** 1.065 0.003 5.408 ** 2.313 0.023 VALUE 0.427 0.297 0.155 4.385 ** 2.031 0.035 INSIDER -0.004 0.005 0.460 -0.064 *** 0.019 0.001 ROA 0.051 *** 0.017 0.005 0.089 ** 0.036 0.017 RET -0.007 *** 0.002 0.004 -0.003 0.006 0.648 G_RD 1.348 5.416 0.804 7.091 13.715 0.607 DE -0.584 ** 0.26 0.029 -0.200 0.497 0.69 LEVERAGE -0.072 1.057 0.946 -7.517 * 3.987 0.064 SIZE 0.363 *** 0.075 <.0001 0.353 ** 0.151 0.023 Sample size 69 234 Adj R2 0.385 System Weighted R2 0.346
Panel B Dependent Variable: Insider
Ordinary Least Squares 3-Stage Least Squares
Standard Standard
Coefficient Error p-vlue Coefficient Error p-vlue Intercept 20.463 27.620 0.462 79.472 ** 35.403 0.029 COMP -1.731 3.120 0.581 -13.695 *** 2.463 <.0001 VALUE 6.678 7.248 0.361 64.946 ** 32.156 0.048 ROA 0.821 * 0.429 0.060 1.342 *** 0.439 0.003 RET -0.055 0.059 0.358 -0.036 0.090 0.688 G_RD -140.662 128.820 0.279 101.113 202.284 0.619 CAPEXP -2.069 1.712 0.232 -0.578 1.295 0.657 DE -0.468 6.594 0.944 -1.977 6.682 0.768 LEVERAGE -10.802 26.987 0.690 -108.195 * 58.822 0.071 SIZE 2.828 2.304 0.225 5.107 ** 2.496 0.045 Sample size 69 234 Adj R2 -0.001 System Weighted R2 0.346
Panel C Dependent Variable: Value
Ordinary Least Squares 3-Stage Least Squares
Standard Standard
Coefficient Error p-vlue Coefficient Error p-vlue Intercept -0.668 0.573 0.249 -1.595 1.564 0.312 COMP -0.130 0.161 0.423 -1.853 ** 0.872 0.038 INSIDER 0.002 0.003 0.519 0.072 0.059 0.230 COMPLAG 0.135 0.159 0.400 2.008 ** 0.834 0.019 RET -0.002 * 0.001 0.090 0.008 0.007 0.265 G_RD -5.944 ** 2.499 0.021 8.077 12.475 0.520 CAPEXP 0.074 ** 0.033 0.027 0.125 0.100 0.215 G_MBE 0.111 38.512 0.998 -291.793 330.795 0.381 MVE 0.043 0.066 0.514 0.009 0.214 0.968 SIZE -0.048 0.053 0.370 -0.172 0.241 0.478 Sample size 69 234 Adj R2 0.2023 System Weighted R2 0.346
COMP: executive total compensation; INSIDER: insider ownership; VALUE:
corporate value; COMPLAG: executive total compensation with one period lag; ROA: return on assets; RET: 1-year market return; G_RD: R&D; CAPEXP: capital
expenditure; G_MBE: market-to-book equity ratio; DE: total liability over
stockholders’ equity; MVE: market value of equity; LEVERAGE: long-term liability over total assets; SIZE: firm size.
Asterisks indicate significance at 0.01 (***), 0.05 (**), and 0.10 (*) levels, two-sided test.
Table 3B Comparison of Results from OLS and 3SLS: USA Panel A Dependent Variable: Compensation
Ordinary Least Squares 3-Stage Least Squares
Independent Standard
Standar d
Variable Coefficient Error p-vlue Coefficient Error p-vlue Intercept 4.534 *** 0.328 <.0001 13.812 *** 5.310 0.010 VALUE 0.085 ** 0.038 0.027 0.522 0.351 0.139 INSIDER -0.068 ** 0.027 0.013 -1.972 ** 0.910 0.031 ROA 0.003 0.010 0.788 0.063 0.049 0.205 RET 0.003 ** 0.002 0.050 -0.003 0.009 0.767 G_RD 2.702 *** 0.998 0.007 -1.269 7.399 0.864 DE 0.000 0.065 0.997 -0.490 0.355 0.169 LEVERAGE 0.425 0.502 0.399 -0.247 3.107 0.937 SIZE 0.440 *** 0.036 <.0001 0.649 *** 0.203 0.002 Sample size 234 234 Adj R2 0.500 System Weighted R2 0.215
Panel B Dependent Variable: Insider
Ordinary Least Squares 3-Stage Least Squares
Independent Standard Standard
Variable Coefficient Error p-vlue Coefficient Error p-vlue Intercept 7.858 *** 1.059 <.0001 7.037 *** 1.068 <.0001 COMP -0.419 *** 0.161 0.010 -0.495 *** 0.148 0.001 VALUE 0.371 *** 0.092 <.0001 0.266 ** 0.103 0.011 ROA -0.028 0.024 0.260 0.029 0.021 0.174 RET -0.003 0.004 0.465 -0.001 0.004 0.737 G_RD -5.622 ** 2.448 0.023 -0.921 2.350 0.695 CAPEXP 0.165 0.143 0.249 0.014 0.079 0.859 DE -0.110 0.161 0.494 -0.238 0.157 0.132 LEVERAGE -2.347 * 1.269 0.066 -0.287 1.138 0.801 SIZE 0.123 0.158 0.436 0.311 *** 0.089 0.001 Sample size 234 234 Adj R2 0.145
System
Panel C Dependent Variable: Value
Ordinary Least Squares 3-Stage Least Squares
Independent Standard Standard
Variable Coefficient Error p-vlue Coefficient Error p-vlue Intercept 0.991 ** 0.481 0.040 -1.912 1.829 0.297 COMP 0.093 0.181 0.608 -1.852 1.667 0.268 INSIDER 0.095 *** 0.027 0.001 0.593 *** 0.206 0.004 COMPLAG -0.389 ** 0.178 0.030 1.691 1.507 0.263 RET 0.003 * 0.002 0.053 0.008 * 0.005 0.078 G_RD 0.031 0.741 0.967 2.225 * 1.320 0.093 CAPEXP -0.126 ** 0.058 0.033 -0.005 0.085 0.949 G_MBE 0.284 *** 0.017 <.0001 0.283 *** 0.037 <.0001 MVE 0.888 *** 0.083 <.0001 0.566 *** 0.123 <.0001 SIZE -0.621 *** 0.079 <.0001 -0.491 *** 0.133 0.000 Sample size 234 234 Adj R2 0.874 System Weighted R2 0.215
COMP: executive total compensation; INSIDER: insider ownership; VALUE:
corporate value; COMPLAG: executive total compensation with one period lag; ROA: return on assets; RET: 1-year market return; G_RD: R&D; CAPEXP: capital
expenditure; G_MBE: market-to-book equity ratio; DE: total liability over
stockholders’ equity; MVE: market value of equity; LEVERAGE: long-term liability over total assets; SIZE: firm size.
Asterisks indicate significance at 0.01 (***), 0.05 (**), and 0.10 (*) levels, two-sided test.
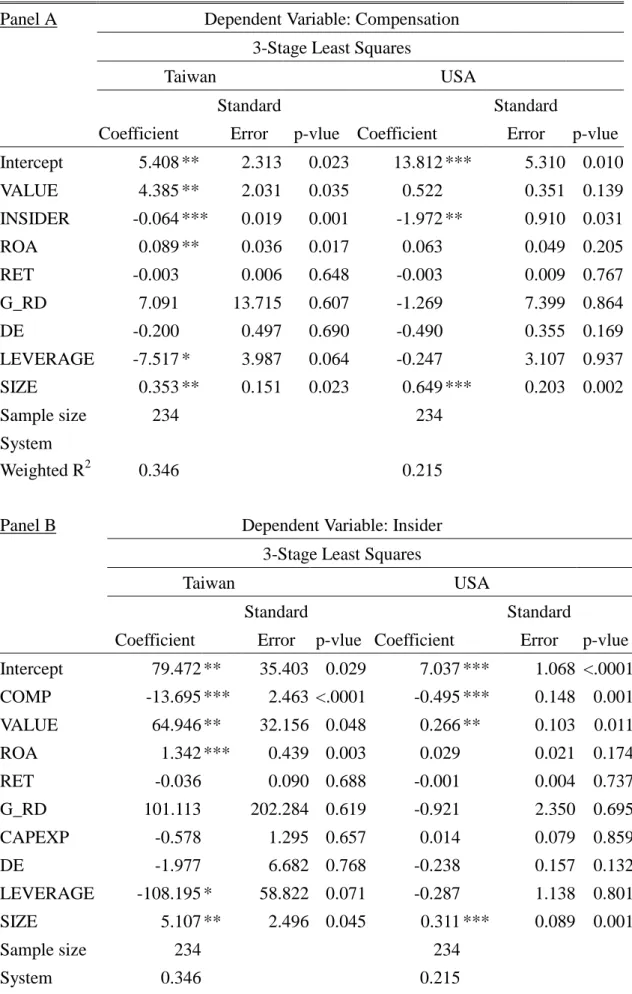
Table 4 Comparison of the Results for Taiwan and the USA: 3SLS Panel A Dependent Variable: Compensation
3-Stage Least Squares
Taiwan USA
Standard Standard
Coefficient Error p-vlue Coefficient Error p-vlue Intercept 5.408 ** 2.313 0.023 13.812 *** 5.310 0.010 VALUE 4.385 ** 2.031 0.035 0.522 0.351 0.139 INSIDER -0.064 *** 0.019 0.001 -1.972 ** 0.910 0.031 ROA 0.089 ** 0.036 0.017 0.063 0.049 0.205 RET -0.003 0.006 0.648 -0.003 0.009 0.767 G_RD 7.091 13.715 0.607 -1.269 7.399 0.864 DE -0.200 0.497 0.690 -0.490 0.355 0.169 LEVERAGE -7.517 * 3.987 0.064 -0.247 3.107 0.937 SIZE 0.353 ** 0.151 0.023 0.649 *** 0.203 0.002 Sample size 234 234 System Weighted R2 0.346 0.215
Panel B Dependent Variable: Insider 3-Stage Least Squares
Taiwan USA
Standard Standard
Coefficient Error p-vlue Coefficient Error p-vlue Intercept 79.472 ** 35.403 0.029 7.037 *** 1.068 <.0001 COMP -13.695 *** 2.463 <.0001 -0.495 *** 0.148 0.001 VALUE 64.946 ** 32.156 0.048 0.266 ** 0.103 0.011 ROA 1.342 *** 0.439 0.003 0.029 0.021 0.174 RET -0.036 0.090 0.688 -0.001 0.004 0.737 G_RD 101.113 202.284 0.619 -0.921 2.350 0.695 CAPEXP -0.578 1.295 0.657 0.014 0.079 0.859 DE -1.977 6.682 0.768 -0.238 0.157 0.132 LEVERAGE -108.195 * 58.822 0.071 -0.287 1.138 0.801 SIZE 5.107 ** 2.496 0.045 0.311 *** 0.089 0.001 Sample size 234 234 System Weighted R2 0.346 0.215
Panel C Dependent Variable: Value 3-Stage Least Squares
Taiwan USA
Standar
d Standard
Coefficient Error p-vlue Coefficient Error p-vlue Intercept -1.595 1.564 0.312 -1.912 1.829 0.297 COMP -1.853 ** 0.872 0.038 -1.852 1.667 0.268 INSIDER 0.072 0.059 0.230 0.593 *** 0.206 0.004 COMPLAG 2.008 ** 0.834 0.019 1.691 1.507 0.263 RET 0.008 0.007 0.265 0.008 * 0.005 0.078 G_RD 8.077 12.475 0.520 2.225 * 1.320 0.093 CAPEXP 0.125 0.100 0.215 -0.005 0.085 0.949 G_MBE -291.793 330.795 0.381 0.283 *** 0.037 <.0001 MVE 0.009 0.214 0.968 0.566 *** 0.123 <.0001 SIZE -0.172 0.241 0.478 -0.491 *** 0.133 0.000 Sample size 234 234 System Weighted R2 0.346 0.215
COMP: executive total compensation; INSIDER: insider ownership; VALUE:
corporate value; COMPLAG: executive total compensation with one period lag; ROA: return on assets; RET: 1-year market return; G_RD: R&D; CAPEXP: capital
expenditure; G_MBE: market-to-book equity ratio; DE: total liability over
stockholders’ equity; MVE: market value of equity; LEVERAGE: long-term liability over total assets; SIZE: firm size.
Asterisks indicate significance at 0.01 (***), 0.05 (**), and 0.10 (*) levels, two-sided test.
計畫成果自評 甲、研究內容與原計畫相符程度: 本計畫確實依原計畫提案執行完成。 乙、達成預期目標情況: 百分之百完全達成預期目標。 丙、研究成果之學術或應用價值:此一研究依理論基礎比較台灣與美國之情況, 深具有學術價值。 丁、是否適合在學術期刊發表:由於具有學術價值,將投在學術期刊發表 戊、主要發現或其他有關價值等,作一綜合評估:本研究發現之前尚未發現而同 時存在台灣與美國的現象,即主管酬勞與內部持股有互為內生的關係,對文 獻為一大貢獻。