行政院國家科學委員會專題研究計畫 成果報告
國際交叉上市之直接障礙與間接障礙:以因果網及 GARCH 網
檢定市場整合
計畫類別: 個別型計畫 計畫編號: NSC91-2416-H-002-041- 執行期間: 91 年 08 月 01 日至 92 年 07 月 31 日 執行單位: 國立臺灣大學財務金融學系暨研究所 計畫主持人: 蘇永成 報告類型: 精簡報告 處理方式: 本計畫可公開查詢中 華 民 國 92 年 12 月 16 日
Direct and Indirect Barriers in International Cross-listings
Yong-chern Su
Department of Finance
College of Management
National Taiwan University
Email: [email protected]
Address: 50 Lane 144 Sec. 4 Keelung Road, Taipei, Taiwan
Abstract
In this study, we employed a time-varying GARCH model to examine direct and indirect barriers between Taiwan and the United States markets. We find that the volatility spillover effects are significant, especially in the direction of stocks to ADRs. The results indicated that the indirect barriers indeed exist between Taiwanese and the U.S. markets. We attribute indirect barriers to the different accounting standards, different level of corporate government, different level of liquidity, different level of information availability, and the business overlap. The finding is consistent with the finding of Miller (1999). However, we find that Taiwanese stocks are price leaders instead of ADR. We attribute the reason to the liquidity and availability of information of stocks in Taiwan. This is a contradiction of Domowitz, Glen, and Madhavan (1998). They argue that “From the viewpoint of domestic market-makers, there is a positive probability that the price in the foreign market reflects more recent information. This is especially so when trading activity in the ADR market greatly exceeds that of the domestic market so that price discovery essentially takes place abroad.
International capital raising has been a recent trend for global companies. On the other hand, the issue of market integration or segmentation is central to the international finance literature for decades. If international capital markets are integrated, we expected the same cost of capital without regarding to the raising sources. However, most of the previous studies support market segmentation, e.g. Foerster and Karolyi (1993) argue that although many markets with similar culture, business practices and important economics ties, there are still some degree of segmentation.
There is a common belief in financial literature that there is a variety of investment barriers among international capital market. Miller (1999) defines two types of barriers, direct barriers (e.g., legal regulation, such as ownership restrictions, different tax regimes, or government-imposed restrictions on foreign exchange and capital) and indirect barriers (e.g., accounting standards, liquidity risk, and information asymmetry or investor recognition). These barriers put international capital markets into segmentation and investors in different countries face different opportunity sets of domestic and foreign securities. Investors who trade in segmented markets spend more on transaction and information costs than those who trade in integrated markets. Therefore, the idea of dual listing comes in. Dual listings mitigate these barriers and make it possible to flow capital among markets.
Taiwanese companies have been taking advantage of international capital raising through Deposit Receipts since 1992. There have been six Taiwanese firms issuing ADR up to now. Under the “law of one price” principle, the prices of Depositary Receipts and their underlying shares should be the same, not only are they issued by the same company but also the same right and obligation they represent. They should have the same response to a random shock. Many researches find that the average
prices of Depositary Receipts are usually higher than those of their underlying shares. The empirical results support the existence of direct or indirect barriers between markets. However, previous studies have not yet considered these issues about which direct or indirect barriers emerge between markets, and how serious the direct or indirect barriers influence the speed and the degree of return and volatility transmissions.
The major purpose of this study is as follow. First, we want to examine the equity markets integration between the U.S. and Taiwan in firm level. Our empirical findings suggest market segmentation between the U.S. and Taiwan exists, which is consistent with most of previous literatures. Secondly, we explore the integration between the U.S. and Taiwan, in firm level. The interesting finding is that underlying stock is the price leaders in the relation of ADR. It implies that the information availability dominances large market leading small market effect, which is a contradiction of Domowitz, Glen, and Madhavan (1998). They argue that “From the viewpoint of domestic marketmakers, there is a positive probability that the price in the foreign market reflects more recent information. This is especially so when trading activity in the ADR market greatly exceeds that of the domestic market so that price discovery essentially takes place abroad.” Finally, we intend to measure the contagion effect by direct and indirect barriers through a time-varying GARCH (1, 1)-MA (1) model. We document that both direct and indirect barriers indeed exist between the United States and Taiwan, which partially support Miller (1998)’s findings that the indirect barriers in the emerging markets are significant, but the direct barriers in these markets are insignificant.
The rest of this paper is organized as follows. Sec. I is literature review. Data and methodology are presented in section II. Sec III elaborates empirical findings of
indirect and direct barriers. We also discuss market integration and segmentation in this section. Section IV concludes.
I. Literature
Review
ADR was developed by JP Morgan in 1927. U.S. depositary banks hold the overseas securities in custody in the country of origin and convert all dividends and other payments into U.S. dollars to receipt holders in the United States. Investors, therefore, bear all currency risk and indirectly pay fees to the depositary bank. Each depositary receipt denotes shares that represent a specific number of underlying shares in the home market, and new receipt can be created by the bank for investors when the requisite number of shares is deposited in their custodial account in the home market. Cancellation or redemption of ADRs simply reverses the process. As of 2002, about 1300 non-U.S. companies have listed their shares for trading on the New York Stock Exchange (NYSE), the American Exchange (AMEX), the National Association of Securities Dealers’ Automation Quotation (NASDAQ) system, or over-the-counter (OTC), which represents a seventy five percent increase since 1991. There have been forty three Taiwanese Depositary Receipts issued, among them six are ADRs and the others are GDRs.
There have been tons of ADR papers in financial literatures. Alexander et al. (1988), Forester and Karolyi (1993), Booth and Johnston (1984), Jorion and Schwartz (1986), Mittoo (1992), and Karolyi (1992) have directly or indirectly empirically examined the extent of integration within the North American markets. Most of these studies surprisingly found the evidence of segmentation over the early 1980s.
Foerster and Karolyi (1993) studied whether the extent of economic and financial market integration (or segmentation) between a firm’s home country and its
listing country would influence stock prices’ reactions by examining the case of two similar countries: the U.S. and Canada. They conclude that the financial markets between U.S. and Canadian are segmented and industry-related factors may affect the degree of segmentation. But they support Booth’s (1987) explanation that the different segmenting effect was because of the different tax policies which implemented on the different industries.
Domowitz, Glen, Madhavan (1998) explored the Mexican stock market, and they found the impact of cross-listing is complex-balancing the cost of order migration against the benefits of increased inter-market competition. These effects are exacerbated by equity investment barriers that induce segmentation of equity markets. Consequently, the benefits and costs of cross-listing are not evenly over all classes of shareholders.
Foerster and Karolyi (1999) studied further the stock price performance and the changes in risk exposure associated with the cross-listing of non-U.S. stocks on U.S. markets. They concluded that their evidence generally consistent with the market segmentation hypothesis and Merton’s (1987) investor recognition hypothesis.
How to measure the process of market integration? How to test the equilibrium models of risk sharing? How to measure the growth affects of market integration? A prerequisite to these questions is the date that a market becomes integrated. One of the potential solutions to this problem is to specify a tightly parameterized model of the process of dynamic integration. For example, Bekaert and Harvey (1995) used a regime-switching framework to model gradual changes in market integration. However, these models are different to specify and are often statistically rejected. Another alternative approach is proposed by Bai et al. (1998) to find endogenous
break points for the VAR parameters. He did not take a stand on an asset pricing model, but simply assumed that the variables before and after market integration follows a stationary process that was well described by a vector autoregression (VAR). Bekaert, Harvey, Lumsdaine (2001) adopted the methodology which was developed in Bai et al. (1998). Hamao, Masulis, and Victor Ng (1990) studied the short-term relations among security prices across three major stock markets: Tokyo, London, and New York. They found that unexpected changes in foreign market indices are associated with significant spillover effects on the conditional mean of the domestic market for both open-to-close and close-to-open returns.
Miller (1999) argue that barriers are due to government-imposed restrictions on foreign exchange and capital, legal barriers such as ownership restrictions, different tax regimes and indirect barriers due to differences in information access to foreign securities. He documented that the influence of indirect barriers is stronger in emerging markets given that emerging economies typically have less liquidity, less investor recognition, and fewer disclosure requirements than developed markets. However, we find that direct barriers did not impact returns significantly in Miller’s setting. He explained the different outcomes of direct and indirect barriers with two possible explanations. One explanation is that indirect barriers are the dominant factor in segmented markets. An alternative explanation is that the proxy for direct barriers in his study is misspecified. Moreover, he also found that the increase in DR programs has been particularly large among firms in emerging markets, where direct and indirect barriers to capital flows can be most acute.
Forbes and Rigobon (2002) tested if contagion exists after correcting the bias arises from heteroskedasticity. However, they found that contagion only exists under the conditional correlation coefficient. But when this unconditional correlation is used
in the tests for contagion, there is virtually no evidence of a significant increase in cross-contagion, there is virtually any evidence of a significant increase in cross-market correlation coefficients during the 1997 East Asian crisis, 1994 Mexican peso devaluation, and 1987 U.S. stock market crash. These results can be interpreted as evidence that there was no contagion during these three periods.
Generally speaking, most studies inferred that the international stock markets are segmented not integrated. Simultaneously, some studies arrived at the conclusion that there is a tendency of moving from segmentation to integration. Furthermore, these models predicted that cross-listing shares between two segmented markets lead to a higher equilibrium market price for a given stock and lower expected return.
Cross-listing could let a firm access to more investors. Furthermore, access to more investors could lead to higher volume, and there could be exchange-specific reasons why transaction costs might be lower in the US than in the home country. A decrease in transaction costs just is another channel through which a cross-listing might decrease a firm’s cost of capital. Tinic and West (1974), Foerster and Karolyi (1998), Domowitz et al. (1998), and Smith and Sofianos (1997) all examined the effect of cross-listing in the US on the costs of transacting a particular securities. These papers generally found that spreads decrease and trading volume increases following a cross-listing, both of which will likely reflect an increase in liquidity.
In the model of Cantale (1997) and Fuerst (1998), stock prices rise when firms list on exchanges with higher disclosure standards. The idea is that cross listing commits managers to a policy of better disclosure and hence reduces managers’ expected future private benefits. The empirical results of Moel (1999), Huddart et al. (1999), and Pagano et al. (2001) were also consistent with a model in which firms’
cross-list as a way of bonding themselves to subsequent information releases.
Domowitz, Glen, and Madhavan (1998) brought up three levels of transparency and the effect of order flow after cross-listing, and we summarize them as follows. If two markets were integrated, information on prices and quotes in both markets would be freely available at all times because of the perfect quotation transparency. In this case, cross-listing will induce investors who would not enter the domestic market for the reason that they face higher entry cost before cross-listing to gather information and enter the foreign market after cross-listing. With more investors participating the trading, more efficient aggregation of investor beliefs occurs and more analysts who gather additional information entry. At last, cross-listing improves the quality of both markets in the condition of market integration. Moreover, order flow after cross-listing in this case has no economic impact on security prices because that the geographic distribution of trading volume is irrelevant with the prices of securities.
Fragmentation is opposite to market segmentation, that is, markets are not informationally linked. In this case, there would be fewer participants in domestic market if it’s cheaper to trade in the foreign country and the diversion of order flow abroad results in less efficient prices and lower market quality in the domestic market. At the same time, the decrease in trading intensity should increase spreads and volatility in the domestic market. Therefore, order flow will lower the quality of the domestic market in this case.
This study is focus on direct and indirect barriers effects on return and volatility transmissions. We put capital inflow and outflow between markets into short term return transmission because of market efficiency. However, accounting standards or financial systems changes represent long term shocks which are persistent.
II. Data and Methodology
We examine information transmissions between ADR and underlying stock in the U.S. and Taiwan from January 1, 2002 through December 31, 2002. We have six ADRs and one TDR. They are Taiwan Semiconductor Manufacturing Company Ltd(TSMC), United Micro Corporation(UMC), Advanced Semiconductor Engineering Inc.(ASE), Macronix International Co.,(MI), Siliconware Precision Industries(SPI), AU Optronics Corp.(AUO), and ASE TEST Ltd. The data used in this study were obtained from Yahoo and the Taiwan Economic Journal (TEJ) database. We handle non-synchronous trading in consistent with Hamao, Masulis and Ng (1990). In order to study the effect of direct and indirect barrier on stock return, we employ GARCH (1,1)-MA (1) model.
Model Ⅰ- Volatility Spillover Model:
t t t MA R =α− ×ε −1 +ε 1 1 1 − − − + + + = t t t t A Bh C SX h ε
where, R : the daily returns of a market in period t, t
h : the conditional variance in period t, t
h -1: the conditional variance in period t-1 t
Xt−1: the square residuals jointly estimated from a GARCH (1, 1)-MA (1) of
another market in period t-1 α, MA, A, B, C and S are coefficients
Model Ⅰis designed to study volatility spillover. They are mostly from indirect barriers, such as accounting or financial systems.
Model Ⅱ- Mean Spillover Model: 1 1 − − + + × − = t t t t MA Y R α ε ε φ 2 1 1 − − + + = t t t A Bh C h ε
where, Rt: the daily returns of a market in period t,
ht: the conditional variance in period t,
ht−1: the conditional variance in period t-1
Yt−1: residuals jointly estimated from a GARCH (1, 1)-MA (1) of another
market in period t-1
α, MA, A, B, C andϕ are coefficients
Model examines the mean spilloverⅡ . They are mostly from direct barriers, such as control of cash-flows in or out.
III. Empirical Results
3.1 Indirect Barriers
We find that the volatility spillovers are significant in most cases when we investigate effects from stocks to ADRs. However, the volatility spillover effects from ADRs to stocks are insignificant. When we examine returns of ADRs to stocks, we could not reject the null hypothesis of indirect barriers. On the other way, when we examine stocks on ADRs, we reject the null. Basically, we support Miller’s argument that the indirect barriers exist between countries. Then, we dig out the reason why different results about the two way volatility spillover. We generalize several indirect barriers between Taiwan and U.S. equity markets as follows.
(1) Different Accounting Standards
The U.S. set a higher accounting standard than Taiwan does. This difference in accounting standards of Taiwan and U.S. makes Taiwanese companies, such as TSMC face two different accounting standards. Changes of the U.S. accounting standards have impacts on returns and volatility of underlying stocks in Taiwan. Our empirical study isolates the systematic risk of U.S. market by taking ADRs residuals. The impact of accounting standard, i.e. indirect barriers on underlying stocks in Taiwan is measured by coefficients of mean and volatility equations in our GARCH models. We find that standards changes play a role in long memory volatility spillovers.
(2) Different Level of Corporate Governance
Corporate governance has been a popular issue since Enron and WorldCom scandals. The CEO of Taiwan Semiconductor Manufacturing Company Ltd. had mentioned that the boards of directors, usually the family members or close friends, in Taiwan are merely meretricious. The protection of minority shareholders is weaker in Taiwan than that in the United States. Reeze and Weisbach(2002) have the pioneer study on corporate governance and cross-listing. However, after the enforcement of independent direct system, Taiwan Semiconductor Manufacturing Company Ltd. invited three outstanding independent directs, including Lester Carl Thurow、Michael E. Porter and Peter Leahy Bonfeild. We argue that different level of corporate governance explain long memory volatility spillovers between ADR and stock.
(2) Different Level of Liquidity
NYSE or NASDAQ is more liquid than Taiwan Stock Exchange in terms of trading volume and recognition of international investors. Financial theory predicts
that a liquid market has a better price discovery ability. The more participants in market, the more liquid the market is. Therefore, we have a priori that volatility spillover from the ADR to stock is significant. However, what surprises us is that volatility spillover is more significant from the stock to ADR. We contribute the reason to the higher trading volume of stock in Taiwan than those in ADR. We document an idiosyncratic stock dominance in stock and ADR relation. Our empirical findings suggest that volatility spillover effects from stocks to their ADRs are stronger than those of the reverse direction because of the larger trading volume of individual stock.
(4) Information Availability
If the indirect barriers indeed existed between the Taiwan and the U.S. stock markets, the information availability of these samples except the TDR would be easier and cheaper in Taiwan than in the United States. As we expected, the volatility spillover effects from the returns of Taiwanese underlying stocks to ADRs are significant. It also explains why the volatility spillover effects from most stocks to their ADRs are much more significant than those of the reverse direction. It also implies that stocks are the price discover. This is a contradiction of Domowitz, Glen, and Madhavan (1998). They argue that “From the viewpoint of domestic market-makers, there is a positive probability that the price in the foreign market reflects more recent information. This is especially so when trading activity in the ADR market greatly exceeds that of the domestic market so that price discovery essentially takes place abroad.”
(3) Business Overlap (Level of Liquidity)
stocks were in the same industry, then investors would invest one of them or invest both with one less. On the other hand, we recognize that larger corporations have the advantage in selection process. Our empirical findings support that only Macronix International Co., Ltd. and AU Optronics Corp. are independent investing targets. We find that only the test of Macronix International Co., Ltd. is significant in the direction of ADRs to stocks. We conclude that business overlap is one of the possible explanations.
We summarize several interesting findings in our indirect barriers investigation. First, these t-values ofβ are significant in our tests of volatility spillover effects. The outcome is consistent with many previous studies which indicated that stock series are conditionally heteroskedastic. Therefore, our study approves that stock price of T period is highly correlated with the price of T-1 period. Secondly, the strong evidence of the existence of indirect barriers which is consistent with the conclusion of Darius P. Miller (1998). Third, we can derive from the different degree of the volatility spillover effects between stocks to ADRs and the reverse direction. It implies that stock is the informational leader instead of ADR.
3.2 Direct Barriers
We find that the mean spillover effects are significant in both directions. It implies that the direct barriers indeed exist between Taiwan and U.S. markets. We listed the following reasons.
(1) Law concerning about QFII or GFII and the upper limit of Foreign Investments in Taiwan
market to the foreigners in Table 3-3. We conclude that capital inflows are restricted in Taiwan. Restrictions on capital flows play a role in short term return transmission because of market efficiency.
(2) Different Tax Regimes (Industry Effect)
Taiwanese companies which issued American Depositary Receipts are endowed with favorable tax rates. According to section five of Hi-tech Strategic Industry Subsidy Regulation, IC and TFT-LCD are among them. According Foerster and Karolyi (1993) and Booth’s (1987), segmenting effect was because of the different tax policies on different industries.
(3) Foreign Exchange Regulations
Taiwan Central Bank had abandoned the Appointed Banks Foreign Exchange Trade Regulation since 1989. Individuals and corporation have upper limits of US$5 million dollar and US$50 million dollar, respectively. We believe that capital flows are restricted in some way. The limits are expected to be eliminated in the future.
3.3 Integration or Segmentation
Our empirical findings support that Taiwan and U.S. stock markets are segmented instead of integration. We attribute the segmentation to direct and indirect barriers discussed above. Furthermore, we examine spillover of U.S market to Taiwanese stocks. Among our samples, the ADRs of TSMC, UMC, ASE and AUO are listed on NYSE and the remainders are traded on NASDAQ. Therefore, we use the NYSE composite to investigate spillover of U.S market to TSMC, UMC, ASE and AUO and use NASDAQ 100 to examine the remainders. We found that most of
volatility spillover effects are insignificant except TSMC and UMC, while on the mean spillover, all are significant. It indicates that the surprised shock of U.S. market indeed affect stock in Taiwan. According to the hypotheses of liquidity and investor recognition, we expect volatility spillover effect from the ADR to stock is significant. However, we found that the volatility spillover effects are only significant in TSMC and UMC. The possible explanation is that TSMC and UMC are the most wide-held Taiwanese ADRs in the United States.
IV. Conclusion
In this study, we found that the volatility spillover effects are significant, especially in the direction of stocks to ADRs. The results indicated that the indirect barriers indeed exist between Taiwanese and American markets. We attribute indirect barriers between Taiwan and the U.S. market to the different accounting standards, different level of corporate government, different level of liquidity, different level of information availability, and the business overlap. The finding is consistent with the finding of Miller (1999). However, we found that Taiwanese stocks are price leaders instead of ADR. We attribute the reason to the liquidity and availability of information of stocks in Taiwan. This is a contradiction of Domowitz, Glen, and Madhavan (1998). They argue that “From the viewpoint of domestic market-makers, there is a positive probability that the price in the foreign market reflects more recent information. This is especially so when trading activity in the ADR market greatly exceeds that of the domestic market so that price discovery essentially takes place abroad.”
References
1. Alexander, Gordon, Cheol Eun, and S. Janakiramanan, 1988, “International Listings and Stock Returns: Some Empirical Evidence”, Journal of Financial and Quantitative Analysis, 135~P.151
2. Bekaert, Harvey, C.R.; Lumsdaine, R.L. (2002) “Dating the Integration of World Equity Markets”, Journal of Financial Economics, .65, 203~247
3. Bollerslev, T. (1986) “Generalized Autoregressive Conditional Heteroskedasticity” Journal of Econometrics, 31, 307~327
4. Bollerslev, T.; Engle, R. F. and Wooldridge J. M.(1988) “A Capital Asset Pricing Model with Time Varying Covariances”, Journal of Political Economy, 96, 116~131
5. Bollerslev, T; Chou, R.Y.; and Kroner, K.F.(1992) “ARCH Modeling in Finance”, Journal of Econometrics, 52, 5~59
6. Domowitz, Glen, Madhavan (1997) ”Market Segmentation and Stock Prices: Evidence from an Emerging Market”, 52, 1059~1083
7. Domowitz, Glen, Madhavan (1998) “ International Cross-Listing and Order Flow Migration: Evidence from an Emerging Market”, The Journal of Finance, 53, 2001~2027
8. Engle, R. F.(1982) “Autoregressive Conditional Heteroskedasticity with Estimates of the Variance of United Kingdom Inflation”, Econometrica, 50, 987~1008 9. Engle, R. F.(1982) “A General Approach to Lagrange Multiplier Model
Diagnostics”, Journal of Economics, 20, 83~104
10. “Depositary Receipts (ADRs and GDRs)---2002 Year-End Market Review” ,The Bank of New York
11. Foerster S.R., Karolyi G.A. (1993) “International Listing of Stocks: The Case of Canada and the U.S.”, Journal of International Business Studies, Fourth Quarter.
12. Foerster, M.M., T.J. George (1996) “Pricing Errors at the NYSE Open and Close: Evidence from Internationally Cross-listed Stocks”, Journal of Financial
Intermediary, 95~126
13. Foerster S.R., Karolyi G.A. (1999) “The Effects of Market Segmentation and Investor Recognition on Asset Prices: Evidence from Foreign Stocks Listing in the United States” The Journal of Finance, 54, 981~1013
14. Forbes, K.J., Rigobon (2002) “No Contagion, Only Interdependence: Measuring Stock Market Comovements”, The Journal of Finance, 7, 2223~2261
15. Kodres L.E., Pritsker (2002) “A Rational Expectations Model of Financial Contagion”, The Journal of Finance, 57, 769~799
16. Lang, Lins, Miller (2002) “ADRs, Analysts, and Accuracy: Does Cross Listing in the U.S.: Improve a Firm’s Information Environment and Increase Market
Value?” , The Bank of New York
17. Miller, D.P. (1999) “The Market Reaction to International Cross-listings: evidence form Depositary Receipts”, Journal of Financial Economics, 51, 103~123
18. Mittoo, U.R. (1992) ” Additional Evidence on Integration in the Canadian Stock Market”, The Journal of Finance, 47, 2035~2054
19. “Solving the ADR Puzzle: The Expert Guide to Building a Successful ADR Program”, The Bank of New York
20. William A. Resse Jr., Michael S. Weisbach (2002) “Protection of Minority Shareholder Interests, Cross-listings in the United States, and Subsequent Equity Offerings”, Journal of Financial Economics, 66, 65~104
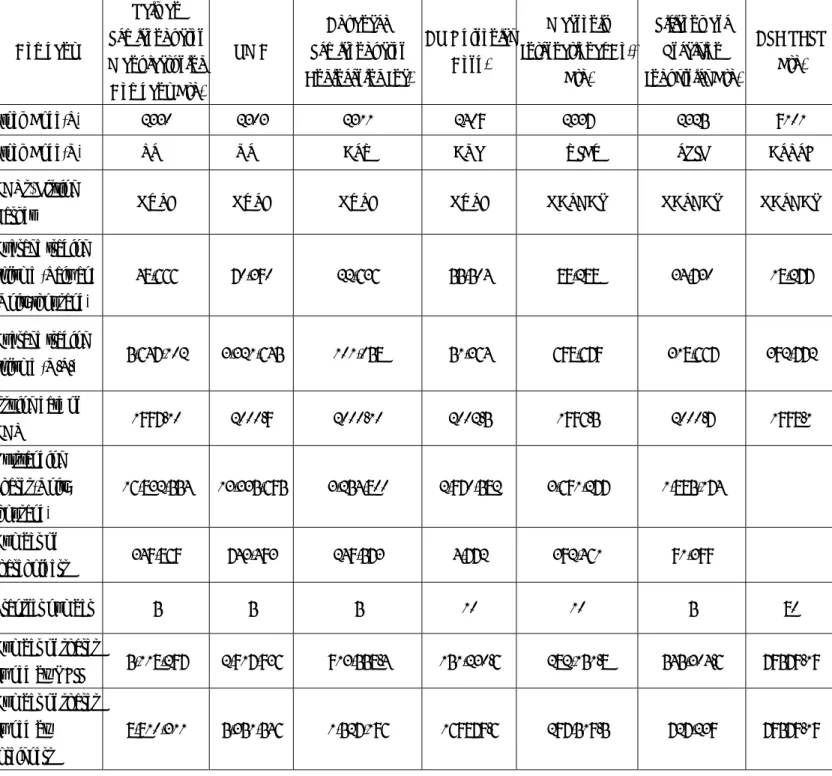
Table 1.1 Sample basic statistics Company Taiwan Semiconductor Manufacturing Company Ltd. UMC Advanced Semiconductor Engineering Inc. AU Optronics Corp. Macronix International Co., Ltd. Siliconware Precision Industries Ltd. ASE TEST Ltd. Stock Code(T) 2330 2303 2311 2409 2337 2325 9101
Stock Code(U) TSM USM ASX AUO MXICY SPIL ASTSF
ADRs' Listing
market NYSE NYSE NYSE NYSE NASDAQ NASDAQ NASDAQ
Average trading volume (Taiwan) (Unit: thousand) 48,666 70,390 22,636 55,504 89,288 34,730 18,277 Average trading volume (U.S.) 5,647,102 3,321,645 101,058 51,364 698,679 318,667 392,772 Issuing date of ADR 1997.10 2000.9 2000.10 2002.5 1996.5 2000.7 1998.1 Outstanding Shares(Unit: thousand) 16,832,554 13,335,695 3,254,800 2,970,582 3,691,277 1,885,174 Number of shareholders 349,869 743,493 249,573 4,772 392,461 91,399 Transfer number 5 5 5 10 10 5 80 Number of shares owned by QFII 5,118,297 2,917,936 913,558.4 151,230.6 282,151.8 545,304.6 79579.19 Number of shares owned by foreigners 8,810,311 5,351,546 1,527,196 169879.6 297,519.5 727,239 79579.19
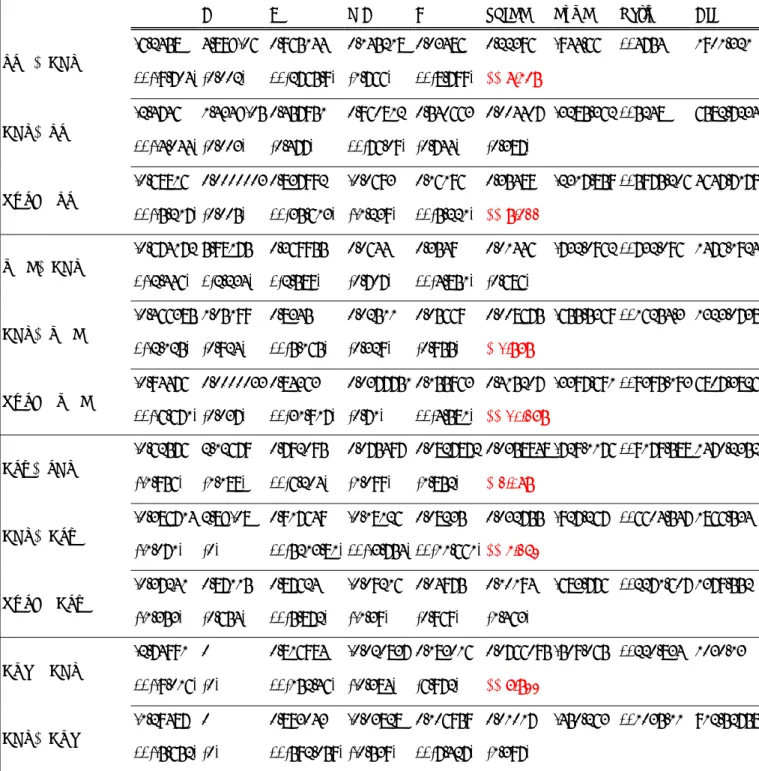
Table 3.1 Estimates of Volatility Spillover
t t
t MA
R =α− ×ε −1 +ε , ht = A+Bht−1 +Cεt−1 +SXt−1, where, Rt: the daily returns
of a market in period t, ht : the conditional variance of returns in period t,
t
h -1: the conditional variance in period t-1, Xt−1: the square residuals jointly
estimated from a GARCH (1, 1)-MA (1) of another market in period t-1, α, MA, A, B, C and S: the coefficients
A B MA C SPILL Log L Ratio AIG
-6.2458 4.89E-06 0.965144 0.145218 0.03486 0.22396 -944.66 **4754 1901.321 TSMADR **(-9.704) (0.002) **(2765.9) (1.766) **(8.799) **(8.549) -2.4746 1.434E-05 0.457951 0.960812 0.540663 0.004407 -3285.362 **5248 6582.7234 ADRTSM **(-4.044) (0.003) (0.477) **(76.09) (0.744) (0.387) -0.68816 0.0000003 0.837992 -0.0693 0.16196 0.35489 -2317.859 **5975.206 4647.7179 NYSE→TSM **(-5.217) (0.005) **(35.613) (-1.239) **(5.221) **(9.422) -0.674172 5.98175 0.369955 0.0644 0.3549 0.01446 -732.0962 **732.096 1476.1924 UMCADR *(-2.446) *(2.234) *(2.589) (0.707) **(4.851) (0.686) -0.466385 1.05199 0.8345 0.02511 0.05669 0.008675 -655.5369 **16254.3 1323.0738 ADRUMC *(-2.125) (0.924) **(5.165) (0.329) (0.955) *(1.979) -0.94476 0.0000033 0.84363 0.0377751 0.155963 0.415207 -3397.691 **9395.193 6807.3826 NYSE→UMC **(-6.671) (0.037) **(31.917) (0.71) **(4.581) **(10.279) -0.62576 2.12679 0.792095 0.075497 0.0827872 0.0358848 -729.1176 **9179.588 1470.2352 ASXSDR (-1.956) (1.188) **(6.204) (1.099) (1.852) *(2.089) -0.386714 2.8E-08 0.917649 -0.18126 0.08235 0.032755 -927.267 **6604.547 1866.534 ADRASX (-1.071) (0) **(5213.81) **(-3.754) **(11.661)**(5.263) -0.37241 0.87115 0.87624 -0.09216 0.04975 0.10194 -683.776 **2271.607 1379.552 NYSE→ASX (-1.353) (0.654) **(5.872) (-1.39) (0.969) (1.463) -2.74991 0 0.816984 -0.020837 0.183016 0.0766095 -509.065 **220.834 1030.13 AUO ADR **(-9.016) (0) **(152.46) (-0.384) (6.972) **(7.933) -1.29487 0 0.893043 -0.03828 0.106959 0.01017 -450.263 **1035.11 912.52758 ADRAUO **(-5.652) (0) **(592.059) (-0.539) **(7.427) (1.397)
-0.6690 0.3338 0.84859 0.02744 0.15114 -0.04682 -482.6839 **2829.405 977.36675 NYSE→AUO (-1.561) (0.927) **(65.272) (0.244) **(11.553) (-0.482) -5.26578 0.00002 0.90714 -0.473 0.031 0.114837 -829.8611 **1174.32 1671.72 MXICY ADR **(-10.16) (0.001) **(956.62) **(-9.28) *(2.146) **(6.37) -0.16869 0.0913 0.9925 -0.2087 0 -0.01059 -682.833 **20207.55 1377.67 ADRMXICY (-0.582) (0.06) **(7.449) **(-3.28) (0) **(-2.631) -0.59924 0.00002 0.94394 -0.1684 0.05595 -0.01196 -728.986 **4129.376 1469.972 NASDAQMXICY (-3.63) (0.021) **(87.657) **(-4.347) (0.127) (-0.424) 0.36914 0 0.935006 0.05089 0.064995 -0.02805 -853.4401 **15595 1718.88 SPILADR (1.613) (0.001) **(5032.39) (1.088) **(15.002)**(-3.122) -0.39226 1.4864 0.84921 -0.12601 0.04376 0.00806 -688.326 **24645.43 1388.6523 ADRSPIL (-1.371) (0.433) **(2.941) (-1.874) (0.653) (1.364) -0.51196 0 0.8935 -0.06965 0.10653 -0.0193 -778.9718 **9667.696 1569.944 NASDAQ→SPIL *(-2.02) (0) **(682.721) (-1.151) **(9.277) (-0.659) -1.648 6.84E-07 0.832194 0.060975 0.167764 0.041995 -1109.61 **1058.899 2231.2196 ASTSFTDR **(-8.407) (0.004) **(31.511) (1.263) **(5.14) *(2.084) -0.48732 1.64229 0.709295 -0.03394 0.1193 0.00471 -653.0115 **10785.52 1318.023 TDRASTSF *(-2.272) (1.043) **(3.104) (-0.464) (1.365) **(2.692) * 5% level of significance **1% level of significance
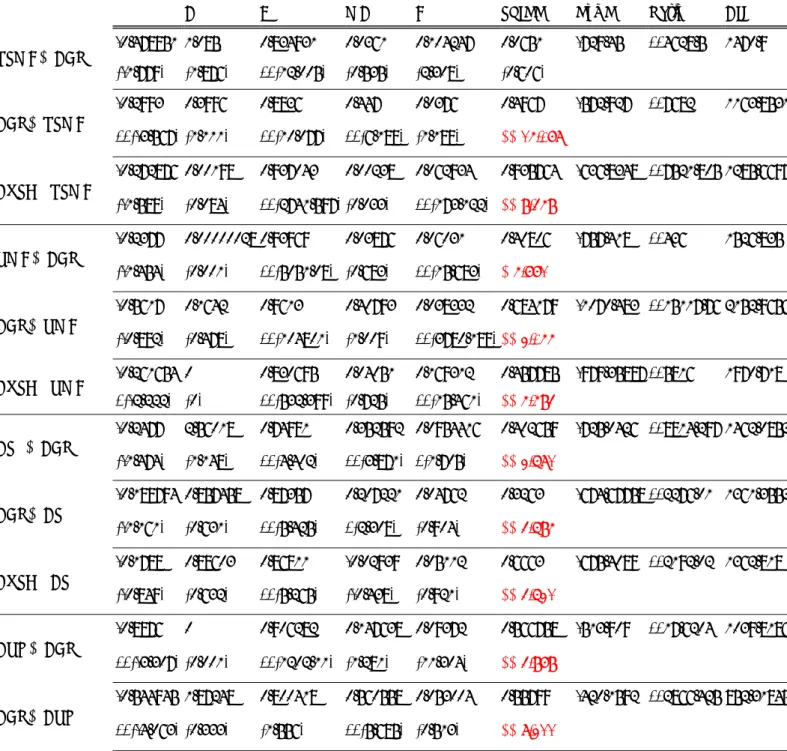
Table 3.2 Estimates of Mean Spillover 1 1 − − + + × − = t t t t MA Y
R α ε ε φ , ht = A+Bht−1 +Cεt2−1, where, Rt: the daily returns of
a market in period t, ht: the conditional variance of returns in period t, ht−1: the
conditional variance in period t-1, Yt−1: residuals jointly estimated from a GARCH (1,
1)-MA (1) of another market in period t-1, α, MA, A, B, C andϕ: the coefficients of variables
A B MA C SPILL Log L Ratio AIG
-0.478951 1.085 0.834931 0.0361 0.104247 0.0651 -729.45 **4628.5 1470.9 TSMCADR (-1.779) (1.876) **(12.005) (0.535) (2.308) (0.606) -0.2993 0.3996 0.8836 0.447 0.0376 0.4967 -572.927 **7682 1163.8531 ADRTSMC **(-3.567) (1.111) **(10.077) **(6.188) (1.188) **(15.078) -0.272876 0.00198 0.937043 0.00238 0.062934 0.935764 -636.8348 **7521.805 1285.6697 NYSE→TSMC (-1.589) (0.084) **(2741.597) (0.033) **(173.122) **(9.459) -0.2377 0.00000028 0.93969 0.03876 0.06031 0.40806 -757.418 **436 1526.835 UMCADR (-1.454) (0.001) **(5051.08) (0.683) **(15.683) *(5.771) -0.5617 0.1642 0.9613 0.40793 0.038332 0.684179 -1070.483 **15117.76 2152.9656 ADRUMC (-0.892) (0.478) **(104801) (1.009) **(3780.188)**(3.055) -0.261654 0 0.830695 0.04051 0.169312 0.457785 -979.35887 **5816 1970.718 NYSE→UMC *(-2.222) (0) **(532.399) (0.725) **(15.461) **(5.594) -0.2477 2.56018 0.74981 0.352592 0.0954416 0.402659 -725.0426 **8814.297 1462.0852 ASXADR (-1.474) (1.148) **(4.402) **(3.871) *(1.705) **(3.681) -0.189794 0.857458 0.87357 0.207221 0.04762 0.3263 -674.67758 **2276.01 1361.3552 ADRASX (-1.161) (0.631) **(5.425) *(2.308) (0.904) **(4.695) -0.1788 0.88603 0.86811 -0.02939 0.05112 0.6663 -675.4089 **2192.02 1362.818 NYSE→ASX (-0.849) (0.632) **(5.265) (-0.438) (0.921) **(4.631) -0.8876 0 0.906282 0.147638 0.09372 0.566758 -513.909 **17.6204 1039.8186 AUO A DR **(-3.307) (0.001) **(1202.11) (1.281) (11.304) **(4.979) -0.544945 1.87248 0.800418 0.560558 0.053004 0.55799 -420.1592 **2866.425 852.31845 ADRAUO **(-4.063) (0.333) (1.556) **(5.685) (0.513) **(8.311)
-0.48764 1.92182 0.82582 -0.00018 0.03505 0.77847 -431.5351 **21310.76 875.0702 NYSE→AUO (-1.538) (0.277) (1.502) (-0.002) (0.4) **(3.955) -0.317381 1.25692 0.89421 0.59991 0.025678 0.675175 -718.94931 **32783.35 1449.8986 MIXCYADR **(-3.094) (0.714) **(6.888) **(9.147) (0.735) **(9.595) -0.783041 0.000004 0.87113 -0.12981 0.12887 0.1780 -699.3764 **115.289 1410.7528 ADRMIXCY **(-4.033) (0.001) **(458.63) *(-2.167) **(9.386) **(4.147) -0.3083 1.7772 0.7543 -0.1235 00932 0.2693 -679.061 **19423.07 1370.1223 Nasdaq→MIXCY (-1.304) (0.915) **(3.508) (-1.807) (1.22) *(2.551) -0.24574 0.828898 0.92314 0.11659 0.02249 0.1818 -716.243 **15337.33 1444.4864 SPILADR (-1.113) (0.474) **(6.77) (1.19) (0.741) *(2.124) -0.225689 0.282474 0.97822 0.750013 0.00002935 0.808274 -690.4454 **2914.979 1392.891 ADRSPIL **(-3.626) -0.323 **(17.958) **(10.859) (().001) **(14.363) -0.22439 12.8415 0.005213 -0.00911 0.00062 0.59659 -691.6556 **2861.343 1395.311 Nasdaq→SPIL (-0.994) (0.019) (0) (-0.148) (0.008) **(5.501) -0.7288 1.7152 0.7924 0.02724 0.15865 -0.02773 -798.04517 **1086.233 1608.0903 ASTSFTDR *(2.316) *(2.381) **(14.783) (0.395) **(3.42) (-0.288) -0.622 0 0.903512 0.011628 0.09649 0.23398 -685.289 **421.317 1382.577 TDRASTSF **(-4.448) (0) **(1835.55) (0.2) **(12.45) **(7.801) * 5% level of significance **1% level of significance
Table 3.3 History of Taiwan capital market restrictions to the Foreigners
Date Institution Total Holding limit Individual holding limit Total amount of investment Individual amount of investment
Restriction on the flow of capital Requirement of QFII
72/05/26 SITE None 10% None None Overseas investors withdraw
investment after the fund have issued for one year at least.
80/01/02 QFII1 10% 5% US$ 2500
million
US$ 5~50 million
1. Overseas investors remit-in within three months after approving.
2. Overseas investors withdraw after at least three months’ investment.
3. remit-out one time a year.
85./3/3 GFII 1. No restrictions on foreigners live in Taiwan 2. There are restrictions to offshore foreigners: (1) USD$5 MM per person (2) USD$20MM per corporation
1. Total remit-out amount can not exceed remit-in
2. No time restriction
87/7/20 Futures trading permitted
89/3/8 immigrant and foreign remittance investment convertibl e bonds
89/12/30 Eliminate restrictions on individuals or foreigners holding
1
Requirement of QFII:
(1)Bank: total asset is ranked within 500 in the world and total equities holding need to be above US$ 300 million.
(2)Insurance company: need to operate above 10 years and hold above US$ 500 million equities. (3)Institution of fund management: establish above 5 years and manage above US$500 million fund
90/3/7 1. Extend remitting in or out time from one year to two years. 2. Cancel the cycling amount and control by registering and approving instead of cycling amount control.
90/12/24 TAIEX Options trading permitted.