國立交通大學
資訊科
學與工程研究所
碩
士 論 文
自動產生攔截控制流程之攻擊程式碼
Automated Exploit Generation for Control-Flow
Hijacking Attacks
研
究 生 : 黃博彥
指導教授 : 黃世昆 教授
自動產生攔截控制流程之攻擊程式碼
Automated Exploit Generation for Control-Flow
Hijacking Attacks
研
究 生 : 黃博彥
Student : Po-Yen Huang
指導教授 : 黃世昆
Advisor : Shih-Kun Huang
國 立 交 通 大 學
資 訊 科
學 與 工 程 研 究 所
碩
士 論 文
A Thesis
Submitted to Institute of Computer Science and Engineering
College of Computer Science
National Chiao Tung University
in Partial Fulfillment of the Requirements
for the Degree of
Master
in
Computer Science
September 2011
Hsinchu, Taiwan, Republic of China
自
自
自動
動
動產
產
產生
生
生攔
攔
攔截
截
截控
控
控制
制
制流
流
流
程
程
程
之
之
之攻
攻
攻擊
擊
擊程
程
程式
式
式碼
碼
碼
學生 : 黃博彥
指導教授 : 黃世昆 教授
國立交通大學資訊科學與工程研究所碩士班
摘
摘
摘要
要
要
由於資訊領域的快速發展與應用,各類安全威脅日趨嚴重,而這些威脅都
根源於軟體的缺陷,軟體安全性的探討因此成為重要的議題。這些議題
中,最大的威脅來自於軟體缺陷經常性地被揭露、使得駭客的攻擊事件層
出不窮,其中零日攻擊(zero-day attacks)更造成系統及經濟上的重大危害。
我們以軟體發展過程的角度分析,瞭解到安全漏洞的修補過程,是一場與
零日攻擊的時間競賽,若能儘早修補漏洞,將可大幅降低其威脅性。為了
快速掌握漏洞,我們運用在軟體測試領域中,已被廣泛研究運用、自動尋
找程式錯誤的方法。然而如何分析眾多的程式錯誤,優先尋找出安全性威
脅的漏洞,仍是一個很困難的研究領域。在此論文中,我們將轉換角色,
以攻擊者的角度來試圖產生攻擊程式碼、並將過程自動化,以此證明程式
中存在安全性漏洞。我們提出基於符號執行的軟體測試方法,實作攻擊程
式產生器,可任意攔截控制流程。此概念已實驗在多個真實的程式,證明
此方法之可行性。
Automated Exploit Generation for Control-Flow
Hijacking Attacks
Student : Po-Yen Huang
Advisor : Dr. Shih-Kun Huang
Institute of Computer Science and Engineering
National Chiao Tung University
Abstract
Due to the rapid deployment of information technology, the threats on
in-formation assets are getting more serious. These threats are originated from
software vulnerabilities. The vulnerabilities bring about attacks. If attacks
launched before the public exposure of the targeted vulnerability, they are
called zero-day attacks. These attacks usually damage system and economy
seriously. We have analyzed the process of zero-day attacks in the
perspec-tive of software process and recognize that it is a race competition between
attacks and software patch development and deployment. If developers can
fix the vulnerabilities as soon as possible, the threats will be significantly
reduced. In order to faster the vulnerability finding process, we use the
soft-ware testing techniques, focusing on finding bugs automatically. However,
it is still hard to locate security vulnerabilities from a large number of bugs.
In our paper, we switch to the roles of attackers and aim at generating
at-tacks automatically to prove that a bug is a security vulnerability. Based
on symbolic execution, we are able to automatically generate exploit for
control-flow hijacking attacks and perform several experiments with
real-world programs to prove our method is feasible.
誌
誌
誌
謝
謝
謝
考研究所是臨時的決定,重考更是一意孤行,感謝家人的諒解與支持,尤
其是父母一路上的加油打氣,以及爺爺和奶奶在我每個星期往返學校前的
窩心叮嚀
,一直是我求學期間的最大精神支柱,讓我得以開開心心、無憂
無慮的渡過研究生生涯。
再者,感謝我的指導老師黃世昆教授,帶領我一起研究與探討軟體安
全這個我以前鮮少接觸的領域,並提供豐富的資源讓我得以從中發揮。除
了對於生活、課業與研究上的時常關心外,並不時肯定我的表現,對於沒
什麼自信的我來說更是莫大的鼓勵。
另外就是研究所這兩年中,每天一起在實驗室相處的各位同學,感謝
佑鈞與世欣作為我的榜樣,帶領我了解研究生的生活。感謝孟緯從一開始
的暑假至今,一起修課、當助教、作研究...等,很高興我們也一起畢業了。
還
有翰霖、奕任、俊維、偉明、基傑、韋翔與鈺婷,大家一起相處的每一
天,是我最重要的研究所回憶。
最後,感謝田筱榮老師、孔崇旭老師與宋定懿老師在百忙之中抽空對
此論文的細心指導與建議,讓其更臻完美。時光飛逝,研究所兩年的時光
一下就過去了,感謝所有一路上幫助過我的人們,謹以此論文,獻給你
們。
Contents
摘 摘 摘要要要 i Abstract ii 誌 誌 誌謝謝謝 iii Contents iv List of Listings viList of Figures vii
List of Tables viii
List of Algorithms ix 1 Introduction 1 1.1 Motivation . . . 1 1.2 Objective . . . 2 1.3 Overview . . . 2 2 Background 3 2.1 Software Testing . . . 3 2.1.1 Fuzz Testing . . . 3 2.1.2 Symbolic Execution . . . 4 2.1.3 Concolic Testing . . . 5 2.2 Software Security . . . 7
2.2.1 Vulnerability and Exploit . . . 7
2.2.2 CPU Architecture and Operating System . . . 7
2.2.2.1 Stack and Heap . . . 8
2.2.3 Software Vulnerabilities . . . 10
2.2.3.1 Stack Buffer Overflow . . . 10
2.2.3.2 Off-by-one Overflow . . . 10
2.2.3.3 Heap Buffer Overflow . . . 10
2.2.3.4 Uninitialized Variable . . . 10
2.2.3.5 Format String . . . 11
2.2.4 Protection Mechanisms . . . 12
2.3 Related Work . . . 13
2.3.1 Symbolic Execution and Constraint Solving . . . 13
3 Method 15
3.1 The Weakness of AEG . . . 15
3.2 The Used Tool and Intuitive Idea . . . 16
3.3 Our Method . . . 18
3.3.1 EIP Register Corrupted Detection . . . 18
3.3.2 Exploit Generation . . . 19
3.3.2.1 Shellcode Injection . . . 19
3.3.2.2 Nop Sled and Exploit Generation . . . 20
3.3.3 Pointer Corrupted Detection . . . 20
3.4 Path Selection . . . 21
3.4.1 Concolic-mode Simulation . . . 21
3.4.2 Code Selection . . . 22
4 Implementation 24 4.1 Register Corruption Detection . . . 24
4.2 Exploit Generation . . . 27
4.2.1 Memory Model in S2E . . . 27
4.2.2 Finding Symbolic Memory Blocks . . . 27
4.2.3 Shellcode Injection . . . 28
4.2.4 NOP Sled . . . 30
4.2.5 Other Types of Exploit . . . 33
4.2.5.1 Return-to-libc . . . 33
4.2.5.2 Jump-to-register . . . 34
4.3 Pointer Corruption Detection . . . 35
4.4 Concolic-mode Simulation . . . 35
4.5 Code Selection . . . 37
5 Experimental Results 38 5.1 Testing Method and Environment . . . 38
5.2 Sample Code . . . 39
5.3 Other Types of Exploits . . . 40
5.4 Real-world Programs . . . 42
6 Conclusion and Further Work 44 6.1 Conclusion . . . 44
6.2 Further Work . . . 45
References 48 Appendices 49 A Sample Code and Exploits 49 A.1 Shellcode . . . 49
A.2 Stack Buffer Overflow Vulnerability . . . 49
A.3 Heap Buffer Overflow Vulnerability . . . 51
A.4 Off-by-one Buffer Overflow Vulnerability . . . 52
A.5 Uninitialized Variable Vulnerability . . . 53
List of Listings
1 An example code for software testing . . . 5
2 Function prologue . . . 9
3 Function epilogue . . . 9
4 The macro of unlink operation . . . 11
5 An example code for AEG . . . 16
6 An example code for rearranging variables . . . 18
7 An example code for pointer corruption . . . 21
8 The structure of CPUX86State . . . 25
9 The code of registerCPU() function . . . 26
10 The used shellcode . . . 49
11 A sample code for stack buffer overflow vulnerability . . . 49
12 A return-to-stack exploit for Listing 11 . . . 50
13 A return-to-libc exploit for Listing 11 . . . 50
14 A jump-to-register exploit for Listing 11 . . . 50
15 A sample code for heap buffer overflow vulnerability . . . 51
16 An exploit for Listing 15 . . . 51
17 A sample code for off-by-one buffer overflow vulnerability . . . 52
18 An exploit for Listing 17 . . . 52
19 A sample code for uninitialized variables vulnerability . . . 53
20 An exploit for Listing 19 . . . 53
21 A sample code for format string vulnerability . . . 54
List of Figures
1 The symbolic execution tree of Listing 1 . . . 5
2 The process of concolic testing on Listing 1 . . . 6
3 The relationship between exploits and input space . . . 7
4 Memory layout in Linux . . . 8
5 The layout of stack frame . . . 8
6 Heap layout in Linux . . . 9
7 Heap layout after a chunk is free . . . 9
8 The example process of uninitialized variable vulnerability . . . 11
9 The memory layout before and after reverse() is executed . . . 16
10 The architecture of S2E . . . 17
11 The process of our exploit generation . . . 19
12 An example for input constraints . . . 22
13 The process of concolic-mode simulation with fuzzer tools . . . 22
14 An execution tree with code selection . . . 23
15 The process of ret instruction translation in QEMU . . . 25
16 The structure of ObjectState object . . . 27
17 The process of searching symbolic blocks . . . 29
18 The process of NOP sled . . . 31
19 The process of determining where EIP register point to . . . 32
20 The process of return-to-libc exploit generation . . . 33
21 The process of jump-to-register exploit generation . . . 34
22 The process of concolic-mode simulation . . . 36
23 An example for code selection . . . 37
24 A return-to-stack exploit is used in executable and non-executable stack . . . . 41
25 A return-to-libc exploit bypasses non-executable stack in Debian 5 . . . 41
List of Tables
1 The differences between KLEE and S2E . . . 17
2 The differences among Stack, Heap, and Data segment . . . 20
3 The differences between return-to-memory and return-to-libc exploit . . . 33
4 The results of exploit generation for sample code . . . 40
5 The run-time information of rerun-to-libc exploit generation . . . 40
6 The run-time information of jump-to-register exploit generation . . . 42
List of Algorithms
1 Searching for symbolic blocks . . . 28
2 Injecting shellcode . . . 30
3 NOP sled . . . 31
Chapter 1
Introduction
Software security is an important issue in computer security field. It is due to that the software vulnerability has been the root of a variety of computer security threats. The threats are mostly induced by misuse of syntax or carelessness of logic during software development. With the inherent vulnerabilities, attackers can reason out an “exploit”, which is a crafted program in-put and can result in arbitrary program execution of malicious code, to intrude into comin-puter systems and cause system damage.
On the other hand, exploits are very good test cases for software developers. In order to fix a large number of bugs, programmers have to set priority for bugs according to the degree of security threats. However, there are currently few effective ways to identify bugs as security vulnerabilities. Exploit generation is a possible way to prove a bug exploitable. Moreover, exploits can help programmers fix vulnerabilities quicker by reproducing the attack behavior.
1.1
Motivation
Manual exploit generation is a difficult and time-consuming process because it requires not only the related low-level knowledge of computer systems, such as operating system internals and assembly language, but also analyzes the control and data flow of program execution by hand. If the program under test is large or uses complex algorithms, the analysis work will be extremely difficult.
In software testing filed, many research and techniques aim to find bugs[1, 2] in a program and generate test cases[3] to trigger those bugs. However, those test cases are meaningless and
only to cause the program to crash. On the other hand, the techniques of attack skills and exploit designs are multifarious, but the exploit is still very difficult to be generated manually. For this reason, this thesis tries to bridge the gap between bug finding and exploit techniques and to generate exploit automatically.
1.2
Objective
We have observed that many applications will crash by feeding a certain unexpected data. A program crashes means that control flow of the program execution is changed to invalid execu-tion paths, and the program is very likely exploitable. In a program, many data may influence control flow of program execution, such as return address of functions, and Global Offset Ta-ble (GOT). If these sensitive data are corrupted, the intended attackers can hijack the program control. However, in most of the cases, these control sensitive data cannot be touched in normal behavior of program execution. The challenge in this thesis is to generate inputs to corrupt these control sensitive data through vulnerabilities so that the program will execute in invalid control flow.
The purpose of this work is that given a program with potential security bugs and a shell-code, we are able to find an execution path that includes a data flow to taint control sensitive data, and generate a test case that could hijack control flow and jump to the shell-code.
1.3
Overview
The structure of this thesis is shown as follows. Chapter 2 describes the backgrounds of software testing and vulnerability, along with an introduction to related work. Chapter 3 and 4 explain our method and implementation. Chapter 5 shows the experimental results. Finally, Chapter 6 concludes our thesis, with further work.
Chapter 2
Background
The techniques of software testing are very various. Static analysis can handle large-scale programs because it just scans source code without executing the programs, but false positives often happen in static analysis, i.e. less precise. Dynamic analysis executes the programs under test to find the explicit bugs, but it is often slow than static analysis. In this chapter, three popular techniques of software testing are introduced, and compared their differences.
On the other hand, the types of software vulnerabilities are also various, such as buffer over-flow, command injection, and race condition. Control-flow hijacking vulnerabilities are main targets in this thesis, and five common vulnerabilities to be experimented are explained in follow related sections. In the final section, we describe the related work about symbolic execution, which is the main used technique of software testing in this thesis, and exploit generation.
2.1
Software Testing
2.1.1
Fuzz Testing
Fuzz testing is a common technique of software testing, which provides random or unexpected data as input to crash a program or to trigger assertions. Fuzz testing often treats the program under test as a black box, and cooperates with a Fuzzer1, which is a kind of testing tools that will generate data, to repeatedly feed the program with random input. Fuzz testing is fast and precise because programs are concretely executed, but path coverage is probably low because the input are generated randomly. Considering line 12 in Listing 1, the chances of random input
1For example, zzuf (http://caca.zoy.org/wiki/zzuf) is a transparent application input fuzzer aiming to find bugs in applications.
to take true branch at condition statement i f (x == 2011) is 1
232 if x is 32 bits. Fuzz testing is
likely to spend much time to wildly explore the paths. Consequently, fuzz testing is inefficient for covering all paths of programs, but is good at getting some input to crash programs.
2.1.2
Symbolic Execution
Symbolic execution[4, 5, 6] is a popular technique of software testing. In contrast with concrete execution that treats the program under test as a black box and find next new path without any information, symbolic execution attempts to explore all paths in the program more systemati-cally by transforming the path feasibility problem into boolean satisfiability problem.
The main idea of symbolic execution is to replace variables controlled by external environ-ments with symbolic values rather than actual data. The value range of those variables repre-sented by symbolic expressions is unlimited, i.e. any value, when the program runs initially. With program execution, those symbolic variables will taint other non-symbolic variables, and its value will be gradually restricted.
A path condition is a quantifier-free boolean formula, and its satisfiability could be validated by constraint solvers, a kind of solver for Satisfiability Modulo Theories (SMT) problem. The path condition represents the control flow of program execution and its value is true initially. Whenever program execution encounters branches that associate with symbolic variables, the symbolic execution forks a new execution with different path conditions, i.e. different restric-tions for the symbolic value. On true branch, the branch condition is added to the path condition, otherwise the negation of the branch condition is used. Each of two updated path conditions will be passed to a constraint solver to determine whether the path condition is satisfiable or not. If the path condition is not satisfiable, the path will be dropped because it is infeasible. When a program execution terminates, the path condition can be solved by a constraint solver to get a test case that will traverse same path.
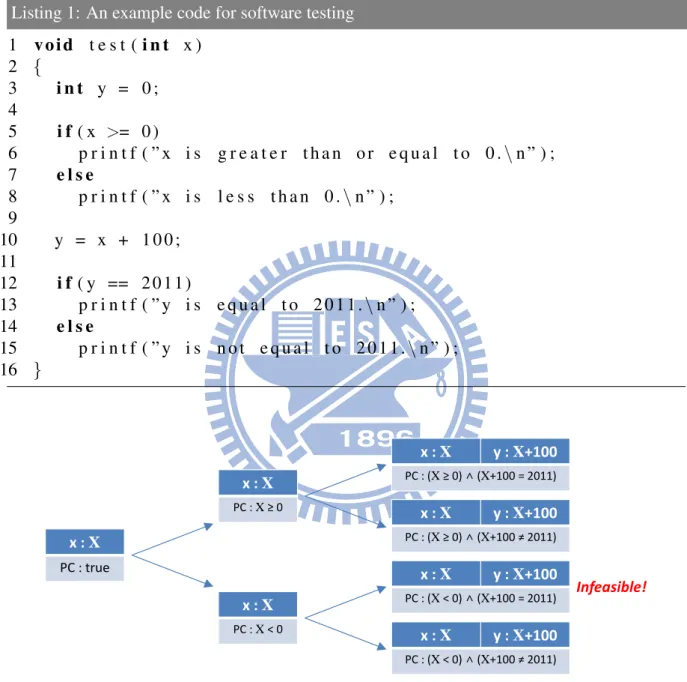
Consider the example code in Listing 1, variable x is replaced with a symbol X when the program starts running. At line 5, the execution is forked, one’s constraint is X ≥ 0 and another is X < 0. The concrete variable y is tainted by symbolic variable x at line 10, so variable y becomes symbolic and its value is X + 100. At line 12, the execution is forked again because variable y is symbolic. An execution is added a constraint X = 2011 and another is added X6= 2011. The path whose path constraint is (X < 0) ∧ (X = 2011) is dropped because it is
infeasible. Finally, when symbolic execution has explored all three paths, each path condition is passed to a constraint solver to get a solution taking each path respectively. The process of symbolic execution is shown in Figure 1.
Listing 1: An example code for software testing
1 v o i d t e s t ( i n t x ) 2 { 3 i n t y = 0 ; 4 5 i f ( x >= 0 ) 6 p r i n t f ( ” x i s g r e a t e r t h a n o r e q u a l t o 0 . \ n ” ) ; 7 e l s e 8 p r i n t f ( ” x i s l e s s t h a n 0 . \ n ” ) ; 9 10 y = x + 1 0 0 ; 11 12 i f ( y == 2 0 1 1 ) 13 p r i n t f ( ” y i s e q u a l t o 2 0 1 1 . \ n ” ) ; 14 e l s e 15 p r i n t f ( ” y i s n o t e q u a l t o 2 0 1 1 . \ n ” ) ; 16 } x : X PC : true x : X PC : X ≥ 0 x : X PC : X < 0 x : X y : X+100 PC : (X ≥ 0) ∧ (X+100 = 2011) x : X y : X+100 PC : (X ≥ 0) ∧ (X+100 ≠ 2011) x : X y : X+100 PC : (X < 0) ∧ (X+100 = 2011) x : X y : X+100 PC : (X < 0) ∧ (X+100 ≠ 2011) Infeasible!
Figure 1: The symbolic execution tree of Listing 1
2.1.3
Concolic Testing
In practice, symbolic execution is usually infeasible for large programs because of path explo-sion problem. The number of paths is growing exponentially in proportion to the number of
branches, and if a program contains infinite loops, such as GUI applications, the number of paths will approach infinite. Currently, many research efforts focus on these issues, including using path selection heuristics to quicker find desired paths, using static analysis to prune off the useless parts of search space, etc.
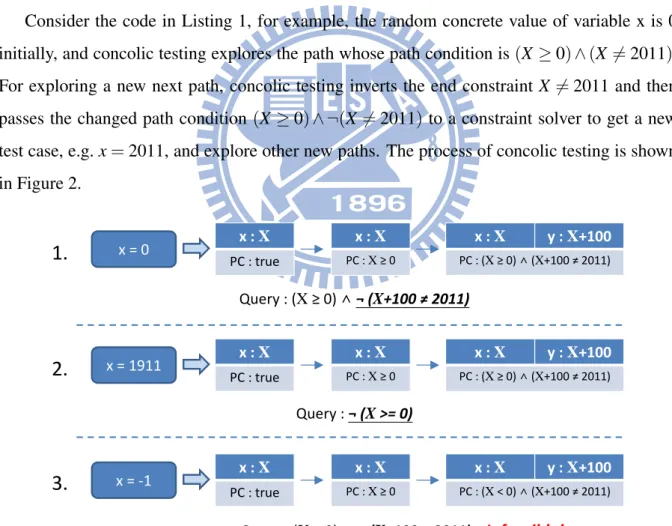
Concolic testing is a strategy combining the accuracy of concrete execution and the sys-tematic capacity of symbolic execution. Concolic testing executes the program under test con-cretely and symbolically, and explores only one path at a time. Concolic testing first executes the program under test with concrete random input, and symbolic execution is used to collect the branch conditions. Whenever a path terminates and gets a final path condition, concolic testing negates the end condition of the whole path condition to generate the next test case that will explore a new next path followed by depth-first search.
Consider the code in Listing 1, for example, the random concrete value of variable x is 0 initially, and concolic testing explores the path whose path condition is (X ≥ 0) ∧ (X 6= 2011). For exploring a new next path, concolic testing inverts the end constraint X 6= 2011 and then passes the changed path condition (X ≥ 0) ∧ ¬(X 6= 2011) to a constraint solver to get a new test case, e.g. x = 2011, and explore other new paths. The process of concolic testing is shown in Figure 2. x : X PC : true x : X PC : X ≥ 0 x : X y : X+100 PC : (X ≥ 0) ∧ (X+100 ≠ 2011) x = 0 x : X PC : true x : X PC : X ≥ 0 x : X y : X+100 PC : (X ≥ 0) ∧ (X+100 ≠ 2011) x = 1911 x : X PC : true x : X PC : X ≥ 0 x : X y : X+100 PC : (X < 0) ∧ (X+100 ≠ 2011) x = -1 Query : (X ≥ 0) ∧ ¬ (X+100 ≠ 2011) Query : ¬ (X >= 0) Query : (X < 0) ∧ ¬ (X+100 ≠ 2011) Infeasible!
1.
2.
3.
Figure 2: The process of concolic testing on Listing 1
In addition to handling path explosion problem, concolic testing addresses what symbolic execution gets stuck in some constraints, e.g. (X = Y ∗Y ∗Y ), because constraint solvers have
trouble with non-linear constraints. Concolic testing can replace variable Y with concrete value, e.g. Y is 2, and the constraint is simplified to X = 8.
2.2
Software Security
2.2.1
Vulnerability and Exploit
Some bugs may not be threats for system security consideration, and those only cause the pro-gram crash with wrong output purely when unexpected input data passed to the propro-grams. In other words, those are not exploitable. If a bug is exploitable, which is called vulnerability, attackers can make a program with the vulnerability perform malicious behavior and damage computer security. Unexpected test cases may trigger the vulnerability and lead a program to crash, but a crafted test case can avoid a program to crash and hijack control of programs to perform malicious tasks. The crafted test case is called Exploit, which is a well-designated data and reasoned out carefully by attackers. The attackers will take advantage of vulnerabilities to redirect program flow to malicious actions. The relation between exploits and input space is shown in Figure 3. Exploits often contain a piece of binary code as the payload called Shellcode performing malicious tasks. The behavior of shellcode is usually to open a new command shell, and it could be manually generated or by some tools, such as Metasploit2.
Unsafe input Exploits
Safe input
Input space
Figure 3: The relationship between exploits and input space
2.2.2
CPU Architecture and Operating System
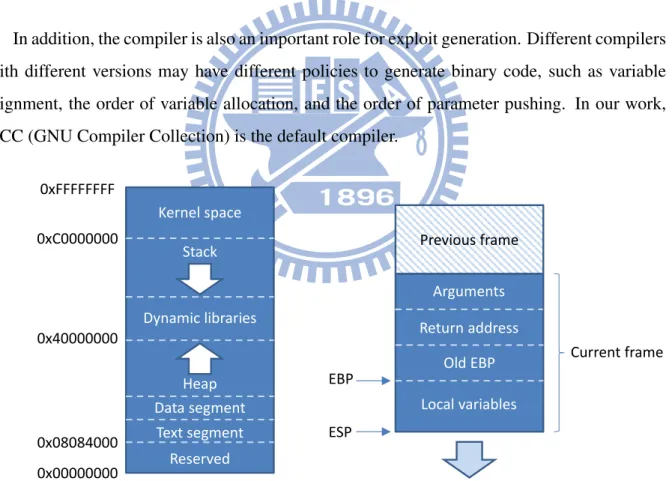
Because exploits depend on CPU architectures and operating systems, our work is aimed at 32-bit x86 architecture and Linux system. Intel x86 architecture is the most popular CPU for
Personal Computer. The design of x86 is little-endian and CISC (Complex Instruction Set Computer). The main related registers may hijack control of programs are shown as follows:
• EIP register – Points to the next instruction to be executed.
• ESP register – Points to the top of stack. Because the return address is stored in stack when calling a function, ESP may influence EIP register indirectly.
• EBP register – Points to the location of current stack frame. Because EBP is used to update ESP when functions return, EBP may influence ESP and EIP register indirectly. In Linux system, the widely used executable format is ELF (Executable and Linking For-mat). The memory layout of ELF executable at rum-time is shown in Figure 4. The binary is loaded at memory address 0x0804800, and stack starts at 0xbfffffff and grow downward.
In addition, the compiler is also an important role for exploit generation. Different compilers with different versions may have different policies to generate binary code, such as variable alignment, the order of variable allocation, and the order of parameter pushing. In our work, GCC (GNU Compiler Collection) is the default compiler.
0xC0000000 0x08084000 Kernel space 0xFFFFFFFF Stack 0x00000000 Reserved 0x40000000 Heap Dynamic libraries Text segment Data segment
Figure 4: Memory layout in Linux
Local variables Old EBP Return address Arguments ESP EBP Current frame Previous frame
Figure 5: The layout of stack frame
2.2.2.1 Stack and Heap
Stack is an important memory region and structure for function calls. The structure of stack is LIFO (Last In, First Out) and the layout of stack frame is shown in Figure 5. On calling a
function, the caller pushes its parameters and return address into stack, and then jumps to the target function. Next, the callee pushes the value of EBP register into stack and allocates the space for local variables. Because the return address is pushed into stack, control flow will be hijacked by restoring the corrupted return address to EIP register when function returns. Listing 2 and 3 show the prologue and epilogue in x86 assembly.
Listing 2: Function prologue
1 push %ebp
2 mov %esp , %ebp 3 sub $0x8 , %e s p
Listing 3: Function epilogue
1 l e a v e ; mov %ebp , %e s p
2 ; pop %e b p
3 r e t ; pop %e i p
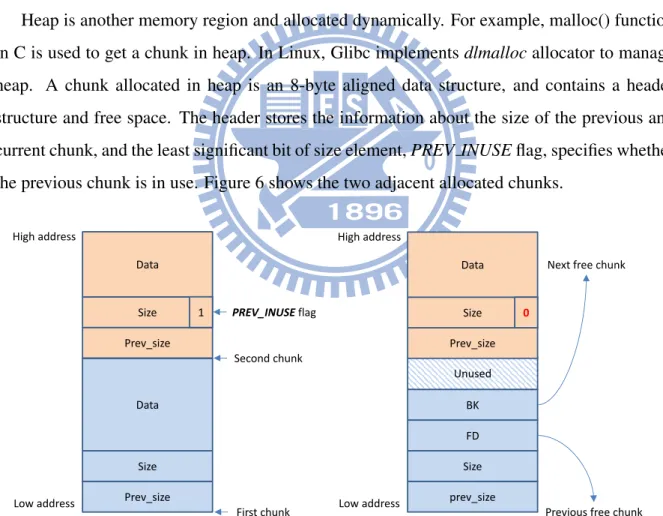
Heap is another memory region and allocated dynamically. For example, malloc() function in C is used to get a chunk in heap. In Linux, Glibc implements dlmalloc allocator to manage heap. A chunk allocated in heap is an 8-byte aligned data structure, and contains a header structure and free space. The header stores the information about the size of the previous and current chunk, and the least significant bit of size element, PREV INUSE flag, specifies whether the previous chunk is in use. Figure 6 shows the two adjacent allocated chunks.
Prev_size Size Data Prev_size Size Data 1 PREV_INUSE flag Low address High address First chunk Second chunk
Figure 6: Heap layout in Linux
prev_size Size Unused Prev_size Size Data 0 Low address High address BK FD
Previous free chunk Next free chunk
Figure 7: Heap layout after a chunk is free
When a chunk is deallocated, allocator checks whether the adjacent chunks are free. If the adjacent chunk is free, it is merged into a new big free chunk. All free chunks are stored in a doubly-linked list, each free chunk contains a forward pointer pointing to the next free chunk
and a backward pointer pointing to the previous free chunk. Both pointers are stored in the unused chunk itself. Figure 7 shows the layout after freeing the first chunk.
2.2.3
Software Vulnerabilities
2.2.3.1 Stack Buffer Overflow
Stack buffer overflow is a common vulnerability and usually caused by unsafe functions, such as strcpy() and gets(). As mentioned in Section 2.2.2.1, the return address of functions is stored in the stack frame, and restored to EIP register when functions return. If the length of source input is not checked, stack smashing will happen by feeding a long input over the boundary of the destination local buffer. The corrupted return address will cause control flow hijacked when the function returns.
2.2.3.2 Off-by-one Overflow
Off-by-one error is also a common bug and arises from an error boundary condition. If EBP register or a pointer variable is overwritten, it will be exploitable. Because EBP register will update ESP register when the function returns, and the corrupted pointer may write data to arbitrary locations, both cases could influence control flow indirectly.
2.2.3.3 Heap Buffer Overflow
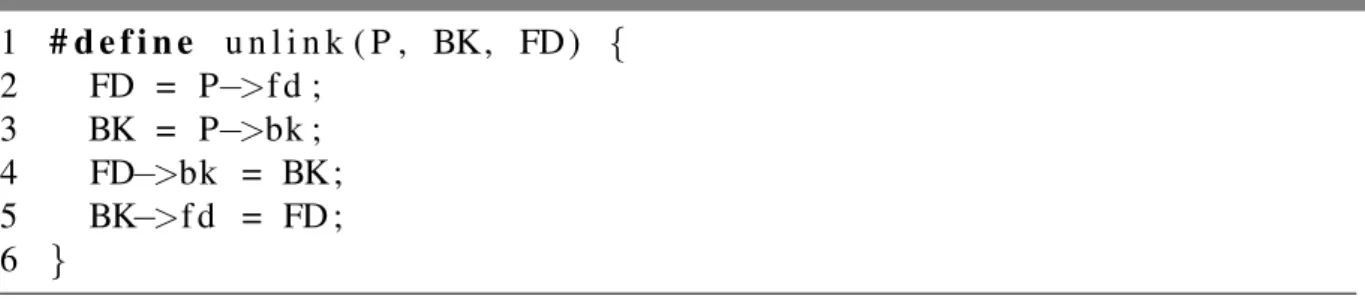
As noted in Section 2.2.2.1, a chunk will try to merge adjacent free chunks when it is deallo-cated. Listing 4 defines the behavior for updating the fd and bk pointer to merge chunks. If a heap buffer overflow vulnerability occurs, attackers can overwrite the header of next chunk to fake the size and the value of both pointers. When the current chunk is deallocated, the allocator will try to merge with next chunk and the unlink operation will cause arbitrary write of 4-byte data by attackers to arbitrary memory addresses.
2.2.3.4 Uninitialized Variable
As shown in Listing 2 and 3, the epilogue of function just moves ESP register to deallocate local variables when functions return, and the prologue increases the size of the local variables to ESP register when calling a function. If a local variable without initialization is used, its value will reuse the value left by the previous function invocation. Figure 8 shows an example,
Listing 4: The macro of unlink operation 1 # d e f i n e u n l i n k ( P , BK, FD ) { 2 FD = P−>f d ; 3 BK = P−>bk ; 4 FD−>bk = BK ; 5 BK−>f d = FD ; 6 }
when invoking two function a() and b() sequentially, the stack frame of the last function will reuse the overlapping space with the previous functions. Therefore, if the previous variable can be controlled, the current variable can also be controlled via this vulnerability.
Previous frame
A()
Previous frameB()
Current frame Current frame ESP ESP ESP ESP A() Return B()Figure 8: The example process of uninitialized variable vulnerability
2.2.3.5 Format String
If some C functions that perform formatting output, such as printf(), use unchecked input as the format string parameter, attackers can use some format tokens, such as %x, %s, and %n, to print the information in stack or write data to arbitrary memory addresses. When format tokens are encountered in a format string, the program expects that the data are retrieved from the stack. But if the input is not provided in function arguments, the program will read from or write to wrong addresses in the stack. The %n format token writes the number of characters output in front of itself to the location provided in arguments, and attackers can use %n format token to write arbitrary value to arbitrary address.
2.2.4
Protection Mechanisms
To prevent from attacks, many protection mechanisms have been proposed and applied in some compilers or operating systems. Those methods aim to increase the difficulties of successful attacks. The main mechanisms are listed below:
• ASLR (Address Space Layout Randomisation)
– ASLR randomizes the locations of memory regions, so that attacks won’t work be-cause the address of shellcode is random and unexpected. In Linux, ASLR random-izes Stack, Heap, and share library, but not for the program image.
• W⊕X (Writable ⊕ eXecutable)
– W⊕X sets a memory region either writable or executable. Exploits usually contain shellcode as payload, but W⊕X stops the shellcode from being “executed” because the exploit must be “written” to memory.
• Stack Hardening
– In order to protect stack against buffer overflow attacks, compilers have imple-mented some techniques to defend return addresses from corruption. In GCC com-piler, StackGuard inserts a “canary” in front of return addresses and checks whether the value is changed when functions return. In addition, Stackshield copies away return addresses to a non-overflowable area, and restores it when functions return. • Heap Hardening
– To protect heap from smashing, heap consistency checking has implemented to check whether the metedata, which records the information about neighbouring chunks, is corrupted or not, whenever a heap block is freed. For example, some security checks are implemented to exclude infeasible sizes in metadata since ver-sion 2.3.4 of Glibc.
In addition, many safe functions are provided for programmers to avoid using unsafe func-tions. For example, strcpy() function is very dangerous because of buffer smashing, and strncpy() function is the safe version of strcpy() function that copies a string with bound checking.
2.3
Related Work
2.3.1
Symbolic Execution and Constraint Solving
Symbolic execution is a popular software testing technique, and has been applied on many dynamic symbolic execution tools. DART[7] combines symbolic execution with concrete exe-cution, and uses the concrete value to simplify constraints whenever symbolic execution is stuck on them. CUTE[8] deals with multi-thread and pointer programs. SAGE[9] and Pex are devel-oped by Microsoft and SAGE is the first tool that implements Whitebox fuzzing. Catchconv[10] is built on Valgrind[11], which is an instrumentation framework for building dynamic analysis tools, and also implements Whitebox fuzzing. KLEE[12] is a redesign of EXE[13], and is built on LLVM compiler infrastructure[14]. KLEE deals with the interactions with outside environ-ments, and uses many search heuristics and constraint optimizations to get high code coverage. In addition, many research efforts improve the limitation of symbolic execution, such as path explosion. SPD[15] uses control and data dependencies to avoid analyzing unnecessary paths, and RWset[16] analyzes tracks of all reads and writes to discard redundant paths. IPEG[17] finds the unsatisfiable core from one infeasible path to prune a family of infeasible paths. Many heuristics searches[18] are also used to find a path efficiently.
SMT solvers play an important role in symbolic execution for solving constraints. STP[19], CVC3[20], Yices[21] and Z3[22] are the most used solvers for dynamic symbolic execution tools. Complex or a large number of constraints are another bottleneck of symbolic execution. HAMPI[23] helps STP generate structured test cases. Stitched dynamic symbolic execution[24] uses decomposition and re-stitching to bypass complex functions like decryptions and check-sum verifications. Cloud9[25, 26] parallelizes symbolic execution to large clusters and aims to speed up constraint solving.
2.3.2
Exploit Generation
APEG (automatic patch-based exploit generation)[27] compares the differences between a buggy version program and a patched version, and generates the exploits to fail the added check in the patched version program. This work needs a patched version program and only feasible when the patch is to fix by adding input sanitization logic. In addition, the exploits generated by
APEG almost are DoS (Denial-Of-Service) attacks, which just crash a program, without exe-cuting shellcode or malicious tasks.
AEG (automatic exploit generation)[28] generates exploits by two stages, which are finding bugs on symbolic execution and collecting run-time information on concrete execution. AEG only deals with stack buffer overflow and format string vulnerability because it has to add individual safety check constraints to detect each bug. AEG implements an end-to-end approach for exploit generation, including symbolic files, symbolic sockets, etc., and uses return oriented programming to bypass both W⊕X and ASLR[29].
Heelan et al. [30] use binary instrumentation to perform taint propagation and collect run-time information. Their work generates exploits by checking whether EIP register is corrupted by a tainted value, and also handles pointer corruption that corrupt EIP register indirectly. But, a crashing input is essential for taint analysis in their work because symbolic execution doesn’t be implemented.
In addition, some work don’t generate exploits explicitly, but aim to report a bug is probably exploitable. For example, !exploitable3and some projects[31] of BitBlaze analyze a crash and determine whether it is exploitable or not.
3!exploitable crash analyzer(http://msecdbg.codeplex.com/) is developed by Microsoft, and provides au-tomated crash analysis and security risk assessment.
Chapter 3
Method
AEG is the most similar work with ours for automated exploit generation at present. We explain the weakness of AEG and take an example code to show the case in this chapter. In order to overcome the weakness of AEG, we propose a new exploit generation that can handle more cases than AEG. In addition, we introduce the tool that we use to implement our method, and compare it with the tool that AEG uses.
In addition to exploit generation, we implement some path selection optimizations on S2E to speed up the process of exploit generation. Concolic-mode simulation explores one poten-tial vulnerable path directly, and code selection filters some complex and uninteresting library functions that are not affect exploit generation to reduce the overhead of SMT solvers.
3.1
The Weakness of AEG
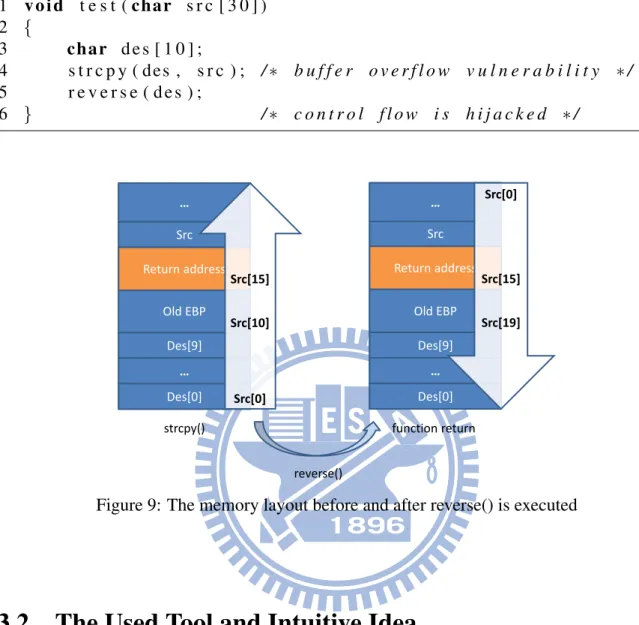
Similar to our work, AEG detects vulnerabilities by symbolic execution and then collects run-time information from concrete execution with the test case generated by the previous step. AEG collects run-time information and computes exploits when vulnerability is triggered. The generated exploit may fail to work, due to the propagation distance between the vulnerable site and the triggered exploit site. AEG cannot guarantee that the program under test arrives at the triggered exploit site successfully if the exploits are not revised accordingly. Consider Listing 5, the buffer overflow vulnerability happens at line 4 where strcpy() function is located, but the exploit is triggered at line 6 where the function returns. Between line 4 and line 6, the exploiting string is reversed at line 5 and fails to work when the function returns. The process is shown in Figure 9.
Listing 5: An example code for AEG 1 v o i d t e s t ( c h a r s r c [ 3 0 ] ) 2 { 3 c h a r d e s [ 1 0 ] ; 4 s t r c p y ( d e s , s r c ) ; /∗ b u f f e r o v e r f l o w v u l n e r a b i l i t y ∗ / 5 r e v e r s e ( d e s ) ; 6 } /∗ c o n t r o l f l o w i s h i j a c k e d ∗ / Des[0] Des[9] … Old EBP Return address Src … Des[0] Des[9] … Old EBP Return address Src … Src[10] Src[0] Src[15] reverse()
strcpy() function return
Src[19] Src[15] Src[0]
Figure 9: The memory layout before and after reverse() is executed
3.2
The Used Tool and Intuitive Idea
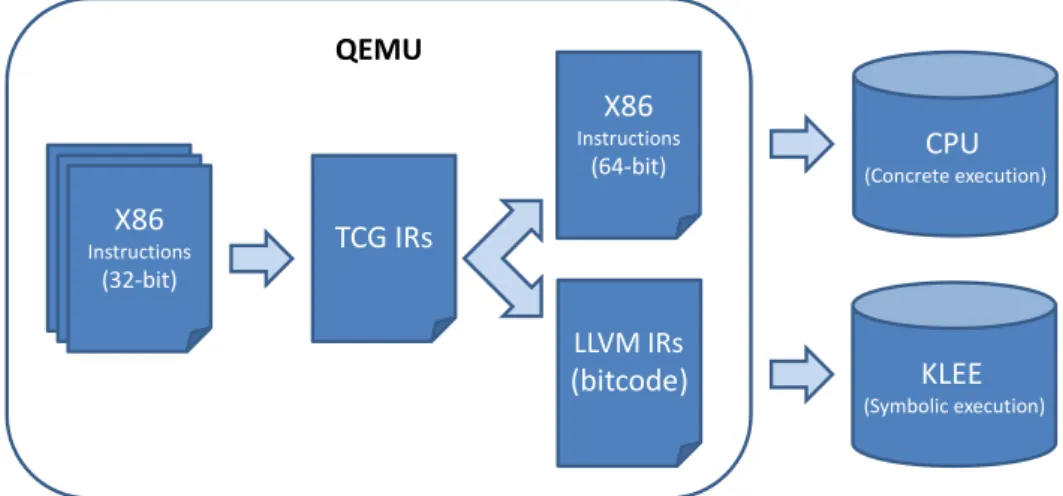
S2E[32] is a platform that consists of QEMU[33] and KLEE for extending scale of symbolic ex-ecution ranging from applications to the whole operation system. KLEE is a symbolic exex-ecution engine built on LLVM compiler infrastructure. It interprets and performs symbolic execution on LLVM intermediate representation code, which is called bitcode. QEMU is a processor em-ulator using Dynamic binary translation to translate instructions between two different CPU architectures. S2E adds a new LLVM back-end[34] to QEMU so that KLEE has the ability to perform symbolic execution on the whole system.
S2E implements selective symbolic execution[35] to run as much code natively as possible. It switches from concrete to symbolic execution whenever S2E accesses symbolic data. This
technique enables S2E to speed up symbolic execution on real systems. The architecture of S2E is shown in Figure 10. X86 Instructions (32-bit) TCG IRs LLVM IRs (bitcode) X86 Instructions (64-bit) KLEE (Symbolic execution) CPU (Concrete execution) QEMU
Figure 10: The architecture of S2E
The differences between KLEE and S2E are shown in Table 1. The most important advan-tage of S2E for exploit generation is the low-level and real run-time information, including value of registers, contents of memory, etc. This feature is useful for reasoning out precise exploits.
Table 1: The differences between KLEE and S2E
Tool Scale Run-time Information Programs under Test KLEE application abstract source code
S2E operating system real binary(x86)
Considering Listing 6, it seems that a buffer overflow vulnerability happens at line 5 because the length of source string is longer than destination length on strcpy() function, and the num variable may be corrupted to cause that the if branch at line 7 can be controlled. In fact, when GCC compiler compiles this program with optimization, the order of variables are rearranged and the location of num variable is in front of des variable. Therefore, the num variable cannot be touched so that the branch condition in the if statement at line 7 is always false. For this reason, the real run-time information are critical for exploit generation.
In addition to real run-time information, other features show that S2E is a good platform for exploit generation. For example, S2E can perform symbolic execution on a whole operating
Listing 6: An example code for rearranging variables 1 i n t num = 0 ; 2 c h a r d s t [ 2 ] ; 3 c h a r s r c [ 6 ] ; 4 5 s c r c p y ( d s t , s r c ) ; 6 7 i f ( num ! = 0 ) 8 { 9 a s s e r t ( num ! = 0 ) ; / / GOAL ! 10 }
system to generate exploits for vulnerabilities in library or kernel, and can operate directly on binaries to make exploit generation more useful for real-world programs. Therefore, we choose S2E to implement automated exploit generation, and to evaluate the results.
S2E emulates the whole operation system so that the run-time information and events can be monitored during program execution. The intuitive idea is to reason out exploits when the exploit is being triggered. Because this idea improves the shortcomings of AEG and guarantees exploits to work. But it will be treated in different ways for different vulnerabilities when the exploit is triggered. For example, stack buffer overflow triggers exploits when functions return, i.e. the ret instruction, but heap buffer overflow may corrupt Global Offset Table (GOT) to redirect the library function invocation and it triggers exploits when calling functions, i.e. the callinstruction. Therefore, based on the intuitive idea, a general method is needed to handle different kinds of vulnerabilities.
3.3
Our Method
3.3.1
EIP Register Corrupted Detection
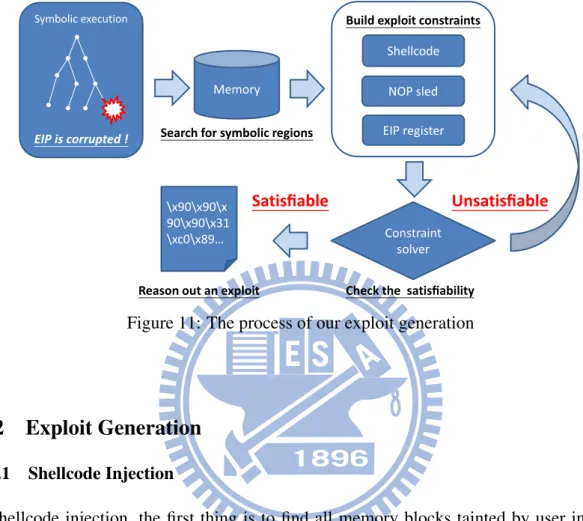
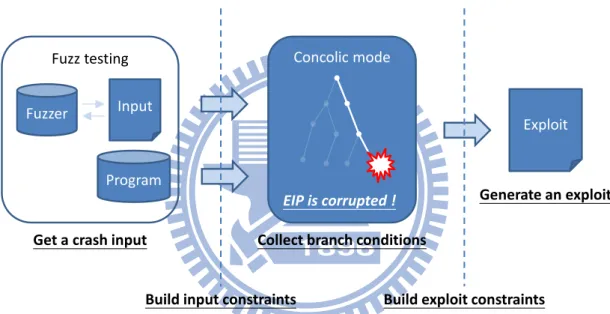
Monitoring the state of EIP register is the most comprehensive and easy method for dealing with different kinds of control-flow hijacking vulnerabilities, because the common final target of all control hijacking attacks is to control EIP register, which contains the address of next instruction to be executed. If EIP register is corrupted by symbolic data, it means that control flow can be hijacked by program input. Therefore, during symbolic execution explores paths and taints memory, the exploit generation will be started when EIP register is updated with
a symbolic data. The exploit generation will search memory to find usable memory regions to inject shellcode and NOP sled, and redirect EIP register to shellcode. The process of EIP register corrupted detection and exploit generation is shown in Figure 11.
Shellcode NOP sled EIP register
Build exploit constraints
Symbolic execution
Memory
Constraint solver
Satisfiable Unsatisfiable
Reason out an exploit
EIP is corrupted !
Check the satisfiability Search for symbolic regions
\x90\x90\x 90\x90\x31 \xc0\x89…
Figure 11: The process of our exploit generation
3.3.2
Exploit Generation
3.3.2.1 Shellcode Injection
For shellcode injection, the first thing is to find all memory blocks tainted by user input and large enough to hold payload. Even if a tainted block consists of many different variables, it still could be used to inject shellcode as long as the block is contiguous. It is very difficult to analyze source code manually to find a contiguous memory region tainted by user input and combined with variables. In addition, compiler often changes the order or allocation size of variables for optimization, and makes it more difficult to find a shellcode buffer manually.
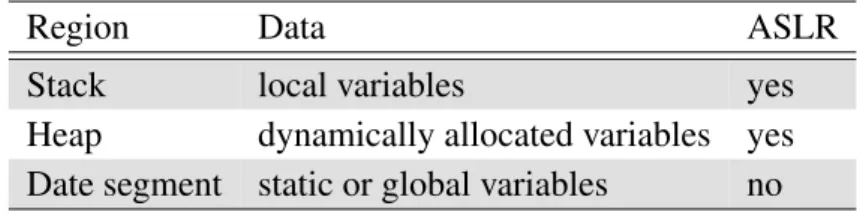
The main regions data stored in memory are stack, heap and data segment. The distinctions among them are shown in Table 2. The data segment is the best region for shellcode injection because its address is decided at compile time, i.e. it is unaffected by ASLR. Stack and heap both are affected by ASLR, but the heap is more suitable than stack for shellcode injection. The primary reason is that there are more protections for stack than for heap, and the second is that the stack stores not only local variables but also other sensitive data for exploitation, such as environment variables. The locations of some variables in stack may differ on different
systems. Therefore, the search order for shellcode injection is followed by data segment, heap, and finally stack.
Table 2: The differences among Stack, Heap, and Data segment
Region Data ASLR
Stack local variables yes
Heap dynamically allocated variables yes Date segment static or global variables no
3.3.2.2 Nop Sled and Exploit Generation
When the location of shellcode has determined, NOP sled will try to insert a sequence of NOP instructions, which do nothings, in front of shellcod closely as many as possible. This padding helps exploits against the inaccurate position of shellcode among different systems, or to extend the entry point of shellocde. Finally, the symbolic data corrupted EIP register will point to the middle of NOP padding. All exploit constraints, including shellcode, NOP sled, and EIP register constraints, are passed to an SMT solver with path conditions to determine whether the exploit is feasible or not. If it is not feasible, the exploit generation goes back to the step of shellocde injection to change the location of shellcode until success or no more usable buffers in memory.
3.3.3
Pointer Corrupted Detection
In addition to EIP register, corrupted pointers may change the control flow indirectly. Particu-larly, a corrupted data is assigned to a corrupted pointer means that arbitrary data can be wrote to arbitrary addresses. When a corrupted pointer dereference is detected, the target of writing operation will be redirected to sensitive data, such as return addresses, .dtors section, and GOT, to taint EIP register indirectly. Otherwise, if the pointer operation is a reading operation or a writing operation but cannot point to sensitive data, the target is redirected to read from a sym-bolic data or write to a concrete data to perform tainted data propagation. Consider Listing 7, off-by-one overflow vulnerability will corrupt ptr pointer and cause the value of buf[0] may write to arbitrary addresses. Even if this vulnerability cannot corrupt return addresses directly, the symbolic pointer can taint EIP register indirectly and hijack control of the program.
Listing 7: An example code for pointer corruption 1 v o i d t e s t ( i n t ∗ i n p u t ) 2 { 3 i n t ∗ p t r = a r r a y ; 4 i n t a r r a y [ 1 0 ] ; 5 i n t i ; 6 7 f o r ( i =0 ; i <=10 ; i ++) 8 a r r a y [ i ] = ∗ ( i n p u t + i ) ; 9 10 ∗ p t r = a r r a y [ 0 ] ; 11 }
3.4
Path Selection
3.4.1
Concolic-mode Simulation
If an input data crashes a program, the execution path the crash input exploring is very likely exploitable. Exploring the suspicious path directly is more effective than searching all paths. Concolic testing is a kind of symbolic execution, and it explores one path at a time. Concolic testing stores and updates concrete values and symbolic expressions simultaneously. It uses the concrete values to help symbolic execution to determine which branch path will be explored, and uses the symbolic expressions to collect the branch conditions whenever a path is deter-mined to travel at branches.
In contrast with implementing concolic testing on S2E, simulating the behavior of consolic testing on S2E is an easier and flexible method. Whenever a branch is encountered, S2E does not access the concrete value of variables but add input constraints to limit the values of all symbolic variables to the values of original input, which are constants. Figure 12 shows an example that executes the program under test with an argument string “ABCDEF” and the input constraints are built to restrict those values of the argument. Because each symbolic variable could be only one possible value after adding the input constraints, it simulates the concrete values to choose one path to explore. This method does not modify the memory model of S2E and based on symbolic execution to provide the ability of concolic testing.
Concolic-mode simulation determines whether a path is exploitable rapidly because it fo-cuses on only one path. To cooperate with Fuzzer tools on getting an input crashing the program
Input constraints (Eq 65 (Read w8 0 argv)) (Eq 66 (Read w8 1 argv)) (Eq 67 (Read w8 2 argv)) (Eq 68 (Read w8 3 argv)) (Eq 69 (Read w8 4 argv)) (Eq 70 (Read w8 5 argv)) sqlab@ ~$ ./a.out ABCDEF
Figure 12: An example for input constraints
under test automatically, it is a very powerful technique to generate exploits. The process is shown in Figure 13. Fuzz testing Input Program Concolic mode EIP is corrupted !
Build input constraints Build exploit constraints
Exploit Fuzzer
Get a crash input Collect branch conditions
Generate an exploit
Figure 13: The process of concolic-mode simulation with fuzzer tools
3.4.2
Code Selection
Because S2E performs symbolic execution on a whole operating system, the path explosion is very heavily whenever the symbolic data are passed to library or kernel. On the other hand, the constraints induced by library or kernel are usually complex and huge, and constraint solvers often get stuck in them. For example, if the first argument of fopen() function, which is a path of the file to be opened, is symbolic, the constraint solvers will get a time-out error or hang in S2E. But, those paths in library or kernel are often uninterested for exploit generation. In order to avoid exploring those uninterested paths, those library functions should run on concrete execution.
Symbolic execution Symbolic execution Concrete execution Interested Uninterested Interested
Figure 14: An execution tree with code selection
When the symbolic arguments are changed to concrete values and then passed to those uninterested functions, only one path will be explored. Figure 14 shows that the execution tree is corseted after the program entry the uninterested part and until the program returns to symbolic execution. In order to ensure the return value of those uninterested functions is correct, the concrete values passed to functions must be generated according to current path conditions by constraint solvers. When the function returns, those data that had changed to concrete must be restored to the original symbolic data to keep the symbolic execution.
Chapter 4
Implementation
In this chapter, we explain how our method was implemented on S2E, and what algorithms we used. In order to implement automated exploit generation, many run-time information must be collected and many constraints must be built to reason out an exploit, so the memory model in S2E is an important key to achieve these tasks and is shown on follow section.
Many protections are implemented on compilers or operation systems in real-world systems. In addition to return-to-memory exploits, other two types of exploits, which are return-to-libc and jump-to-register exploit, are implemented in our work to bypass some protections. This work makes our exploit generation more useful in real-world systems.
4.1
Register Corruption Detection
In QEMU, the CPUX86State structure, which is defined in Listing 8, is used to simulate the states of x86 CPU, and all register references in guest operating system will be turned into memory references on this structure. When S2E is started, this structure is divided into two parts and stored separately, one of which is CpuRegistersState and another is CpuSystemState. Listing 9 shows the differences between the two parts, and the CpuRegistersState is a symbolic area where stores the all data in front of EIP register in CPUX86State structure, such as general-purpose registers, but the CpuSystemState part is a concrete only area where stores the other data including EIP register.
S2E translates every guest instruction into TCG IRs, and then translates those TCG IRs into host instructions or LLVM IRs. For example, the ret instruction is separated into more detailed
operations as shown in Figure 15, and the operation of updating EIP register is converted to a store instruction. In QEMU, all memory access operations are handled by a softmmu model in order to map the guest addresses to host addresses. Whenever accessing a memory data, S2E checks whether the value of data is symbolic or not in softmmu model. If the value is symbolic, S2E will rerun this translated block from current instruction in KLEE to perform symbolic execution. For detecting EIP register corruption, S2E must check whether the writing target is the location of EIP register and whether the source value is symbolic data whenever KLEE deal with a store memory operation on symbolic execution.
Listing 8: The structure of CPUX86State
1 t y p e d e f s t r u c t CPUX86State { 2 /∗ s t a n d a r d r e g i s t e r s ∗ / 3 t a r g e t u l o n g r e g s [ CPU NB REGS ] ; 4 # i f 0 5 t a r g e t u l o n g e f l a g s ; / ∗ e f l a g s r e g i s t e r . D u r i n g CPU e m u l a t i o n , CC 6 f l a g s and DF a r e s e t t o z e r o b e c a u s e t h e y a r e 7 s t o r e d e l s e w h e r e ∗ / 8 # e n d i f 9 10 /∗ e m u l a t o r i n t e r n a l e f l a g s h a n d l i n g ∗ / 11 u i n t 3 2 t c c o p ; / ∗ o u t s i d e o f c p u l o o p , CC OP i s a l w a y s CC OP EFLAGS ∗ / 12 t a r g e t u l o n g c c s r c ; 13 t a r g e t u l o n g c c d s t ; 14 t a r g e t u l o n g c c t m p ; / ∗ t e m p o r a r y f o r r c r / r c l ∗ / 15 16 . . . 17 18 t a r g e t u l o n g e i p ; 19 20 i n t 3 2 t d f ; / ∗ D f l a g : 1 i f D = 0 , −1 i f D = 1 ∗ / 21 t a r g e t u l o n g m f l a g s ; / ∗ Mode and c o n t r o l f l a g s f r o m e f l a g s ∗ / 22 23 . . . 24 25 } movi_i32 tmp4,$0x80483bd st_i32 tmp4,env,$0x30 ld_i64 tmp5,env,$0x4d760 movi_i64 tmp12,$0x1 add_i64 tmp5,tmp5,tmp12 st_i64 tmp5,env,$0x4d760 mov_i32 tmp2,esp qemu_ld32u tmp0,tmp2,$0x1 movi_i32 tmp13,$0x4 add_i32 tmp4,esp,tmp13 mov_i32 esp,tmp4 st_i32 tmp0,env,$0x30 exit_tb $0x0 0x080483bd : ret
X86 instructions TCG IRs CPUX86State structure
EAX EIP ECX . . . . . . 0x080483bc: leave
Listing 9: The code of registerCPU() function 1 v o i d S 2 E E x e c u t o r : : r e g i s t e r C p u ( S 2 E E x e c u t i o n S t a t e ∗ i n i t i a l S t a t e , 2 CPUX86State ∗ cpuEnv ) 3 { 4 . . . 5 6 /∗ Add r e g i s t e r s and e f l a g s a r e a a s a t r u e s y m b o l i c a r e a ∗ / 7 i n i t i a l S t a t e −>m c p u R e g i s t e r s S t a t e = 8 a d d E x t e r n a l O b j e c t ( ∗ i n i t i a l S t a t e , cpuEnv , 9 o f f s e t o f ( CPUX86State , e i p ) , 10 /∗ i s R e a d O n l y = ∗ / f a l s e , 11 /∗ i s U s e r S p e c i f i e d = ∗ / f a l s e , 12 /∗ i s S h a r e d C o n c r e t e = ∗ / f a l s e ) ; 13 14 i n i t i a l S t a t e −>m c p u R e g i s t e r s S t a t e −>setName ( ” C p u R e g i s t e r s S t a t e ” ) ; 15 16 /∗ Add t h e r e s t o f t h e s t r u c t u r e a s c o n c r e t e −o n l y a r e a ∗ / 17 i n i t i a l S t a t e −>m c p u S y s t e m S t a t e = 18 a d d E x t e r n a l O b j e c t ( ∗ i n i t i a l S t a t e , 19 ( ( u i n t 8 t ∗ ) cpuEnv ) + o f f s e t o f ( CPUX86State , e i p ) , 20 s i z e o f ( CPUX86State ) − o f f s e t o f ( CPUX86State , e i p ) , 21 /∗ i s R e a d O n l y = ∗ / f a l s e , 22 /∗ i s U s e r S p e c i f i e d = ∗ / t r u e , 23 /∗ i s S h a r e d C o n c r e t e = ∗ / t r u e ) ; 24 25 i n i t i a l S t a t e −>m c p u S y s t e m S t a t e −>setName ( ” C p u S y s t e m S t a t e ” ) ; 26 27 . . . 28 }
When EIP register is corrupted by symbolic data, the expression of symbolic data must be recorded because it describes which variable and which part of it corrupt EIP register. For example, an expression that represents a 32-bit symbolic data at the first element of an array named buf is shown as follow.
(ReadLSB w32 0 bu f )
We can build a constraint to control the value of symbolic data. For example, a constraint limit the 32-bit data to zero is shown as follow.
(Eq 0 (ReadLSB w32 0 bu f ))
Next, we must inject shellcode into memory to determine where EIP register should point to.
4.2
Exploit Generation
4.2.1
Memory Model in S
2E
In S2E, memory consists of MemoryObjects objects and the actual contents of MemoryObject objects are stored in ObjectState objects. In an ObejectState object, the symbolic data are stored separately from concrete data. The expressions of symbolic data are stored in an array that consists of Expr Objects and a pointer named knownSymbolics points to it. The concrete data are stored in an array of uint8 t and pointed by a pointer named concreteStore. In each ObejectStateobject, a BitArray object named concreteMask is used to record the states of each byte, i.e. the byte is concrete or symbolic. The structure of ObjectState objects is shown in Figure 16. ObjectState ObjectState ObjectState MemoryObjects ObjectState knownSymbolics concreteStore concreteMask 0 127 0 127 0 127 0x8C 0x71 0xD0 (Read w8 0 buf) (Read w8 1 buf) 0 1 0 (Read w8 2 buf)
Figure 16: The structure of ObjectState object
4.2.2
Finding Symbolic Memory Blocks
The default size of the storage in an ObjecetState object is 128 bytes. For finding continu-ous symbolic data in a memory region, the value of concreteMask structures must be checked sequentially object by object. An object can be skipped easily whenever the value of its con-creteMaskstructure are all ones, otherwise the locations of every zero in concreteMask structure must be recorded to compute the continuous size. For the symbolic blocks crossing objects, it is necessary that to check whether the current symbolic block is connected with the last symbolic block in the last checked object. The algorithm is shown in Algorithm 1.
Algorithm 1: Searching for symbolic blocks
Input: Objects : All ObjectState objects to be searched. Output: V : A set of address and size.
foreach obj ∈ Objects do
1 if isNotAllConcrete() then 2 size ← 0 3 for i ← 0 to 127 do 4 if isByteSymbolic(i) then 5 size ← size + 1 6
else if size 6= 0 then
7
address ← getAddress(i)
8
if V → isConnect(address,size) then
9
V → updateLastItem(size); /* A part of the last block */
10
else
11
V → addNewItem(address,size) /* An independent block */
12
size ← 0
13
Another program is the search range of memory regions. In Linux memory layout, as shown in Figure 4, the based address of stack is 0xbffffffff and grow downward, so it is very easy to search stack region from this address to down. But heap and data segment are not located at a fixed address for different programs. Therefore, those starting locations must be got dynami-cally. According to the ELF executable layout, the top of executable files is the program header, which records the all segment information. The program header can be analyzed at address 0x08048000, which is the location where binary is loaded at, to get the location and size of data segment. On the other hand, because heap region is behind data segment and grow upward, the based address of heap can be got by adding the starting address and size of data segment.
4.2.3
Shellcode Injection
In order to determine whether shellcode can be stored in the potential buffers found by previous step, each symbolic expression of a symbolic block must be read to build constraints that restrict each byte of symbolic data to each byte of shellcode sequentially byte by byte. For example, the constraints that inject shellocde into an array named buf is shown as follow.
(Eq 31 (Read w8 0 bu f )) (Eq C0 (Read w8 1 bu f )) (Eq 89 (Read w8 2 bu f )) (Eq C2 (Read w8 3 bu f )) .. .
Next, the shellcode constraints are passed to an SMT solver with path conditions to validate their feasibility.
For the best location of shellcode, the rule is that NOP sled is as larger as possible. There-fore, all the symbolic blocks are sorted by size, and shellcode is injected from the end of the largest symbolic block firstly. In addition to building the shellcode constraints, a new constraint must be added to ensure EIP register can point to the range between the starting address of shellcode and the top of the symbolic block. Even if EIP register cannot point to the starting location of shellcode precisely, it may feasible because NOP sled will extend the entry point later. If those constraints are infeasible, the location of shellcode injection is always shifted one byte forward to try the new location.
≠ NOP The largest block
X Y Y > X Z Z > X The second . . . Shellcode NOP sled
Figure 17: The process of searching symbolic blocks
In addition, shellcode will keep to be injected to the remain room of the current block or next blocks when those sizes are larger than the sum of the shellcode size and the current longest NOP sled size. For example, consider Figure 17, the sum of shellcode size and current NOP
size is X, but it is smaller than Y and Z, so shellcode and NOP sled will keep to be injected in next blocks and the remain room of the current block. The algorithm is shown in Algorithm 2.
Algorithm 2: Injecting shellcode
Input: V : A set of address and size of symbolic blocks. Shellcode : A shellocde string. PC : Path conditions.
Output: ShellcodeAddress : The starting location of shellcode injection. MaxNopSize : The max size of NOP sled.
foreach v ∈ V do
1
if sizev≥ strlen(Shellcode) then
2
address ← addressv+ sizev- strlen(Shellcode)
3
MaxNopSize ← -1
4
while address ≥ addressvdo
5
c1 ← injectShellcodeAt(address) /* Build shellcode constraints */
6
c2 ← eipBetween(address, addressv) /* Build eip constraints */
7
if Verify(PC ∧ c1 ∧ c2) then
8
nopSize ← NOPSled(address, addressv)
9
if nopSize > MaxNopsize then
10
MaxNopSize ← NopSize
11
ShellcodeAddress ← address
12
if (address - addressv)> strlen(shellcode) + MaxNopSize) then
13
address ← address - nopSize
14 else 15 break 16 else 17 address ← address - 1 18
4.2.4
NOP Sled
NOP sled aims to generate the more reliable exploits that increase chances of success. The method is to insert NOP instructions in front of the shllecode as many as possible, and make EIP register point to the range. For efficiency, binary search-like algorithm is used to determine the longest length of NOP sled rather than insert NOP instructions byte by byte. Whenever binary search finds a range that EIP register can point to, NOP instructions will be tried to fill this range sequentially to check whether both conditions are feasible simultaneously. If it is infeasible, the range is reduced, otherwise extend, and so on. The detail algorithm is shown in Algorithm 3 and process in Figure 18.
Algorithm 3: NOP sled
Input: Start : The starting address of NOP sled. End : The end address of NOP sled. PC : Path conditions.
Output: NopSize : The size of NOP sled. min ← End
1
max ← Start
2
mid ← min + (max-min)/2
3
while min ≤ max do
4
c1 → eipBetween(Start,mid) /* Build eip constraints */
5
if Verify(PC ∧ c1) then
6
c2 → injectNopBetween(Start,mid)/* Build NOP constraints */
7
if Verify(PC ∧ c2) then
8
NopSize ← Start - mid
9 max ← mid - 1 10 else 11 min ← mid + 1 12 else 13 max ← mid - 1 14
mid ← min + (max-min)/2
15 Shellcode NOP Sled max mid min Shellcode NOP Sled max mid min Shellcode NOP Sled max mid min EIP EIP EIP OK NO …
Symbolic block Symbolic block Symbolic block
Figure 18: The process of NOP sled
After the longest length of NOP sled is gotten, the next step is to make EIP register point to the middle of NOP seld as close as possible. Because the number of NOP sled maybe is large, the constraint solver is used to reason out the suitable location that EIP register points to. To help a constraint solver to compute the address as close the middle of NOP sled as possible, a constraint is added to limit the range. First, the range is a point in the middle of NOP sled, and the constraints are passed to a constraint solver to get the solution. If it is infeasible, the range is extended twice each time, and so on. This process always can get a solution, because the previous step guarantees that the EIP register can point to the range of NOP sled. The process as shown in Figure 19 and the algorithm is shown in Algorithm 4.
Algorithm 4: Determining the value of EIP register
Input: NopSize : The size of NOP sled. Start : The starting address. End : The end address. PC : Path conditions.
Output: EipAddress : The address where EIP register points at. mid ← Start - (NopSize/2)
1
range ← 0
2
repeat
3
if mid - range ≤ Start - NopSize then
4 low ← Start-NopSize 5 else 6 low ← mid-range 7
if mid + range ≥ Start then
8 hi ← Start 9 else 10 hi ← mid + range 11
c ← eipBetween(low, hi) /* Build eip constraints */
12 if range = 0 then 13 range ← 1 14 else 15 range ← range * 2 16 until Verify(PC ∧ c) ; 17 EipAddress ← getValue(PC ∧ c) 18
Finally, when the staring address of shellcode, the size of NOP sled and the location where EIP register points to all are determined and feasible, the constraint solver will solve the final path conditions to generate the exploit that performs the malicious task in the shellocde.
EIP EIP EIP
Shellcode NOP sled Shellcode NOP sled Shellcode NOP sled
4.2.5
Other Types of Exploit
4.2.5.1 Return-to-libc
A return-to-libc attack is a technique to bypass non-executable memory regions, such as W⊕X protection. It redirects control flow to functions in C runtime library, such as system(), and injects the arguments of the function into stack manually to fake the behavior of function callers. Because runtime library is always executable and loaded by operating systems, a return-to-libc attack can perform malicious tasks by executing library code and bypass executable space protection. Consider Figure 5, function callers have to push arguments and return address into stack when calling functions. About exploits, it doesn’t really matter where the libc function call returns to, but the arguments are key to perform the tasks we desired.
Table 3: The differences between return-to-memory and return-to-libc exploit Exploit Shellocde Injection NOP Sled
Return-to-memory shellocde NOP instruction(0x90) Return-to-libc “/bin/sh” whitespace(0x20)
ESP Return address Arguments 4 bytes 4 bytes Stack ESP Return address Arguments Stack Old EBP Local variables “/bin/sh”
Before call system() After call system()
Figure 20: The process of return-to-libc exploit generation
Taking system(“/bin/sh”) for example, which will open a shell, the only one argument is a pointer points to the string “/bin/sh” as shown in Figure 20. The process of return-to-libc exploit generation is very similar to return-to-memory. As Table 3 shows that the steps of shellcode injection and NOP sled are still applying to return-to-libc exploit generation. But, shellcode
injection injects the string “/bin/sh” instead of a shellcode, and NOP slep fills whitespace char-acters rather than NOP instructions. Finally, the exploit constraints limit the argument to the location of the middle of whitespace sled and redirect EIP register to the location of system() function in C runtime library.
4.2.5.2 Jump-to-register
Stack is the most common memory region for shellocode injection, but ASLR randomizes the based address of stack so that control flow is very difficult to jump to shellcode accurately. A large NOP sled may bypass ALSR, but it not always feasible. A jump-to-register attack is a technique to bypass ASLR. It uses a register that points to a shellcode as a trampoline to execute the malicious tasks. For example, EAX register is usually used to store the return value of functions. Strcpy() function returns a pointer points to the location of buffer, and EAX register is often used to store the address. If a “call %eax” instruction can be found in code segment, which is very common, and shellcode can be injected into the buffer EAX register points to, control flow will be redirected to execute this instruction and jump to shellcode.
In addition, a jump-to-esp attack is also a common and reliable technique without NOP sled and guessing stack offset in Windows and old version of Linux. Because return addresses are always popped to make ESP register points to their next address when functions return, shellcode can be injected behind the return address and uses ESP register as a trampoline. If a “jmp %esp” instruction can be found in code segment, a jump-to-esp exploit can be generated to bypass ASLR. The process as shown in Figure 21.
ESP Shellcode Stack Local variables Old EBP Return address ESP Shellcode Stack
Before function return After function return
EIP EBP Pop Pop Old EBP Return address