工作滿意與員工績效的相關性研究—以菲律賓籍現場員工為例
77
0
0
全文
(2) 工作滿意與員工績效的相關性研究—以菲律賓籍現場員工為例 A Study of The Relationship between Job Satisfaction and Employee Performance among Filipino Plant Workers. 研 究 生:熊金鐸. Student:Chin-To Hsiung. 指導教授:黃仁宏 博士. Advisor:Dr. Jen-Hung Huang. 國 立 交 通 大 學 管 理 科 學 系 碩 士 班 碩 士 論 文 A Thesis Submitted to Department ( Institute ) of Administration Science College of Management National Chiao Tung University in Partial Fulfillment of the Requirements for the Degree of Master of Business Administration January 2006 Hsinchu, Taiwan, Republic of China. 中華民國九十五年元月.
(3) 國. 立. 交. 通. 大. 學. 博碩士紙本論文著作權授權書 (提供授權人裝訂於紙本論文書名頁之次頁用). 本授權書所授權之學位論文,為本人於國立交通大學 管理科學 系所 碩士班在職 組, 94 學年度第 1 學期取得碩士學位之論文。 論文題目:工作滿意與員工績效的相關性研究—以菲律賓籍現場員工為例 指導教授:黃 仁 宏 ■ 同意 本人茲將本著作,以非專屬、無償授權國立交通大學,基於推動讀者間「資 源共享、互惠合作」之理念,與回饋社會與學術研究之目的,國立交通大 學圖書館得以紙本收錄、重製與利用;於著作權法合理使用範圍內,讀者 得進行閱覽或列印。. 授 權 人:熊 金 鐸. 親筆簽名:______________________. 中華民國. 九十五. 年. 元. 月. 十三. 日.
(4) 工作滿意與員工績效的相關性研究—以菲律賓籍現場員工為例 研究生:熊金鐸. 指導教授:黃仁宏. 博士. 國立交通大學管理科學系﹙研究所﹚碩士班. 摘. 要. 本研究係以赫茲柏格( Herzberg )及馬斯洛( Maslow )的理論模型探討工 作滿意及員工績效之間的相關性,並以位於菲律賓某汽車製造廠之五十五位 現場作業員工為研究對象,利用統計關聯分析的方法檢驗工作滿意因素、員 工個人特徵變數與員工績效之關聯性。 本研究亦分析在工作滿意因素中哪些因素為員工工作滿意度的主要促 成因素,並依據研究的結果探討該公司的員工工作滿意的現況及建議未來可 以進行的改善員工工作滿意度的計劃。. i.
(5) A Study of The Relationship between Job Satisfaction and Employee Performance among Filipino Plant Workers. student:Chin-To Hsiung. Advisors:Dr. Jen-Hung Huang. Department﹙Institute﹚of Administration Science National Chiao Tung University. ABSTRACT This study looked into the relationship of Job Satisfaction and Employee Performance using the concept of Herzberg and Maslow’s Model of Motivation. This involved fifty five direct workers or rank and file employees involved in car assembly in Philippines. Correlation of employee performance and Job Satisfaction Factors and personal characteristics variables were examined. The study also identified which among the job satisfaction factors contribute to overall job satisfaction. The implication of the most contributing job satisfaction factor as well as the improvements that need to be done in the company’s plans and programs were also discussed.. ii.
(6) 誌. 謝. 本論文可以順利完成,最要感謝的是我最敬愛的指導教授—黃仁宏老 師,老師廣博豐富的學養與謙沖親和的態度以及研究過程中的諸多關懷及 包容,將畢生永銘於心。此外,還要感謝口試委員李經遠教授、邱英雄博 士及陳宜棻博士在口試過程中提供許多寶貴的建議,讓本論文益臻完善。 感謝交通大學管理科學系的教授們為我奠定了從事學術研究的基礎, 您們無盡的傳授知識與經驗,讓我無限感念,也要感謝幾年來伴我學習成 長的所有研究所同學,謝謝你們總是在我需要時提供寶貴的意見與幫助。 最後,家人的關心與鼓勵令我著實感念萬分,感謝父親、母親及賢妻 的支持與付出,我才能在工作之餘中完成我的學業並獲得成長,我的生命 才能如此豐富圓滿,謝謝你們!. 金鐸. 謹誌. 國立交通大學管理科學系碩士班 民國九十五年一月. iii.
(7) Table of Contents Page 中文摘要. i. Abstract. ii. 誌謝. iii. Table of Contents. iv. List of Tables. vi. List of Figures. viii. CHAPTER 1. 1. Introduction. 1.1Background of the study. 1. 1.2 Objectives. 3. 1.3 Subject of the Study. 3. 1.4 Procedure of the Study. 4. CHAPTER 2. 5. Literature Review. 2.1 Job Satisfaction. 5. 2.1.1 Concept of Job Satisfaction. 6. 2.1.2 Theories of Job Satisfaction. 6. 2.1.3 Job Satisfaction and Performance. 9. 2.2 Employee Performance. 11. 2.2.1Influence of Communication on Performance CHAPTER 3. 14 15. Methodology. 3.1 Conceptual Framework. 15. 3.2 Theoretical Framework. 16. 3.3 Hypothesis. 19. 3.4 Operational Definition. 19. 3.5 Company Background. 22. 3.6 Participants. 22. 3.7 The tool to measure. 23 iv.
(8) 3.8 Data Collection Procedure. 29. 3.9 Data Analysis. 31. CHAPTER 4. 32. Results. 4.1 Result based on Hypothesis. 32. 4.2 Result based on Job Satisfaction Factors and Overall Job. 34. Satisfaction Correlation 4.3 Result based on Respondents Personal Characteristics. 35. 4.4 Result based on Job Satisfaction Factors. 36. CHAPTER 5. Discussion, Conclusion and Recommendation. 5.1 Discussion. 48 48. Personal Characteristics Variable Motivator Factors Hygiene Factors Overall Job Satisfaction 5.2 Conclusion. 54. 5.3 Recommendation for practical application. 57. References. 59. 中文部分. 59. 英文部分. 60 63. Appendix Appendix A – Organizational Climate Questionnaire. 63. Appendix B – Individual Performance Appraisal Sheet. 65. Appendix C – Profile of the Respondents according to. 66. Performance Rating, Tenure, Age, Educational Attainment, Work Experience and Marital Status. v.
(9) List of Tables Page Data Collection Procedures Table 1 - Reliability Analysis Scale of Overall Job Satisfaction. 30. Table 2 - Reliability Analysis Scale of Job Satisfaction Factors. 30. Table 3- Items that are negatively phrased. 30. Results Table 4 - Correlation of Overall Job Satisfaction Variable to. 32. Employee Performance Variable Table 5 - Correlation of Motivator Factors and Hygiene Factors. 33. to Employee Performance Variable Table 6- Correlation of Personal Characteristics Variables to. 33. Employee Performance Variable Table 7- Correlation of Job Satisfaction Factors and Overall Job. 34. Satisfaction Variable Table 8 – Profile of the respondents according to tenure, age,. 35. educational attainment, job experience and marital status Table 9 – Mean and Standard Deviation of Clarity of Goals. 36. Factor Table 10 – Mean and Standard Deviation of Job Interest and. 37. Challenge Factor Table 11 – Mean and Standard Deviation of Rewards and. 38. Satisfactions Factor Table 12 – Mean and Standard Deviation of Standard of. 39. Excellence Factor Table 13 – Mean and Standard Deviation of Degree of Responsibility Factor vi. 40.
(10) Table 14 – Mean and Standard Deviation of Personal. 41. Development Factor Table 15 – Mean and Standard Deviation of Working. 42. Relationships Factor Table 16 – Mean and Standard Deviation of Advancement and. 43. Mobility Factor Table 17 – Mean and Standard Deviation of Job Security Factor. 44. Table 18 – Mean and Standard Deviation of Management. 45. Credibility Factor Table 19 – Mean and Standard Deviation of Personnel Policies. 46. and Procedures Factor Table 20 – Mean and Standard Deviation of Self-Confidence Factor. vii. 47.
(11) List of Figures Introduction. Page 4. Figure 1 – Procedure of the Study Methodology Figure 2 – Conceptual Framework. 15. Figure 3 – Maslow’s Five-level Model and Herzberg’s two-level. 18. Model. viii.
(12) 2. CHAPTER 1 INTRODUCTION. 1.1 Background of the Study. Many multi-national companies in the Philippines today have proven its worth and credibility in the market due to the exemplified necessity of their products which indeed helped improve the lives of people. The existence of these companies not only showed greater contribution in the country’s economic growth but also in other countries world wide. Electronic and insurance companies, financial institutions, computer softwares industry and car manufacturers are just some of the many organizations that have given a significant share in the country’s growth and development.. The nature of the business and its products apparently impacted the success of the company but the composition of the organization in order to function well lies not only in the elements such as materials and facilities, methods or work procedures, money or fund but also in the kinds of men or people who are working for the organization. Obviously, the people are considered to be the most important asset of all thus, more investment should be given to them.. A lot of studies have shown that in order for an employee to stay long in an organization and to highly perform and contribute in the achievement of the company’s goal should be given the right kind of motivation which mainly include higher pay, clear job responsibilities, conducive working condition, friendly working environment, mobility in the job functions and a lot more. Factors such as these are considered elements to Job Satisfaction.. Job Satisfaction is the extent to which a person derives pleasure from a job. 1.
(13) Locke (1976) defines it as “a pleasurable or positive emotional state resulting from the appraisal of one’s job or job experiences.” There are many factors contribute to how a person feels about a job. People can have different feelings about their co-workers and their pay, and both contribute to overall feelings about their jobs. There are workers who perform well because they are satisfied with the benefits they are receiving while the others enjoy working because of good relationship with their superiors.. Truly, there are many factors we can look into to know the job satisfaction of employees. Generally, it is still not conclusive that a satisfied worker performs well from a non-satisfied worker specifically if the type of workers fall under the category of a skilled or direct workers who are assigned in the plant.. This study in the relationship of Job Satisfaction and Employee Performance looked into the specific factors of job satisfaction in relation to performance. The research further assessed the Job Satisfaction Factors as presented in the Motivation theories of Maslow and Herzberg’s and how it relates to the result of the self-constructed Individual Performance Appraisal Sheet of a direct worker working in manufacturing plant and performing routinary job with less opportunity to grow in their career due their limited skills and knowledge. Specifically, this study aims to help top management plan better for the organization given the result of this study since this will give them a better and broader understanding of their employees specific job satisfaction factors and be able to develop more programs in order to enhance the level of job satisfaction of the employees. It is assumed that the result of this research study will surface a greater realization of the factors that may contribute to the direct workers’ job satisfaction and still maintain good performance despite the many cost-reduction activities the company is doing due to the present economic situation. 2.
(14) 1.2 Objectives. The purpose of the present study is to relate Job Satisfaction Variables and Personal Characteristics Variables to Performance of direct workers in a car manufacturing company.. Specifically, the research aims to answer the following questions: 1. What is the relationship of the following variables to the direct workers performance; a. Motivator Factors b. Hygiene Factors c. Overall Job Satisfaction Variables d. Personal Characteristics Variables. 2. What are the job satisfaction factors that highly contribute to the overall job satisfaction variables?. 1.3 Subject of the Study. Filipino direct workers or rank and file employees involve in the assembly of cars are the subject of the study. I chose Filipino respondents due to my current work location. The selected topic on job satisfaction also gave interest to me to study Filipino plant workers because there is no similar study conducted based on literatures. Culture of the organization was also considered since employees of the company are open for improvements especially in the areas that may motivate them to perform their job and stay long in the company. 3.
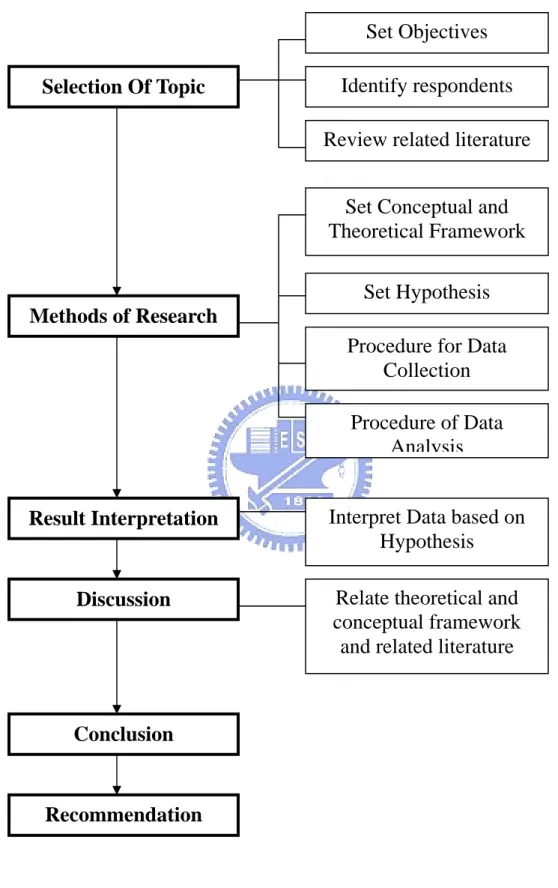
(15) 1.4 Procedure of the Study Set Objectives Identify respondents. Selection Of Topic. Review related literature Set Conceptual and Theoretical Framework Set Hypothesis Methods of Research Procedure for Data Collection Procedure of Data Analysis. Result Interpretation. Interpret Data based on Hypothesis. Discussion. Relate theoretical and conceptual framework and related literature. Conclusion. Recommendation. Figure 1. Procedure of the Study. 4.
(16) CHAPTER LITERATURE. 2 REVIEW. 2.1 Job Satisfaction. Job satisfaction is one of the most researched areas in Industrial and Organizational Psychology.. The subject has aroused so much interest. primarily because of three reasons.. The first reason is cultural in the sense that as a nation we value individual freedom, personal growth, and “opportunity”.. A work ethic also developed,. one that is formulated on the “pursuit of happiness,” to which work contributes. Thus, concern over whether people like their jobs, their freedom to express feelings, and their ability to alter their destiny through work are hallmarks of the country’s tradition.. We believe implicitly that everyone has a right to a. rewarding, satisfying job.. The second reason for interest in job satisfaction is functional. The concept of job satisfaction has intrinsic value, but research has shown that satisfaction is also related to other important variables like absenteeism, turnover, and performance.. Though we do not know if job satisfaction has a causal. relationship with these variables (for example, if high job satisfaction will cause a worker to be absent less often), we do know that feelings of high job satisfaction are associated with certain levels of these variables.. Because we. want less absenteeism, less turnover, and better performance, increasing job satisfaction might help in meeting these objectives.. Finally, there is a historical basis to job satisfaction research. 5. Research and.
(17) studies began in 1920s (i.e. Hawthorne studies). employees had strong feelings about work.. The research revealed that. Few years after (1935), the. Hoppock study appeared; it examined the factors affecting satisfaction on the job (fatigue, working conditions, supervision and achievement). In the late 1950s and early 1960s, attention was given to designing jobs that were more satisfying.. This early research was the nucleus for current work on changing. the environment (designing jobs) to improve work life.. 2.1.1. The Concept of Job Satisfaction. Job satisfaction is an emotional, affective response. Affect refers to feelings of like or dislike.. Therefore, job satisfaction is the extent to which a person. derives pleasure from a job.. Locke (1976) defines it as “a pleasurable or. positive emotional state resulting from the appraisal of one’s job or job experience.. Job satisfaction is strictly an individual response.. It was initially thought that people could have an overall feeling or liking for a job, ranging from very low to very high.. Later, it was learned that many. factors contribute to how a person feels about a job. People can have different feelings about their co-workers and their pay, and both contribute to overall feelings about their jobs.. 2.1.2. Theories of Job Satisfaction. Several theories have been proposed to explain why people are satisfied with their jobs. None of them have garnered a great deal of empirical confirmation, which suggests that job satisfaction is a complex phenomenon with many causal bases and that no one theory has been successful in incorporating all of them.. 6.
(18) Three Approaches to Studying Job Satisfaction. 1. Intrapersonal-Comparison Processes. According to McCormick and Ilgen (1980), “the most widely accepted view of job satisfaction assumes that the degree of affect experienced (by a person) results from some comparison between the individual’s standard and that individual’s perception of the extent to which the standard is met”.. Degree of. satisfaction is the difference between the standard and what is actually received from the job.. Intrapersonal-comparison theories compare what a person. wants (the standard) with what he or she receives. The smaller the difference, the greater the feeling of satisfaction.. These theories are called intrapersonal. because the comparison occur within each individual.. The standard and its derivation must be defined.. Some researchers believe. that standard consists of human needs. Needs are inborn and, it is believed, basic to everyone.. They are generally classified into two categories: physical. needs required for bodily functioning (air, water, food) and psychological needs required for mental functioning (stimulation, self-esteem, pleasure).. A. satisfying job would fulfill the basic physical needs (for example, adequate income) and provide self-esteem and personal recognition. Both Schaffer’s (1953) and Porter’s (1962) research exemplifies the view of job satisfaction as a function of need fulfillment.. Other researchers believe the standard is derived from human values rather than needs.. Values are what a person desire or seek to attain and are acquired over. time.. All people have the same basic needs, but they differ in what they value.. Values determine the choices people make as well as their emotional responses 7.
(19) to choices.. A satisfying job would then provide an opportunity to attain. valued outcomes.. The research of Locke (1969) and Mobley and Locke (1970). supports this view.. People certainly have different values, which explain differences in job satisfaction. Someone who valued monetary rewards and personal challenge would probably not be satisfied with a low-paying, routine job.. However,. someone who valued earning just enough to make ends meet without being mentally taxed might be quite satisfied with such a job.. 2. Interpersonal-Comparison Processes. The basis of the interpersonal-comparison theory is the belief that people compare themselves to others in assessing their own feelings of job satisfaction. Rather than being intrapersonal (based on need or values), comparisons are made within a social system – that is, interpersonally.. An individual observes. others in similar jobs and infers how satisfied they are.. The person compares. himself or herself to these other people and then derives feelings of satisfaction based on how they feel about their jobs (Salancik & Pfeffer, 1977).. The idea that social factors influence feelings of satisfaction is intuitively appealing.. Certainly a lot of research in social psychology indicates that we. assess ourselves by our perception of others. It therefore is reasonable to assume that social comparisons operate in job satisfaction.. 3.. Two-Factor Theory. Herzberg’s (1959) two-factor theory has two general classes of work variables: satisfiers, content factors that result in satisfaction, and dissatisfiers, context 8.
(20) factors that produce dissatisfaction. Certain factors were associated with high satisfaction and others with dissatisfaction. High satisfaction included such things as achievement, recognition, advancement, and the responsibility. Dissatisfaction were characterized by factors such as company policy, supervision, salary and working conditions. Herzberg said that when a job provides a lot of content factors- that is, a sense of recognition, achievement, and so on – the employee feel satisfied at work. When these factors are absent from a job – there is no sense of recognition, advancement, and so forth- the employee will not be dissatisfied but will feel neutral or indifferent toward the job. Alternatively, when a job provides a lot of context factors- such as good salary or pleasant working conditions- an employee will not feel satisfied but will feel neutral or indifferent toward the job. When these factors are absent from a job- poor salary or unpleasant working conditions- the employee will feel dissatisfied.. Thus, with satisfiers, a high degree of reward will result in. satisfaction and a low degree of reward will result in indifference.. Conversely,. with dissatisfiers, a high degree of reward will result in indifference and a low degree of reward in dissatisfaction. Thus, according to Herzberg, jobs should be designed so there will be a high degree of reward provided by both context factors (to avoid dissatisfaction) and content factors (to ensure satisfaction).. 2.1.3. Job Satisfaction and Performance. Two major studies (Brayfield & Crockett, 1955; Vroom, 1964) reached the general conclusion that they were related either not at all or only slightly. Subsequent research revealed that certain types of performance were more related to satisfaction than others.. This led to the belief that the way to have. productive workers is to first make them happy.. However, another view, the. opposite view is held: People get pleasure from their work after finding they are good at it – performance leads to satisfaction. 9.
(21) The relationship between how well you do your job and how happy you are in doing it has intrigued people for decades. On an intuitive level, many people think these two concepts should go together.. After all, most people like what. they are good at and dislike things they cannot do well.. Yet many research. studies have revealed there is little in common between performance and satisfaction.. Why? It seems both variables have complicated causes, and the. link between them is not as simple or direct as it might initially appear.. How. productive you are depends on your motivation, your ability, and having a work environment that permits you to be productive (for example, having good tools). How happy you are in your work depends on several factors: how happy you are in life and your general disposition, your expectations for your job, the reference group with whom you compare yourself.. Added to these. multidetermined concepts are the problems of measurement; there is always a certain amount of error in assessing how productive or happy we really are. When you add it all up, it probably is not all that surprising that we do not find consistently strong relationship between the two.. Jacobs and Solomons (1977) found that the relationship of satisfaction and performance are stronger in relationship when rewards are based on performance. Thus, people whose pay is based on performance (like salespeople on commission) should be more satisfied with their performance than others who are paid on an hourly rate (Cherrington, Reitz, & Scott, 1971).. Ialffaldano and Muchinsky’s (1985) review of satisfaction-performance studies revealed that the best estimate of the true correlation between the two concepts, controlling for a variety of statistical errors, is .17. This correlation is not nearly as great in magnitude as some theoreticians and practitioners would intuitively believe. Its implication is that organizational attempts to enhance both worker 10.
(22) satisfaction and performance simultaneously will likely be unsuccessful. The reason is that, for the most part, the two concepts are unrelated to each other. In fact, some organizational attempts to increase productivity may serve to decrease job satisfaction.. Weaver and Holmes (1975) collected information on demographic variables like age, marital status, education, and family income. Fifty-two percent of the respondents with full-time jobs and Fifty-three percent of the homemakers reported being very satisfied with their work. The difference between the two groups (1%) was not significant. The only significant difference occurred in families with an annual income they perceived as below the national average; in this case women who were homemakers were more satisfied than women who held full-time jobs. Apparently the latter were dissatisfied because they were still below the national average in spite of their financial contribution.. 2.2. Employee Performance. Performance, in theory, is the product of motivation and ability moderated by situational constraints. certain tasks.. Ability is the individual’s capability for performing. It is necessary but insufficient precursor of performance.. Motivation is the individual’s desire to demonstrate the behavior and reflects willingness to expend effort. Situational constraints refer to factors in the work environment that hinder performance.. When someone has (1) no ability,. (2) no motivation, or (3) pressing situational constraints, performance will be poor. If a person has no musical ability, all the motivation in the world will not make him or her a good musician.. People perform best when they have. the needed resources, abilities, and the desire to perform a task well. Motivation, therefore, is only one factor determining performance.. 11.
(23) Job Satisfaction has a weak relationship with job performance. Study shows that there is a stronger link when workers have control over their intentions and behaviors and when social constraints are taken into account. Social constraints include the norms, affiliation and other group pressures. This means that the social constraints in the work place depend on the intentions of the employee. If the social constraints turned out a negative effect in the employee, job satisfaction. becomes. weak. as. well. as. its. job. performance.. (www.hrm.strath.ac.uk 2005). A qualitative and quantitative review on the relationship of job satisfaction and job performance conducted to 312 samples revealed a low correlation (Judge, Thoresen, Bono and Patton, 2001).. D. Putman (1990) also concluded that job satisfaction and job performance are too closely linked to one another, and that they affect each other. He pointed that if a person is highly satisfied with his/her job, this would lead the person to want to do a good job and to perform well. On the other side is the person’s ability level. If the person is struggling with performing the job, it may give the appearance that the person is a poor performer even though he/she may be exhausting a great deal of effort in trying to perform the job. This person’s frustration then in turn leads to job satisfaction. In 2002, D. Putman conducted another study revealing that job satisfaction and performance will never be able to pinpoint an exact correlation. Doing a job well may improve job satisfaction, being satisfied may encourage a person to try harder, and each person’s personal value system will have an effect on how he/she reacts to motivators and impediments. It is best to understand that performance is a complex issue and recognize the where one must control to address issues affecting an individual’s performance.. 12.
(24) A study conducted to employees of an electronic company covered the dimensions of employee satisfaction which includes environment, salary/benefit, management practices, promotion, company profit sharing, and vision while for employee performance, factors such as character and ability, attitude of work, individual growth, outcomes and performance were included. Result showed that. employees. placed. higher. importance. on. “salary/benefit”. and. “environment”. Second is that Job satisfaction has significant positive relationship with personal performance. This means that higher job satisfaction, the higher the job performance. Lastly, different personal variables haven’t significant difference on employee satisfaction and performance (S. Lin, 2002).. Buciuniene et al (2005) concluded that total job satisfaction of doctors working at primary health care establishments in Lithuania is relatively low, and compensation, social status, and workload are among the key factors that condition doctors’ dissatisfaction with their job. Stamps and Piedmonte’s (2000) research shows that the more autonomy activities possess and the less monotony exists at work, the more employees are satisfied with their work.. Ubom and Joshua (2004) study showed that Needs Satisfaction variables such as physiological needs, security needs, social needs, self-esteem needs and self-actualization needs have significant and positive contributions in the prediction of job performance of employees. The possible reason for these findings is that a worker needs adequate and reasonable payment for him to satisfy his physiological needs like food, clothing, health-care and other needs in life. An employee needs adequate security especially at work place and at living place. He has to be given adequate payment for socialization with relations and friends. The organization must recognize his worth and ensure his dignity and self-esteem. There must be that understanding between an employee and the organization in the provision of needs. It is such understanding that 13.
(25) would make the employee to achieve self-fulfillment as a worker, and to work harder to achieve high job performance in the organization.. However, a work place whereby the workers feel that they are cheated, underpaid and are made to work in insecure conditions; where the organization has no regard for the workers’ dignity and self-worth; and the workers attribute the causes of their poor situation to the organization, they will not work hard and the level of job performance will be comparatively low. This is true because the workers are human beings with various needs to be satisfied. Failure to have such needs satisfied therefore leads to frustration, nonchalant attitude to work and rebellion.. 2.2.1. Influence of Communication on Performance. We can view performance on a number of levels, including individual task performance, group productivity, and the effectiveness of entire organizations. Research shows that communication does influence performance.. We have. long known that knowledge of results and feedback facilitates performance. Whether the feedback comes from the organization, a supervisor, co-workers, or the task itself (Greller & Herold, 1975), it has both informational and motivational components. Feedback focuses attention on relevant aspects of the task and gives direction as to which behaviors are most desirable or appropriate. Feedback improves job performance in many tasks, ranging from visual search (Mudd& McCormick, 1960) to complex decision-making (Schmitt, Coyle, & Saari, 1977).. 14.
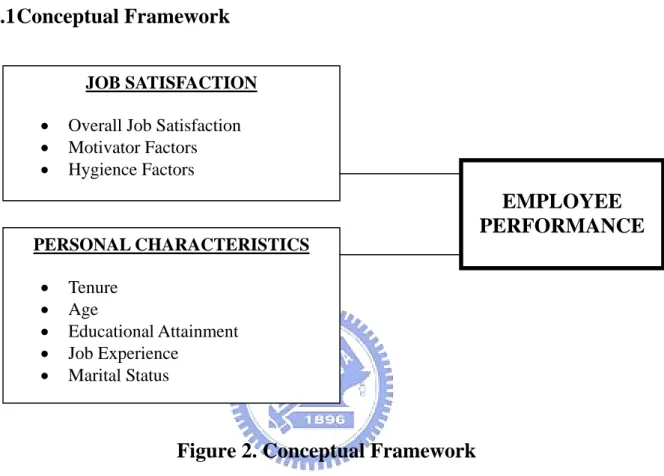
(26) CHAPTER. 3. METHODOLOGY. 3.1 Conceptual Framework JOB SATISFACTION • • •. Overall Job Satisfaction Motivator Factors Hygience Factors. EMPLOYEE PERFORMANCE PERSONAL CHARACTERISTICS • • • • •. Tenure Age Educational Attainment Job Experience Marital Status. Figure 2. Conceptual Framework. The Job Satisfaction variables which includes Overall Job Satisfaction, Motivator Factors and Hygience Factors are variables that have been shown to influence employee performance. These variables will be correlated with employee performance.. The Personal Characteristics variables of tenure, age, educational attainment, job experience and marital status are assumed to affect employee performance. These variables will be correlated with employee performance.. 15.
(27) 3.2 Theoretical Framework. The theory of Herzberg’s two-factor model developed by Dr. Frederick Herzberg and the theory of Hierarchy of Needs of Dr. Abraham H. Maslow will be used to support the study. This model presents the major motivational factors that will help explain how employees are motivated and satisfied.. The two-factor theory of Dr. Herzberg. The basic assumptions of this two-factor theory are as follows: • The factors contributing to job satisfaction are separate and distinct from those that lead to job dissatisfaction. That is : (1) the presence of certain job factors contributes to job satisfaction, while their absence is perceived as a “neutral” condition (not dissatisfaction); and conversely, (2) the presence of certain other job factors leads to dissatisfaction; while their absence leads to a neutrally perceived condition, but not to satisfaction. • Among those factors associated with satisfaction, “motivators” are primarily ones intrinsic to the individual’s job - e.g., achievement, recognition, and opportunity for growth and self actualization. • Conversely, the factors which are associated with dissatisfaction (“hygiene” factors) are primarily extrinsic to a person’s job, such as company policies, salary, and working conditions.. The two-factor theory postulates that the “motivators” are effective in creating motivation of individuals toward better performance; but the “hygiene” factors are not. For example, greater opportunities for self-actualization would serve as 16.
(28) an effective motivator, while improving poor working environment (a “hygiene” factor) would not.. Hierarchy of Needs of Dr. Maslow. According to Dr. A. H. Maslow, a person’s wants are always increasing and changing. Once an individual’s basic (primary) needs have been satisfied, other (secondary) needs take their place. To satisfy these needs, people expend energy. However, once a need has been somewhat satisfied, it no longer acts as a motivating force, individuals then begin to invest their energy in the next higher level need.. Maslow’s theory of motivation stresses that people are motivated to satisfy many needs, some of which are more pressing than others. If a number of needs are unsatistfied at any given time, the individual will move to satisfy the most pressing one(s) first.. Maslow identified five levels in his hierarchy of needs.. The physiological needs are the most pressing. Once our physiological needs are largely satisfied, the next level of needs in the hierarchy begins to emerge. These are our safety needs, among which is the avoidance of physical harm, illness, economic disaster, and so forth. In a similar manner, satisfaction of our safety gives rise to the emergence of social needs, then esteem needs, until the satisfaction of all the above leads the individual to be primarily concerned with the highest level needs, those of self-actualization.. Maslow believes that all levels of needs probably exist to some degree for the individual most of the time. Rarely, if ever, is any one need completely 17.
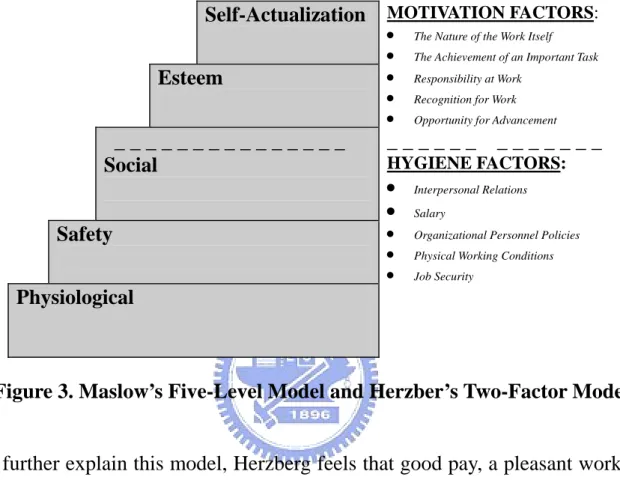
(29) satisfied…at least for very long. Our hunger, as a simple example, may be fairly satisfied after eating breakfast, only to emerge again before lunch time. MASLOW’S FIVE-LEVEL MODEL and HERZBERG’S TWO-FACTOR MODEL. Self-Actualization Esteem _______________ Social. MOTIVATION FACTORS: • The Nature of the Work Itself • The Achievement of an Important Task • Responsibility at Work • Recognition for Work • Opportunity for Advancement. ______ _______ HYGIENE FACTORS:. • • • • •. Safety. Interpersonal Relations Salary Organizational Personnel Policies Physical Working Conditions Job Security. Physiological. Figure 3. Maslow’s Five-Level Model and Herzber’s Two-Factor Model. To further explain this model, Herzberg feels that good pay, a pleasant working environment, and adequate supervision might be regarded as “hygiene” factors in much the same sense that brushing one’s teeth and bathing with soap removes factors that would prevent good health. Similarly, sound company policies and adequate vacations remove some possible causes of dissatisfaction and poor productivity. But they do not provide positive incentives to produce. The real “motivators” are such things as a sense of achievement, interesting work, and personal growth and recognition.. However, hygiene factors are also essential in maintaining a normal state of corporate health with regard to employee relations. When one or more of these hygiene factors deteriorate to a point considered unacceptable by the employees, there is job dissatisfaction. 18.
(30) 3.3 Hypothesis. The following are the hypothesis of this study:. 1. The Overall Job Satisfaction Variable will be positively related to Employee Performance. 2. The Motivator Factors Variables will be positively related to Employee Performance. 3. The Hygiene Factors Variables will be positively related to Employee Performance. 4. Personal Characteristics Variables will be positively related to Employee Performance.. 3.4 Operational Definition. Base on the study of related literature, the definition of the each factors are the following:. 1. Overall Job Satisfaction – comes in two forms namely Motivator Factors and Hygiene Factors. 2. Motivator factors – are those intrinsic to a person’s job. These include the following:. a. Clarity of Goals – The feeling the employees have about how well the organization’s objectives are understood and accepted. Is the mission clear? Do employees understand their goals? Are we managing by objectives? A high score indicates an affirmative answer; a low score indicates room for improvement. 19.
(31) b. Job Interest and Challenges – How interesting is the work? Are employees committed to what they are doing? Does it really matter? Do they find challenge in their work? c.. Standards of Excellence – The feeling employees have about management’s emphasis (or lack of it) on doing a quality job. Are the standards high? Or can you “get by” ?. d. Degree of Responsibility – The feeling employees have about the amount of responsibility they have and the latitude, or area of freedom within which they can operate without constant checking by the boss. e. Personal. Development. –. The. feeling. employees. have. about. management’s concern for their growth and development. A much emphasis placed on training, counseling and assessment. b. Advancement/Mobility – The feeling employees have about the opportunities they have to move ahead, be considered for promotion, and have a career path. c. Management’s Credibility – The feeling employees have with regards to how “straight” management in dealing with them. Is the management respected for its fairness? Or is it seen as “two – faced”? d. Self –Confidence – The feeling employees have about their own value and mobility in the labor market. The sense of worth and a realization that there is a good future – either here or elsewhere.. 3. Hygiene Factors – are those extrinsic to a person’s job. These include the following:. e. Rewards and Satisfactions – The degree to which the employees feel the work is rewarding and that they are being recognized and satisfied for good performance. The dimension taps both intrinsic (e.g. job satisfaction) and extrinsic (e.g. salary) rewards. 20.
(32) f. Working Relationships – The feeling employees have with regards to the amount of trust, cooperativeness, understanding, and warmth that exists among workers and between workers and management. g. Job Security – Are people laid off because of economic trends, politics, and poor performance? Or do the employees see the organization as dependable and their own jobs as secure? h. Personnel Policies and Procedures - are company policies administered fairly? Does the company have competitive wage and salary scales? Are employee benefits attractive?. 4. Performance Result – is the final rating of the employee based on the Individual Performance Appraisal Sheet (IPAS) developed by the company. 5. Personal Characteristics Variables. a. Tenure – the respondent’s length of stay (# of years) in the company. b. Age – the current age of the respondent. c. Educational Attainment – the respondent’s highest level of education attained. d. Job Experience – the respondent’s job experience in terms of its count in the company he worked with. e. Marital Status – the respondent’s condition of being married or unmarried.. 6. Direct Workers – rank and file employees tasked to perform car assembly from Body, Paint and Car Erection Shops.. 21.
(33) 3.5 Company Background. The company under study is one of the leading Car Manufacturers in the Philippines. The company is engaged in the field of car assembly and was founded in April 28, 1982. Its production started in September 1983 at the Quezon City Plant.. In April 1997, its production started at the Sta. Rosa Assembly Plant and was certified by BVQI for ISO9002 in December 1999.. At present, the company is geared towards the goal of becoming the top 3 automotive company in the Philippines. Through its I-STEP-IC Core Values, namely: Integrity, Shared Vision, Teamwor, Excellent Quality, Proactive Service, Innovation and Continuous Improvement, the company is on its way to develop a culture of Excellence and Quality that will satisfy not only the needs of external customers but also its internal customers, its employees.. 3.6 Participants. The Manufacturing Process Group of the Manufacturing, Engineering and Quality Division was the unit studied since it’s the main work force of the organization. Out of one hundred two (102) direct workers,. Fifty Five (55). were the respondents of this study. They were automotive technicians who were considered direct workers or rank and file employees involved in car assembly with final rating in their Individual Performance Appraisal Sheet (IPAS) indicated in the employee masterlist.. The researcher received fifty five (55) completed questionnaires. Their average tenure, age, educational attainment, job experience, and marital status are 8.18 22.
(34) years, 31.74 years old, 1.5 or 51% High School Graduates, 2nd job and 1.59 or 60% married, respectively.. 3.7 The tool to measure. The following information were asked of the participants of this study in order to describe accurately their personal characteristics:. 1. Tenure or years of stay in the company 2. Age 3. Educational Attainment 4. Number of Job Experience 5. Marital Status. Job Satisfaction Factors. A sixty (60) items survey form of organizational climate was used to measure job satisfaction of respondents. The questionnaire was a standard questionnaire with reliability and validity. This questionnaire was purchased from Training House Consultancy and had been used for research by a Telecommunication Company in 1998 in order to measure the Organizational Climate of the Company and identify the factors that motivates employees. This questionnaire is divided into 12 categories with 5 items for each category and consisted of a 4-point scale with verbal anchors ranging from 1 (Strongly Agree) to 4 (Strongly Disagree). The 12 categories are: Clarity of goals, Job Interest and Challenge, Rewards and Satisfactions, Standards of Excellence, Degree of Responsibility,. Personal. Development,. Working. Relationships,. Advancement/Mobility, Job Security, Management’s Credibility, Personnel Policies and Procedures and Self-Confidence. 23.
(35) Employee Performance Appraisal Result. The 2004 result of the Individual Performance Appraisal Sheet (IPAS) was used in correlating with job satisfaction variables and personal characteristics variables. This IPAS is developed under the Company’s Challenge and Execute (C&E) System which is designed as a support tool for attaining the Company Vision, Mission and Targets. Furthermore, this is a system where the objectives and strategies of top management are broken down into activities and targets cascaded in succeeding levels of the organization. Specifically, the IPAS documents the assessment on the performance of rank and file employees in terms of Skill and Knowledge, Quality of Job, Implemented Suggestions, Accident Rate, Attendance Rate and Compliance to Company Policies. Details of the system are as follows:. Performance Management System Definition and Objectives of Performance Management. The Performance Management System (PMS) is an integrated set of procedures and systems focused on setting, gathering, processing and monitoring performance data.. It is an organization’s system for identifying its goals and. objectives and assessing how each employee helps the organization reach those goals.. The main objectives of Performance Management are: • To determine performance measures at the organization, unit and individual levels • To manage the attainment of performance standards or targets through 24.
(36) regular monitoring, appraisal and support • To identify training requirements to build on relevant competencies • To link individual performance to promotions and rewards. The benefits of a Performance Management System are: • Provides a means to “operationalize” the strategic objectives of the company and to assess its position in terms of fulfilling its long-term goals • Communicates strategic goals downward through the organization and to employees through incentives aligned with performance measures and goals • Enhances the non-financial management of the company • Initiates a root cause analysis for actual performance results that are below target • Communicates key strengths and areas for improvement • Puts responsibility for producing results on process owners • Provides a link between performance results and promotions, rewards and career development. The Performance Management System has two major components, Performance Measurement (PM) and Performance Appraisal (PA). The PM Process defines organization, unit and individual performance measures that are driven by strategy and linked to business processes.. The PA. Process, on the other, covers the actual evaluation of units and individuals against the defined performance measures, standards and competency requirements.. The PM Process provides inputs to the PA Process by. determining the performance standards against which the evaluation of a unit or individual will be done.. 25.
(37) Performance Measurement. Performance Measures are quantifiable measures that can track performance over time, within and across units in the organization. Performance Measurement, therefore, is a process of defining performance measures and assessing actual performance against set targets or standards.. Performance Measurement facilitates the attainment of corporate goals and objectives by helping the units focus on the most critical activities and processes. It provides opportunities for the different units to set their own targets aligned to the corporate goals and objectives.. Performance Measurement, or the setting of targets, is the first step in the Performance Appraisal process.. When performance measures are. identified, they provide a basis for assessing performance of a unit or job against set targets.. The objectives of measuring performance are: • To link performance measures to the strategic objectives of the organization • To encourage continuous improvement by highlighting goals and recognizing outstanding achievements • To enable all personnel to better understand how their jobs contribute to achieving strategic objectives • To encourage teamwork through team-oriented goals and by encouraging a process view of the organization • To provide each individual with the shared vision and decision support information necessary to make informed and decentralized decisions 26.
(38) • To evaluate the effectiveness of implemented solutions and improvement processes. Performance Appraisal. The success of the company depends on the performance of its people. The Performance Appraisal (PA) Process is a key mechanism for linking personal performance and objectives to business performance and objectives. It is the on-going process of setting targets and measuring an individual’s ability, interest, characteristics and performance against a predefined set of criteria that support the Company’s goals and objectives. It involves coaching, providing feedback and engaging in open and constructive discussion between superior and subordinate so that performance at the individual and unit level can be improved.. Challenge and Execute System The CHALLENGE & EXECUTE (C&E) System is designed as a supplementary support to attaining the company vision and mission. It is a primary tool to ensure that the company objectives and targets are cascaded to the lowest level of management and that these targets are monitored through reports submission.. This system was likewise developed to implement a more systematic way of appraising the performance of the employees that is more appropriate, measurable and objective to the specific functions of the employee. Under the system, Supervisors and Managers will be appraised based solely on performance against set targets.. For the Team Players (Rank & File. employees), the achievement of targets shall be a major criteria for their 27.
(39) appraisal.. This system shall also complement the evaluation system of. measuring the team players’ business and technical competency.. The C&E Individual Performance Appraisal Sheet (IPAS) documents the assessment of the Team Players’ (Rank & File employees) performance in terms of the following criteria: • Skills and knowledge level -. measures the technical, business and professional competency of the. employee. • Quality of job - measures achievement of targets as defined by Department/ Section heads, cascaded from C&E - 0 Policy Management and C&E - 2 (Business Targets & Progress Report) forms.. This also Includes. assessment of how efficient and productive the employee was in performing his job. • Implemented suggestions - employees are given merits for coming up and initiating improvement activities, within his work unit and/ or other section/ departments. • Accident rate - applies to direct workers, those working in the Assembly Line. Employees are given demerits for accidents due to negligence • Attendance rate -. measures the number of days the employees were able to report for. work after considering absences and tardiness. • Violation of Company policies/ rules and regulations -. employees are given demerits for noncompliance with Company. polices and regulations.. 28.
(40) Purpose & Objectives • To improve employee’s awareness about achieving their respective targets in the attainment of overall company targets. • To determine and measure employee’s performance in a fair and more accurate way. • To. improve. communication. skills. between. the. superiors. and. subordinates. • To serve as basis for giving merit increases and future promotion.. 3.8 Data Collection Procedure. Participants were direct workers or technicians of the Manufacturing Process Group specifically belonging to Body, Paint and Car Erection Shops.. Data were collected by means of a questionnaire (See Appendix A) which was administered to selected respondents of the study by the Human Resources Specialist. The respondents answered the questionnaire after their lunch break and was retrieved immediately after they finished answering.. After the data were gathered, tabulation was done and all negatively phrased items was reversed from 4 to 1. 1 is the highest and 4 as the lowest. Test of reliability using Internal Consistency method was also used to get the Cronbach Alpha Coefficient of each variable using SPSS 10.0 for Windows. Below is the table for Reliability Analysis Scale (Alpha) of Job Satisfaction Factors and the items for each factor that are negatively phrased.. 29.
(41) Table 1 RELIABILITY ANALYSIS SCALE OF OVERALL JOB SATISFACTION Overall Job Satisfaction. .8739 Table 2. RELIABILITY ANALYSIS SCALE OF JOB SATISFACTION FACTORS Job Satisfaction Factors Clarity of Goals Job Interest and Challenge Rewards & Satisfactions Standard of Excellence Degree of Responsibility Personal Development Working Relationships Advancement & Mobility Job Security Management’s Credibility Personnel Policies and Procedures Self-Confidence. Coefficient Alpha .4281 .5950 .5651 .3488 .4575 .4387 .3595 .1686 .2977 .4980 .3736 .2499. Table 3 ITEMS THAT ARE NEGATIVELY PHRASED Job Satisfaction Factors Clarity of Goals Job Interest and Challenge Rewards & Satisfactions Standard of Excellence Degree of Responsibility Personal Development Working Relationships Advancement & Mobility Job Security Management’s Credibility Personnel Policies and Procedures Self-Confidence. Items that are negatively phrased 13 and 49 26 and 50 3 and 27 16 and 40 53 18 and 42 19 and 43 8, 32 and 56 33 22 and 46 59 12, 24, 48 and 60 30.
(42) The final summary of frequency distribution, mean and standard deviation of all variables are in Appendix B.. 3.9 Data Analysis. Datas gathered were analyzed by using Pearson r (r) correlation coefficient through SPSS 10.0 for windows at .05 level of significance. These tested the correlation of job satisfaction variables, personal characteristics variables and employee performance.. 31.
(43) CHAPTER. 4. RESULT. Job Satisfaction Variables which include Motivator Factors, Hygiene Factors & Overall Job Satisfaction and Personal Characteristics Variables, were the major variables tested to correlate with Employee Performance. These are shown in Tables 4 to 7 while the profile of the respondents, the means and standard deviations are shown in Table 8.. 4.1 Result based on Hypothesis Table 4 Hypothesis 1 Correlation of Overall Job Satisfaction Variable to Employee Performance Variable Variable. Mean. Overall Job Satisfaction Note: N=55 *p < 0.01 level **p < 0.05 level. 129.96. Std. Dev. 17.83. Pearson Correlation (r) Employee Performance -.267*. Table 4 shows that the Overall Job Satisfaction variable (r=-.267, p<.01) is low but significant negative correlations with employee performance variable.. 32.
(44) Table 5 Hypothesis 2 and 3 Correlation of Motivator Factors and Hygiene Factors to Employee Performance Variable Variables Motivator Factors Hygiene Factors Note: N=55. Mean 86.78 43.18. Std. Dev. 12.25 6.61. Pearson Correlation (r) Employee Performance -.305 -.154*. *p < 0.01 level **p < 0.05 level. Table 5 shows that the Motivator variable (r=-.305, p<.01) is low and negatively correlated with employee performance variable while Hygiene variable (r=-.154, p<.01) is low but significant negative correlation with employee performance. Table 6 Hypothesis 4 Correlation of Personal Characteristics Variables to Employee Performance Variable Variables. Mean. Tenure Age Educational Attainment Job Experience Marital Status. 8.18 31.74 1.5 2.06 1.59. Std. Dev. 6.72 12.27 .5 1.20 .49. Pearson Correlation (r) Employee Performance .091 .052 .123 .083 .043. Table 6 shows that there are no significant correlations between Personal 33.
(45) Characteristics variables and Employee Performance.. 4.2 Result based on Job Satisfaction Factors and Overall Job Satisfaction Correlation. Table 7 Correlation of Job Satisfaction Factors and Overall Job Satisfaction Variable Variables Mean Pearson Correlation SD (r) Overall Job Satisfaction Clarity of Goals 2.19 .51 .696** Job Interest and Challenge 2.03 .51 .757** Rewards & Satisfactions 2.37 .70 .598** Standard of Excellence 2.14 .57 .622** Degree of Responsibility 2.04 .26 .669** Personal Development 2.17 .53 .416** Working Relationships 2.00 .31 .536** Advancement & Mobility 2.35 .46 .476** Job Security 2.18 .33 .582** Management’s Credibility 2.19 .37 .622** Personnel Policies and Procedures 2.31 .24 .561** Self-Confidence 2.82 .62 .681** Note: N=55 *p < 0.01 level **p < 0.05 level. Table 7 shows that Job Interest and Challenge (r=.757, p<.05), Clarity of Goals (r=.696, p<.05), Self-Confidence (r=.681, p<.05), Degree of Responsibility (r=.669, p<.05), Standard of Excellence (r=.622, p<.05) and Management Credibility (r=.622, p<.05) variables are significantly high and positively correlated with Overall Job Satisfaction variable.. Rewards and Satisfactions (r=.598, p<.05), Job Security (r=.582, p<.05), 34.
(46) Personnel Policies and Procedures (r=.561, p<.05) and Working Relationships (r=.536, p<.05) variables are significant and moderately high in correlation with Overall Job Satisfaction variable.. Advancement and Mobility (r=.476, p<.05) and Personal Development (r=.416, p<.05) are low but significant in correlation with Overall Job Satisfaction variable.. 4.3 Result based on Respondents Personal Characteristics Table 8 Profile of the Respondents according to tenure, age, educational attainment, job experience and marital status. Mean Standard Deviation Variables Tenure 8.18 6.72 Age 31.74 12.27 Educational Attainment 1.5* .5 Job Experience 2.06 1.20 Marital Status 1.59** .49 *Coded as 1 for High School Graduate employees representing 51% of the respondents. ** Coded as 1 for Single employees representing 40% and 2 for Married representing 60% of the respondents.. Table 8 shows the profile of the respondents according to tenure, age, educational attainment, job experience, and status. Average tenure, age, educational attainment, job experience and marital status are 8.18 years, 31.74 years old, 1.5 or 51% High School Graduates, 2nd job and 1.59 or 60% married, respectively.. 35.
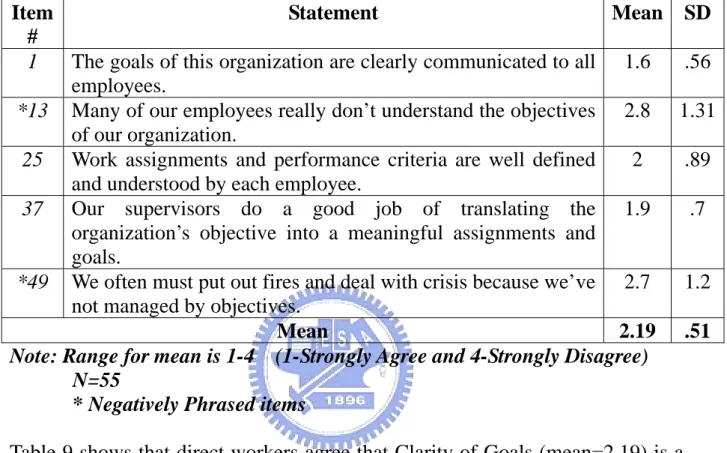
(47) 4.4 Result based on Job Satisfaction Factors Table 9 Mean and Standard Deviation (SD) of Clarity of Goals Factor Item Statement Mean SD # The goals of this organization are clearly communicated to all 1.6 .56 1 employees. *13 Many of our employees really don’t understand the objectives 2.8 1.31 of our organization. 2 .89 25 Work assignments and performance criteria are well defined and understood by each employee. .7 37 Our supervisors do a good job of translating the 1.9 organization’s objective into a meaningful assignments and goals. 1.2 *49 We often must put out fires and deal with crisis because we’ve 2.7 not managed by objectives. Mean 2.19 .51 Note: Range for mean is 1-4 (1-Strongly Agree and 4-Strongly Disagree) N=55 * Negatively Phrased items Table 9 shows that direct workers agree that Clarity of Goals (mean=2.19) is a factor to job satisfaction. Specifically, they agree that the goals of the organization are clearly communicated to them (1.6) and that their supervisors do a good job of translating the organization’s objective into a meaningful assignments and goals (mean=1.9). Work assignments and performance criteria are well defined and understood by them (mean=2) and that objectives of the organization are understood (mean=2.8) which proves that somehow the organization is managing by objectives (mean=2.7). 36.
(48) Table 10 Mean and Standard Deviation (SD) of Job Interest and Challenge Factor Item Statement Mean SD # Employees here believe in what they are doing. 1.6 .49 2 1.7 .62 14 My work here is very interesting. *26 Many of our employees feel that their jobs are dull and 2.8 1.21 unchallenging. .63 38 Employees here have a high degree of commitment to the 1.8 work they are doing. .81 *50 It’s very hard for supervisors to make a lot of the jobs 2.3 challenging or interesting to employees. Mean 2.03 .51 Note: Range for mean is 1-4 (1-Strongly Agree and 4-Strongly Disagree) N=55 * Negatively Phrased items Table 10 shows that direct workers agree that Job Interest and Challenge (mean=2.03) is a factor to job satisfaction. Specifically, they believe in what they are doing (mean=1.6), their work is very interesting (mean=1.7) and they have a high degree of commitment to the work they are doing (mean=1.8). Though some supervisors are quite having a hard time making the job challenging or interesting to their workers (mean=2.3), they still feel that their jobs are not dull and challenging (mean=2.8). 37.
(49) Table 11 Mean and Standard Deviation (SD) of Rewards and Satisfactions Factor Item Mean SD Statement # .8 *3 There isn’t enough recognition for doing good work around 3.5 here. .61 15 My supervisor often lets me know how pleased he/she is with 1.9 my work. 2.6 1.26 *27 A lot of people feel that the work here is not too satisfying. .81 39 Raises, promotions, and other rewards are given in proportion 2.1 to our performance on the jobs. 1.8 .64 51 Working here has been a very satisfying experience. Mean 2.37 .70 Note: Range for mean is 1-4 (1-Strongly Agree and 4-Strongly Disagree) N=55 * Negatively Phrased items Table 11 shows that direct workers agree that Rewards and Satisfactions (mean=2.37) is a factor to job satisfaction. Specifically, they find working in the company as a satisfying experience (mean=1.8) and that their supervisors let them know how pleased they are with their work (mean=1.9). Raises, promotion, and other rewards are given in proportion to their performance on the jobs (mean=2.1) and that they feel satisfied with their work (mean=2.6). This also shows that these employees feel that there is enough recognition for doing a good work in the company (mean=3.5).. 38.
(50) Table 12 Mean and Standard Deviation (SD) of Standard of Excellence Factor Item Mean SD Statement # You have to work hard to meet our high standards of 1.6 .72 4 performance. *16 People here don’t seem to take much pride in the quality of 2.9 1.19 their job. 1.9 .5 28 The standards here are challenging and require effort to meet. .88 *40 We have a number of employees who manage to get by 2.5 without meeting performance standards or work group expectation. .68 52 The standards are high and management sees to it that 1.7 employees turn in a quality performance. Mean 2.14 .57 Note: Range for mean is 1-4 (1-Strongly Agree and 4-Strongly Disagree) N=55 * Negatively Phrased items Table 12 shows that direct workers agree that Standards of Excellence (mean=2.14)is a factor to job satisfaction. Specifically, they believe that they have to work hard in order to meet the high standard of performance (mean=1.6) which management has set for them to turn in a quality performance (mean=1.7). This also shows that the set standards are challenging and require them effort to meet (mean=1.9). Because of this they somehow manage to meet the performance standard or work group expectation (mean=2.5) and take much pride in the quality of their job (mean=2.9).. 39.
(51) Table 13 Mean and Standard Deviation (SD) of Degree of Responsibility Factor Item Statement Mean SD # Employees here are encouraged to take initiative and make 2.1 .78 5 decisions on their own. .66 17 My job carries a lot of responsibility to solve problems and 1.9 make decision. .71 29 We have to go to our supervisor to get approval on things that 1.9 we should have responsibility for. .61 41 Although employees of some companies are just a name and 1.9 number, around here everyone is important and has a lot of responsibility. *53 The majority of our employees know that they are in jobs that 2.5 1.19 do not carry much responsibility. Mean 2.04 .26 Note: Range for mean is 1-4 (1-Strongly Agree and 4-Strongly Disagree) N=55 * Negatively Phrased item Table 13 shows that direct workers agree that Degree of Responsibilities (mean=2.04) is a factor to job satisfaction. Specifically, their job carries a lot of responsibility to solve problems and make decision (mean=1.9) that even they need to go to their supervisors for approval on things that they need to do (mean=1.9) they still feel important in their responsibilities (mean=1.9). They are encouraged to take initiative and make decision on their own (mean=2.1) and generally, they know that they are in a job that carry much responsibility (mean=2.5).. 40.
(52) Table 14 Mean and Standard Deviation (SD) of Personal Development Factor Item Statement Mean SD # We are very good about giving employees training and 1.5 .5 6 coaching to help them develop fully. *18 Many employees never received adequate training, but were 2.6 1.27 simply “thrown in” to sink or swim. 2 .77 30 I received excellent training when I first took this job. *42 We do not do a very effective job of training and developing 2.8 1.18 the majority of our employees. 2 .7 54 Supervisors often sit down with subordinates to discuss performance, growth and development. Mean 2.17 .53 Note: Range for mean is 1-4 (1-Strongly Agree and 4-Strongly Disagree) N=55 * Negatively Phrased items Table 14 shows that direct workers agree that Personal Development (mean=2.17) is a factor to job satisfaction. Specifically, they believe that they were given very good training and coaching to help them develop fully (mean=1.5), received excellent training when they first took their job (mean=2) and their supervisors often sit down with them to discuss their performance, growth and development (mean=2). “Throwing in” to sink or swim without receiving adequate training is somehow disagreeable for them (mean=2.6) as well as ineffectiveness of training and developing them (mean=2.8).. 41.
(53) Table 15 Mean and Standard Deviation (SD) of Working Relationships Factor Item Statement Mean SD # A friendly atmosphere and team spirit prevails throughout our 1.8 .71 7 organization. .89 *19 Petty conflicts and poor working relationships eat up a lot of 2.5 time and energy around here. .81 31 Employees here are cooperative and understanding, pitching 1.9 in to help one another out. *43 People don’t trust one another or cooperate nearly enough 2.1 1.16 around here. .59 55 Communications are very healthy here, among employees and 1.7 between management and workers. Mean 2.0 .31 Note: Range for mean is 1-4 (1-Strongly Agree and 4-Strongly Disagree) N=55 * Negatively Phrased items Table 15 shows that direct workers agree that Working Relatiosnships (mean=2.0) is a factor to job satisfaction. Specifically, they find communications among employees and between them and management as very healthy (mean=1.7), that there is a friendly atmosphere and team spirits prevailing throughout the organization (mean=1.8) and that employees are cooperative and understanding by pitching in to help one another out (mean=1.9). Although lack of trust seems prevalent (mean=2.1), petty conflicts and poor working relationship do not eat up a lot of time and energy in their work area (mean=2.5).. 42.
(54) Table 16 Mean and Standard Deviation (SD) of Advancement/Mobility Factor Item Statement Mean SD # *8 There are a lot of qualified people around here who have not 3.1 1.17 gotten promotions they deserved. .7 20 It’s easy to get ahead and advance around here if you have the 1.8 skills and experience. .71 *32 Many of our employees could have advanced a lot further in 2.3 other organizations. .79 44 Career opportunities are very good here, with many different 2.1 chances for getting ahead. .84 *56 The possibilities for promotion and advancement are rather 2.4 limited here. Mean 2.35 .46 Note: Range for mean is 1-4 (1-Strongly Agree and 4-Strongly Disagree) N=55 * Negatively Phrased items Table 16 shows that direct workers agree that Advancement/Mobility (mean=2.35) is a factor to job satisfaction. They feel that having the skills and experience, they can easily get ahead and advance in the organization (mean=1.8). They see a lot of qualified people in the organization that have gotten promotions they deserved (mean=3.1) and that career opportunities are found very good in the company with many different chances for getting ahead (mean=2.1). They can somehow see possibilities for promotion and advancement (mean=2.4). However, they also see the possibilities to advanced further in other organization (mean=2.3).. 43.
(55) Table 17 Mean and Standard Deviation (SD) of Job Security Factor Item Statement Mean # From time to time employees are laid off because of economic 1.8 9 factors and the need to cut costs. 2.1 21 Job Security is better here than in many organizations. *33 Employees whose performance is consistently marginal are 2.7 usually terminated. 45 Ours is the type of organization where employees are rarely let 2.3 go except for serious violations. 2 57 As long as you turn in acceptable performance, you know that you will not lose your job. Mean 2.18 Note: Range for mean is 1-4 (1-Strongly Agree and 4-Strongly Disagree) N=55 * Negatively Phrased items Table 17 shows that direct workers agree that Job Security (mean=2.18) is a factor to job satisfaction. They believe that as long as they turn in acceptable performance, they will not lose their job (mean=2) which also shows that they see better job security in the company they are currently working with (mean=2.1). They agreed that though from time to time employees are laid off because of economic factors and the need to cut cost (mean=1.8), and that the company somehow lets go of its employees, especially for serious violations (mean=2.3). They don’t fully agree that employees whose performance is consistently marginal are terminated (mean=2.7).. 44. SD .55 .67 .86 .76 .69 .33.
(56) Table 18 Mean and Standard Deviation (SD) of Management’s Credibility Factor Item Statement Mean # 10 I think that our employees have a high respect for the current 1.8 management team. *22 Management sometimes tends to be “two-faced,” saying one 2.6 thing but believing or doing another. 34 The management here is well respected for dealing fairly with 2.1 employees. *46 Management often plays favorites here: who you know counts 2.5 as much as how you perform. 2 58 You can trust our management and believe what they say (i.e., they are “good to their word”). Mean 2.19 Note: Range for mean is 1-4 (1-Strongly Agree and 4-Strongly Disagree) N=55 * Negatively Phrased items Table 18 shows that direct workers agree that Management’s Credibility (mean=2.19) is a factor to job satisfaction. They agree that they have high respect for the current management team (mean=1.8) and that the management can be trusted and believed in what they say (mean=2). They also agree that the management is well respected for dealing with them (mean=2.1). Playing favorites as in the case of who you know counts as much as how you perform is somehow agreeable (mean=2.5) as well as management who tends to be “two-faced” sometimes, saying one thing but believing or doing another is slightly disagreeable (mean=2.6).. 45. SD .48 .94 .71 .85 .73 .37.
(57) Table 19 Mean and Standard Deviation (SD) of Personnel Policies and Procedures Factor Item Statement Mean SD # .87 11 Our supervisors understand the organization’s policies and 2.0 procedures and apply them fairly. .98 23 Our employee benefits package (hospitalization, insurance, 2.2 pension, etc.) is very attractive. .9 35 Most people here are getting pretty much the same as they 2.5 would make doing the same work elsewhere. .72 47 Raises and promotion around here are given without regard to 2.2 sex, color, or religion. *59 Many employees are unhappy about the way personnel 2.6 1.23 matters are handled here. Mean 2.31 .24 Note: Range for mean is 1-4 (1-Strongly Agree and 4-Strongly Disagree) N=55 * Negatively Phrased item Table 19 shows that direct workers agree that Personnel Policies and Procedures (mean=2.31) is a factor to job satisfaction. They agree that organization’s policies and procedures are understood and applied by their supervisors in their work (mean=2.0). Benefits package is also seen attractive (mean=2.2), and raises and promotion are given without regard to sex, color or religion (mean=2.2). They somehow do not agree that most people are getting pretty much the same as they would make doing the same work elsewhere (mean=2.5) and slightly disagreeing that employees are unhappy about the way personnel matters are handled in the company they are working with (mean=2.6).. 46.
(58) Table 20 Mean and Standard Deviation (SD) of Self Confidence Factor Item Statement Mean SD # .9 *12 With regard to pay and advancement, I could do very well in 3.5 another organization. *24 People have very little control over their advancement, luck 3.3 1.14 and other factors play a big part. 2.1 .96 36 I know that there’s a tremendous future for me here. *48 Although there may be raises from time to time, I probably 3.0 1.21 don’t have much chance for advancement here. .85 *60 I would have not trouble getting a good job if I decided to 2.2 leave here. Mean 2.82 .62 Note: Range for mean is 1-4 (1-Strongly Agree and 4-Strongly Disagree) N=55 * Negatively Phrased item Table. 20. shows. that. direct. workers. slightly. disagree. that. Self-confidence(mean=2.82) is a factor to job satisfaction. They agree that they would have not troubled getting a good job if they decided to leave the company (mean=2.2) though they also believe that they have a tremendous future in their current organization (mean=2.1) and that they have much chance for advancement coupled with raises given from time to time (mean=3.0). They disagree that with regard to pay and advancement, they could do very well in another organization (mean=3.5) and that they have very little control over their advancement since luck and other factors play a big part (mean=3.3). Although there may be raises from time to time, the limited chance for advancement in the current organization (mean=3) is still disagreeable.. 47.
(59) CHAPTER. 5. DISCUSSION, CONCLUSION AND RECOMMENDATION. 5.1Discussion. All organizations aim to succeed in their chosen business thus, they look for a lot of ways on how they can excel in their products, processes, strategies and most of all people. Leaders of these companies adopt the best practices in order to attain their goals and become a leader not only in the industry where they belong but also in the market as a whole.. Over and above the important elements that make an organization to completely run are the people who possess the competency in performing the job given to them. The question on how they can make use of the competencies they possess is now a major concern since the execution and usage of these talents somehow lie on the type of working environment they are into.. Working environment and other motivating factors in order for an employee to perform well is now an issue for discussion in order to meet their potential to the highest level. According to Steers and Porter (1975), there are three major components that motivate people. First is energizing – a force within people that arouses behavior. Second involves direction wherein people direct their efforts to certain situations and not others. Third is maintenance where people persevere in some tasks and end others quickly. It concerns behavior of workers over an extended time.. Through these motivating factors, workers will get some assurances for a satisfying job especially if these are present in the organization they are 48.
數據
Outline
Motivation is the individual’s desire to demonstrate the behavior and reflects willingness to expend effort. Situational constraints refer to factors in the
Self-Actualization MOTIVATION FACTORS:
Management Credibility is also another factor that is found to satisfy job due to the seen fairness of management in dealing with them as well their belief and
ORGANIZATIONAL CLIMATE QUESTIONNAIRE
相關文件
Community industry enhancement and local economic development are the most important goals of rural community empowerment; conversely, the collapse of communities and
By kinematic constraints, we mean two kinds of constraints imposing on the 4-momenta of the invisible particles: the mass shell constraints and the measured missing transverse
Mean saving of 13% of total Lighting Cost for Corridors or Cost Saving of $42,500/ Month Average Vertical Daylight Factor for Living Room - Block 4. Daylight Energy Saving
It is based on the goals of senior secondary education and on other official documents related to the curriculum and assessment reform since 2000, including
LTP (I - III) Latent Topic Probability (mean, variance, standard deviation) non-key term.
LTP (I - III) Latent Topic Probability (mean, variance, standard deviation) non-key term.
LTP (I - III) Latent Topic Probability (mean, variance, standard deviation).. O
Using secondary development technology of NX Open API for C++, this study enables automatic designs that are centered on mold and CAD principles, while in the mean
