在小世界模型下區域差異對於社會模擬的影響
學生:林勳成 指導教授:孫春在 博士國立交通大學
資訊科學研究所
摘要
Watts以及 Strogatz 的”小世界模型”是近年逐漸變得熱門的一種模擬人類社 會的研究工具,而另外一方面,使用區域差異機制(例如設定地形資訊)去逼近真 實世界狀態是一種社會模擬領域中常用的方法,本論文探討在小世界模型之下數 種區域差異對於社會模擬所造成的影響,利用了一種擁有捷徑的細胞自動機作為 測試的平台,模擬了傳染病散播的過程,藉此檢視各種不同區域差異的影響力, 我們相信本論文的結果將有助於往後的研究者決定適當的模擬參數。Influence of Local Information on Social Simulations
under the Small-World Model
Student: Hsun-Cheng Lin Advisor: Dr. Chuen-Tsai Sun
Institute of Computer and Information Science
National Chiao-Tung University
Abstract
Watts and Strogatz’s “small world model” of disordered networks is becoming an increasingly popular research tool for modeling human society. As part of this approach, local information mechanisms (landscape properties) are used to approximate real-world conditions in social simulations. The authors investigate the influence of local information on social simulations that are performed using the small world model. In addition to defining local information, we use a cellular automata variation with added shortcuts as a test platform for simulating the spread of an epidemic and examining various influences. We believe our results will help future researchers determine appropriate simulation parameters.
目錄
摘要...1
Abstract...2
1. Introduction...4
2. Background...7
3. Communication Problem Modeling...9
4. Local Information Mechanisms ...11
5. Experiment...12 5.1. Experiment 1...13 5.2. Experiment 2...15 5.3. Experiment 3...17 6. Conclusion ...19 7. References...20 Appendix A 小世界網路 ...22 Appendix B 傳播問題建模 ...26 Appendix C 實驗 ...31 C.1 區域網路結構的影響...33 C.2 異常個體數量的影響...36 C.3 異常個體設置樣式的影響...39
圖表目錄
Figure 1. A comparison of three methods for setting individual probabilities in a mode
where each individual interacts with three randomly chosen neighbors ...13
Figure 2. A comparison of three methods for setting individual probabilities in a mode where each individual interacts with all neighbors...14
Figure 3. A comparison of six proportions of heterogeneous individuals in a mode where each individual interacts with three randomly chosen neighbors ...15
Figure 4. A comparison of six proportions of heterogeneous individuals in a mode where each individual interacts with all neighbors...16
Figure 5. A comparison of six radiuses in a mode where each individual interacts with three randomly chosen neighbors ...17
Figure 6. A comparison of six radiuses in a mode where each individual interacts with all neighbors...18
圖A-1 (a)一維正則圖,圖中每個點都與最鄰近的四個點作連結 (b) Watt & Strogatz 模型,圖中有四個邊被重置 (c) Newman & Watts 模型,圖中新增了 五個捷徑...23
圖A-2 Watts & Strogatz 模型產生破碎圖形的例子 ...23
圖B-1 傳播問題架構的流程圖...26 圖B-2 SIR 模型狀態轉換圖 ...27 圖C-1 (a)在細胞自動機上每個個體擁有四個鄰居 (b)每個個體可能會有零個到 數個不等的捷徑連接到其他隨機挑選的個體...31 圖C-2 測試平台示意圖...32 圖C-3 比較三種不同設定個體分支度資訊方法在與三個鄰居互動的模式下的結 果...34 圖C-4 比較三種不同設定個體分支度資訊方法在與所有鄰居互動的模式下的結 果...34 圖C-5 比較六種不同異常個體佔總人口比率在與三個鄰居互動的模式下的結果 ...37 圖C-6 比較六種不同異常個體佔總人口比率在與所有鄰居互動的模式下的結果 ...37
1. Introduction
The “small world” is one of several models currently being used to describe the structures of social networks—groups of people who exhibit interaction or relationship patterns. The small world model has special topological properties found in real-world human societies, including strong local clustering and small average distances between pairs of nodes. It is therefore popular with researchers interested in constructing social simulations of virtual societies, as well as for simulating such communication problems as epidemics and the spread of cultural beliefs and influences, both of which are affected by transmission routes [1-4].
Factors that affect the results of communication problem simulations are communication network structure, divergence between individuals, and the effects of the medium being used to transmit information. These mitigating factors depend on the type and amount of local information found on nodes and edges. Communication network structure (vertex degree information) is determined by the number of friends that each individual has. Divergence between individuals (attribute information) is expressed as individual resistance against certain diseases or cultural influences. The effect of media (weight information) expresses transmission effectiveness. When these factors are treated as local information, then mechanisms can be designed for choosing the most appropriate information to be used in social simulations (e.g., landscape property).
In this paper, we will focus on the influence of node-related local information, vertex degree, and attribute information on simulating communication problems using the small world model. Building on previous research efforts concerning epidemics that emphasize the influence of social network structure and divergence between
individuals, we will analyze the sensitivity of those factors in addition to vertex degree and attribute information. The primary goal is to determine which type of local information exerts the greatest influence, thus requiring greater care when parameters are being established.
2. Background
One of the first quantitative studies of social network structure was conducted in the 1960s by Stanley Milgram [5]; his work subsequently influenced Watt and Strogatz’s Small-World Network (SWN) model [6]. “Small world phenomena” refers to the situation in which any two randomly chosen people are connected via short chains of intermediate acquaintances. Watt and Strogatz’s model triggered a large number of proposals for other models that also exhibit small world phenomena. The one common property that these models share is that the distance between two nodes increases logarithmically with expanding system size.
Small world models can be categorized as Small-World Networks (SWNs), Scale-Free Networks (SFNs), and Random Networks (RNs). To generate a SWN, start with an n-dimension regular graph in which each node is connected to a z quantity of neighbors (usually, z ≥ 2n) [7]. Each edge of the graphic is then randomly rewired (i.e., one end of a connection is shifted to a new node chosen at random) with probability p. In a variation of the original model proposed by Newman and Watts [8], long-range links (referred to as “shortcuts” in this paper) are inserted between pairs of randomly chosen nodes. This variation exhibits such small world phenomena as clustering, and is therefore considered very similar to human social networks.
To generate a SFN, start with a small number (m0) of nodes [7]. At each iteration,
a new node is introduced and connected to m ≤ m0 preexisting nodes with a
probability that depends on the vertex degree of each node. New nodes are preferentially attached to existing nodes that have large numbers of connections. This type of model exhibits small world phenomena and clustering among small numbers
of nodes with very large vertex degrees. These are similar to the hyperlinks used in the World Wide Web.
Finally, RNs can be generated by adding a number of links betweens pairs of randomly chosen nodes [7]. RNs are capable of exhibiting small world phenomena if enough links are added, but without (or with very little) clustering—an unusual situation in the real world.
In this paper we will investigate the influence of local information on SWNs, propose a communication problem model, and give a definition of “local information” in the model. Cellular automata and the above-mentioned shortcuts will be used to construct a test platform for verifying the influence of local information.
3. Communication Problem Modeling
The simplest possible communication model consists of a sender, channel, and receiver. Using influenza as an epidemiological example, a carrier is the sender, the exchange of air-born viruses the channel, and an infected person the receiver. Using films as a sociological example, a director is the sender, the actual film is the channel, and a viewer is the receiver—in this case, cultural ideas are transmitted from the director to the viewer by means of film.
The Susceptible-Infectious-Removed (SIR) model is often used to describe interactions between two individuals. According to the model, individuals can be in one of the three states described by the acronym SIR; S-state individuals are open to receiving a disease or cultural idea, I-state individuals have already been infected, and R-state individuals have been identified and isolated. I-state individuals have the potential to infect S-state individuals and to become isolated.
Consider a model that describes the spread of an epidemic or cultural idea throughout a population. The complex interactions that occur between individuals can be viewed as a communication network, with individuals serving as its nodes. Channels between individuals are referred to as network edges. At each time step, each individual interacts with several neighbors via different channels.
We used Newman and Watts’s SWN variation [8] to construct our social network, and used cellular automata so that each cell contains exactly one individual, each having links to z number of nearest-neighbors. We then added sf * p shortcuts (with sf representing shortcut factor, and p representing population size) between individuals according to a specific probability. We applied a mechanism to this model in order to
4. Local Information Mechanisms
“Local information” refers to information on individuals or channels that differ from information on other individuals or channels. For example, everyone has two parents, therefore the number of parents is considered global information. However, individuals have different numbers of brothers and sisters, making those numbers a type of local information. The two primary categories of local information are node-related (vertex degree and attribute) and edge-related (direction and weight). Vertex degree information represents the tendency of an individual to make friends with other individuals; extroverts have higher and introverts lower vertex degrees. Attribute information describes individual resistance to disease; this information is used to express divergence. Direction information refers to the direction of a channel, which can be categorized as uni-directional (e.g., television, radio) or bi-directional (e.g., e-mail, telephones). Weight information represents the effect of a channel—for instance, face-to-face communication is viewed as having greater weight than an exchange of e-mails.
The mechanism most commonly used to set local information entails random numbers, either normally distributed or uniformly distributed. Another mechanism is organizing local information according to a pre-designed pattern—for example, putting heterogeneous individuals together in one location or distributing them over an entire environment. These local information mechanisms are applied in a manner that allows a virtual society to approximate the real world. The primary goal of this paper is to analyze the effects of applying local information mechanisms to node-related information.
5. Experiment
Consider a 100 x 100 two-dimensional lattice of 10,000 individuals. In this example, the social network structure was decided by setting the z nearest-neighbor value to 4—that is, each individual is connected with its left, right, top, and bottom neighbors. To determine the sf parameter, we know from previous research that the average distance for the 6 billion inhabitants of the real world is 6. Based on the rule that average distance increases logarithmically with population size, the average distance of our virtual society should be 2.45. We therefore set our sf parameter to 8.5—that is, an average of 8.5 shortcuts between individuals. Because shortcuts are considered bi-directional links, every individual therefore gets 17 additional neighbors. These parameters result in an average distance of approximately 3 in our virtual society (i.e. 213 ≈ 10,000).
We then used the model to simulate the spread of an epidemic. Initially, only ten individuals were in an I-state; all other individuals were in an S-state. For each time step, individuals randomly interacted with several neighbors. We experimented with two interaction modes: interactions with three neighbors chosen at random and interactions with all neighbors. We traced the number of I-state individuals after 90 time steps and compared the curves generated by the different settings in order to investigate the influences of local information.
5.1. Experiment 1
To determine the effect of vertex degree, we chose two individuals with the same special probability each time we added a new shortcut. The probability Pi for
individual i to be chosen was determined by vertex degree information Vi divided by
sum of the vertex degree information Vj for all j in the population. Individuals with
larger Pi values had better chances to be chosen, and two individuals with the same Pi
had equal chances to be chosen. A situation in which all individuals have the same probability is similar to the original model proposed by Newman and Watts[8].
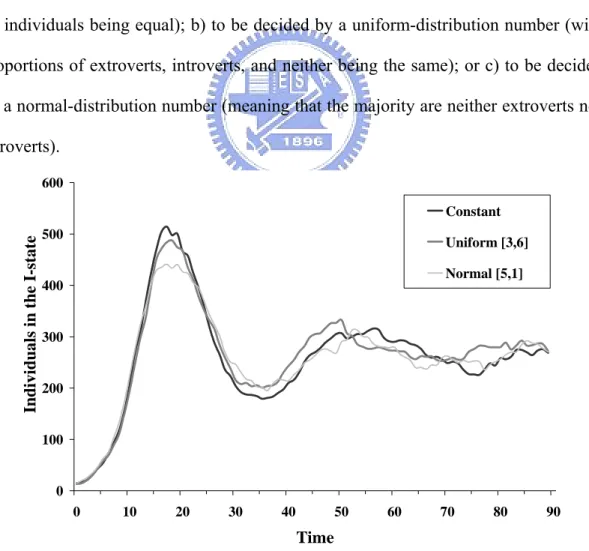
In this experiment, we set the individual probabilities a) to a constant value (with all individuals being equal); b) to be decided by a uniform-distribution number (with proportions of extroverts, introverts, and neither being the same); or c) to be decided by a normal-distribution number (meaning that the majority are neither extroverts nor introverts). 0 100 200 300 400 500 600 0 10 20 30 40 50 60 70 80 90 Time Indi vi dual s i n t h e I-s tate Constant Uniform [3,6] Normal [5,1]
Figure 1. A comparison of three methods for setting individual probabilities in a mode where each individual interacts with three randomly chosen neighbors
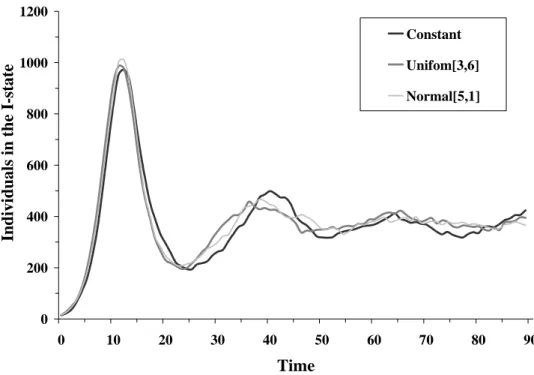
0 200 400 600 800 1000 1200 0 10 20 30 40 50 60 70 80 90 Time Indivi dual s i n the I-state Constant Unifom[3,6] Normal[5,1]
Figure 2. A comparison of three methods for setting individual probabilities in a mode where each individual interacts with all neighbors
Results from this experiment are shown in Figures 1 and 2. We observed that the curves were very similar, even though the values for the top positions of the first hill were slightly different. From this information, we suggest that the influence of vertex degree information is not significant.
5.2. Experiment 2
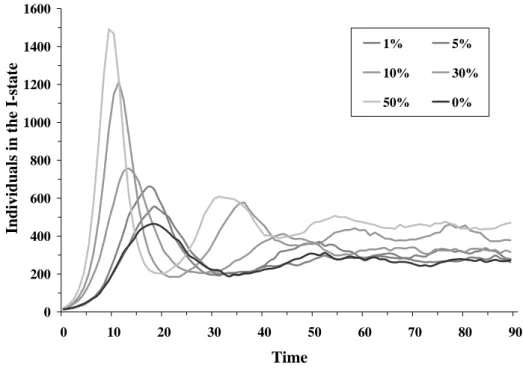
In this experiment we looked at the influence of the proportion of heterogeneous individuals. We know that the average distance between pairs of individuals is quite small in the small world model. We wanted to determine if the presence of easily infected individuals leads to a broader and/or faster outbreak of an epidemic. We therefore doubled the chances of heterogeneous individuals becoming infected, and investigated the results when the proportions of heterogeneous individuals were set at 0, 1, 5, 10, 30, and 50 percent. 0 200 400 600 800 1000 1200 1400 1600 0 10 20 30 40 50 60 70 80 90 Time Individuals in the I-state 1% 5% 10% 30% 50% 0%
Figure 3. A comparison of six proportions of heterogeneous individuals in a mode where each individual interacts with three randomly chosen neighbors
0 500 1000 1500 2000 2500 0 10 20 30 40 50 60 70 80 90 Time Individu als in the I-stat e 1% 5% 10% 30% 50% 0%
Figure 4. A comparison of six proportions of heterogeneous individuals in a mode where each individual interacts with all neighbors
Results are shown in Figures 3 and 4. We found that the higher the proportion of heterogeneous individuals, the earlier the appearance of the first hill and the higher the value of the top spot. We therefore suggest that the proportion of heterogeneous individuals is a significant factor.
5.3. Experiment 3
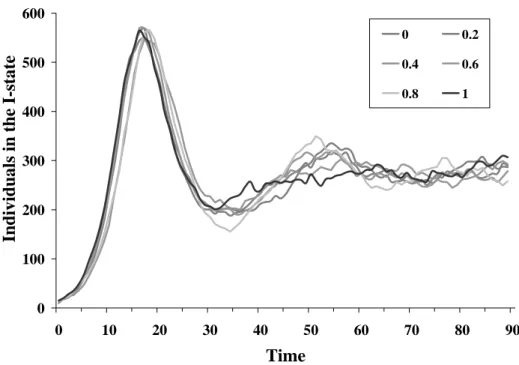
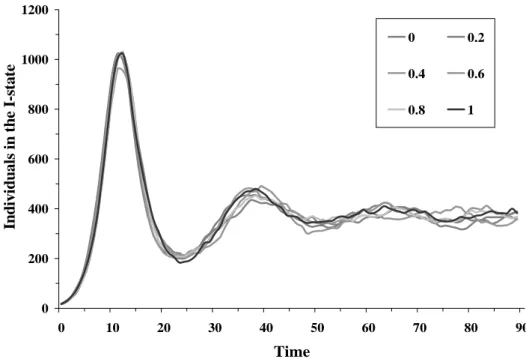
In this experiment, we looked at the influence of a scattered pattern of heterogeneous individuals, with our goal being to compare the results from clustering versus random scattering. We used the parameter r to represent the radius of the area in which the heterogeneous individuals were distributed. An r of 0 meant that they were densely packed and an r of 1 meant that they were randomly scattered throughout the defined environment. The investigated radius parameter values were 0.0, 0.2, 0.4, 0.6, 0.8, 1.0. 0 100 200 300 400 500 600 0 10 20 30 40 50 60 70 80 90 Time Indiv idual s in the I -sta te 0 0.2 0.4 0.6 0.8 1
Figure 5. A comparison of six radiuses in a mode where each individual interacts with three randomly chosen neighbors
0 200 400 600 800 1000 1200 0 10 20 30 40 50 60 70 80 90 Time Indi v idua ls i n t he I -s tat e 0 0.2 0.4 0.6 0.8 1
Figure 6. A comparison of six radiuses in a mode where each individual interacts with all neighbors
Results from this experiment are shown in Figures 5 and 6. The similarity of the curves leads us to suggest that the influence of the pattern of scattered heterogeneous individuals is not significant.
6. Conclusion
In this study, we investigated the influence of local information on communication problems involving small world networks (SWNs). We found that the influence of vertex degree is not significant, that the influence of the proportion of heterogeneous individuals is significant, and that the influence of the pattern of scattered heterogeneous individuals is not significant. We believe these results will be helpful for determining parameters for future simulations. Our future research efforts will focus on a) the influences of other types of local information (e.g., edge-related) and b) the influences of local information on other types of small world models (e.g., SF, RN) to determine if they are similar to those of SWN.
7. References
[1] F. Comellas, J. Ozon and J. G. Peters, "Deterministic small-world communication networks," Information Processing Letters, vol. 76, 2000, pp. 83-90.
[2] L. S. Tsimring and R. Huerta, "Modeling of contact tracing in social networks," Physica a-Statistical Mechanics and Its Applications, vol. 325, 2003, pp. 33-39.
[3] N. Zekri and J. P. Clerc, "Statistical and dynamical study of disease propagation in a small world network," Physical Review E, vol. 64, no. 5, 2001
[4] D. H. Zanette, "Models of Social Processes on Small-World Networks," AIP Conference Proceeding, vol. 658, 2003, pp. 187-203.
[5] S. Milgram, "The small world problem," Psychology Today, vol. 2, 1967, pp. 60-67.
[6] D. J. Watts and S. H. Strogatz, "Collective dynamics of 'small-world' networks," Nature, vol. 393, 1998, pp. 440-442.
Appendix A
小世界網路
本論文提出了一種修改過的小世界網路模型,以便於產生擁有不同網路結構 的虛擬社會網路,透過設定點的分支度資訊(vertex degree information),可以控制 讓點(node)擁有較多的鄰居或者較少的鄰居。如此一來,使用者可以藉由設計不 同分支度資訊的樣式(pattern),產生比較符合其期望的虛擬社會網路,舉例來說, 使用者會希望設計在某些區域人口比較活躍,所以在這個區域中個體所擁有的互 動對象數量會比其他區域多,而某些區域人口比較文靜,所以在這個區域中個體 擁有的互動對象數量會比其他區域要少,所以會需要一個能調整區域網路結構的 新小世界網路。
新的小世界模型以 Newman & Watts 所提出的小世界網路作為基礎,而 Newman & Watts 的小世界網路則是屬於 Watts & Strogatz 的小世界網路的一種變 形,在最初Watts & Strogatz 的小世界網路的建構方法中,一個小世界網路是由 n 維的正則圖(regular graph)開始,圖中每一個點都會與其最鄰近 z 個點相連(參照 圖A-1(a)),然後圖中每一個邊(edge)有一定的機率會被重置(rewire),重置的方式 是將其中一個端點,連接到隨機挑選一個點上(參照圖 A-1(b))。然而在某些不幸 的情況下,這種建構方式可能會造成圖形的破裂(參照圖 A-2),於是 Newman & Watts 提出了新的建構方式,用新增額外的捷徑(shortcut)取代原先重置邊的方法 (參照圖 A-1(c)),新增捷徑的方式為隨機挑選兩個目前無連結的點,將其連接在 一起,而新增捷徑的數量則可以由使用者自行決定。
(a) (b) (c)
圖 A-1 (a)一維正則圖,圖中每個點都與最鄰近的四個點作連結 (b) Watt & Strogatz 模型,圖中 有四個邊被重置 (c) Newman & Watts 模型,圖中新增了五個捷徑
Newman & Watts 所提出來的小世界網路,避免了 Watts & Strogatz 的小世界 網路中可能因為重置網路上的邊導致圖形破碎的問題,可以保持整個圖形的完整 性,並且保留正則圖每一個點必定跟其相鄰z 個點連接的良好性質,然而由於新 增捷徑的時候,每個點被挑選到的機率相同,所以點的分支度會呈現常態分布的 情形,無法產生分支度不同分布情況的網路結構。
本論文所提出新的小世界網路,改變了 Newman & Watts 小世界網路新增捷 徑時挑選點方法,在開始建構網路之前,使用者必須先設定每個點 Ii的分支度資 訊值 Vi,這個值必須為一個大於 0 的實數,當進行到新增捷徑步驟要挑選兩個 端點時,點Ni 被挑選出來機率 Pi公式如下(參照圖 A-3):
(
j Population)
Vj Vi Pi ∈ ∀ =∑
因此分支度資訊值越高的點,將有越高的機率被挑選出來,而分支度資訊值越低 的點,將有越少的機率被挑選出來,當所有點的分支度資訊值相同的時候,則跟 Newman & Watts 的小世界網路相同。建構新小世界網路的虛擬碼如下: Step1: for all Individuals Ii in Population connect_to_z_nearest-neighbor( Ii, z) assign_vertex_degree_information(Ii, Vi) next
Step2:for 1 to shortcut_num Generate_shortcut: Individual Ia = choose_Individual_by_Special_Probability() Individual Ib = choose_Individual_by_Special_Probability() if is_linked(Ia, Ib) then goto Generate_shortcut end if next
Appendix B
傳播問題建模
本論文提出了一套模擬傳播問題的架構(framework),在這個架構之中有考量 過去學者所著重傳播網路結構、個體差異的影響、傳播媒體效力等因子,並且也 提供個體有不同行為模式,以適應不同的傳播議題,舉例來說,如果謠言是由口 耳相傳的行為模式散佈,則每個個體一定的時間之內僅可能跟有限數量的鄰居散 佈謠言,如果謠言是送發電子郵件的行為模式散佈,則每個個體可以在一定的時 間之內跟所有的鄰居散佈謠言。圖 B-1 是傳播問題架構的流程圖,首先產生傳播網路並且設定個體與環境等 相關參數,然後進行模擬的部分,在每過一段時間,在傳播網路中的每個個體會 依序跟數個鄰居進行互動,這個數量可以是每個個體相同的固定值,也可以是每 個個體不同的變數值,在每次互動中對個體產生的影響不會立即生效,而是在所 有的個體的互動行為結束後,再一起做更新的動作,如此一來個體互動的次序將 不會影響互動的結果。 本論文模擬了一個傳染病散佈的過程,在傳播網路上使用小世界網路模型決 定網路架構,在模擬個體之間的互動行為上使用了SIR 模型的概念,每當一個處 於未受感染(S)狀態下個體跟一個處於被感染(I)狀態下的個體進行互動,則處於 S 狀態的個體會有一定的機率會轉換為被感染(I)狀態,在此將這機率命名為感染率 (I_rate),而在每一段時間經過每個處於被感染(I)狀態的個體有一定的機率會被檢 驗出來,因此被社會上其他個體隔離或孤立轉變成為被移除(R)的狀態,在此將 這機率命名為移除率(R_rate),在一般傳統的 SIR 模型下,處於被移除(R)狀態下 的個體會被視為死亡或者已康復並帶有抗體,對於其他人並不會造成其他的影 響。 圖 B-2 SIR 模型狀態轉換圖 在探討社會文化的傳播議題下,SIR 模型被賦予了新的解釋,未受感染(S) 狀態表示個體處於開放接受各種觀念的狀態,而被感染(I)狀態表示個體已經接受
某個特定的觀念,並且願意將這個觀念散佈給其他人,而被移除(R)狀態表示個 體對於特定觀念已經不感興趣,個體不會受到別人散佈觀念的行為所影響,也不 會主動去散佈這個特定觀念。因此在社會文化傳播議題下,個體有可能會從被移 除(R)的狀態轉變成為未感染(S)的狀態,舉服裝穿著流行散佈為例子,一個個體 可能從原先沒有特別喜歡穿低腰牛仔褲,變成受到週遭人的影響開始穿著低腰牛 仔褲,並且進而推廣其他人穿低腰牛仔褲,經過了一段時間對於低腰牛仔褲厭煩 了,就不會穿著低腰牛仔褲,也不會在意週遭人是否都穿著低腰牛仔褲,但是又 經過了一段時間,又會回復到最初沒有特別喜歡也沒有特別討厭低腰牛仔褲的狀 態。在此將處於被移除(R)狀態每段時間內轉變成未感染(S)狀態的機率命名為重 置率(S_rate)。 在上述的 SIR 模型中,並沒有把個體之間的差異與傳播媒體的差異所造成的 影響考量進去,所以當一個處於未感染(S)狀態的個體跟處於被感染(I)狀態的個 體產生互動,要做是否轉變狀態的機率篩選時,將被感染率(I_rate)再乘上個體本 身 的 抵 抗 力 屬 性 資 訊(attribute information)以及傳播媒體的權重資訊(weight information),如此一來不同的個體用不同的傳播媒體進行互動時,就會展現出差 異性來。
本論文所使用的傳播問題模型的虛擬碼如下: for 1 to TimeStepLimit
for all Individual Ii in Population for 1 to InteractionLimit
Individual Itarget = choose_neightbor_by_random(Ii) SIR(Ii, Itarget)
next Interaction next Individual
for all Individual Ii in Population if Ii.nowstate = I_state then
if random_value() < r_rate then Ii.nextstate = R_state
end if end if
if Ii.nowstate = R_state then
if random_value() < s_rate then Ii.nextstate = S_state end if end if Ii.nowstate = Ii.nextstate next Individual next TimeStep
SIR(Individual Ia, Individual Ib)
if Ia.state = I_sate and Ib.state = S_state then if random_value() < i_rate * Ib.resist then Ib.nextstate = I_state
end if end if
if Ia.state = S_state and Ib.state = I_state then if random_value() < i_rate * Ia.resist then Ia.nextstate = I_state
end if end if
Appendix C
實驗
在本論文的實驗中使用了擁有捷徑的細胞自動機作為測試平台,傳統的細胞 自動機中,每個個體都擁有其特定數量的鄰居(參照圖 C-1(a)),因此可以將其視 為 二 維 的 正 則 圖 , 在 二 維 的 正 則 圖 上 任 意 挑 選 兩 個 個 體 新 增 捷 徑(參照圖 C-1(b)),所產生擁有捷徑的細胞自動機就可以符合小世界網路模型產生的方法, 所以此一測試平台可以呈現小世界模型。 (a) (b) 圖 C-1 (a)在細胞自動機上每個個體擁有四個鄰居 (b)每個個體可能會有零個到數個不等的捷徑 連接到其他隨機挑選的個體 在實驗時所要研究的對象,是在建構虛擬社會時使用者可以調整或設計的區 域資訊,像是網路的架構、不同的個體參數、環境參數,透過觀察實驗的結果, 來分析這些不同區域資訊的影響力,藉此可以更進一步了小世界模型在應用面上 的特性。 在本論文的實驗中,使用了寬 100 高 100 擁有捷徑的細胞自動機,所以在這 個虛擬社會中有 10,000 個個體,有鑒於過去傳統細胞自動機都是跟周圍四個或 八個鄰居進行互動,所以設定小世界網路參數時,每個個體也是與其最鄰近的四 個鄰居相連,以跟傳統細胞自動機作對比,其次,要決定新增的捷徑的數量,為 了讓實驗中虛擬世界貼近真實的世界,可以從真實世界中六十多億人口平均分隔 度推測約略為6,以及小世界網路系統數量跟平均分隔度成對數成長關係來推論虛擬社會的平均分隔應該為2.45,於是設定平均每個個體會有 17 個額外捷徑連 接到其他個體,每個個體平均總共有21 個鄰居,在這個設定之下理論上此小世 界模型的平均分隔度應為3 左右,而實際測試的結果約為 3.5~3.8 之間,雖然跟 真實世界有某個程度的差距,還算是可以接受的範圍,而本論文的研究重點也不 在此,所以就以這套參數產生測試平台(參照圖 C-2)。 圖 C-2 測試平台示意圖 本論文以模擬一種虛擬傳染病的傳播過程,實驗方法如下,起初在測試平台 上10,000 個體中隨機挑選 10 個個體設定為被感染的狀態,而其他的所有個體都 設定為未感染的狀態,根據附錄B 所提出來傳播問題模型,進行長達 90 段時間
C.1
區域網路結構的影響
首先第一個實驗將針對網路結構的影響作一番探討,由於不同的社會風氣不 同,所產生的社會網路也會有所差異,舉例子來說,在一個社會風氣開放的社會 中,每個個體可能擁有的朋友數量都相當多,而在一個社會風氣保守的社會中, 每個個體擁有的朋友數量可能就會相當少,除此之外,當社會是由不同比例外向 的人、普通人跟內向的人所組成時,所產生的社會網路也會有不同的差異,而這 些差異所造成影響,是被學者們所感興趣的。 在這個實驗中藉由設定每個個體的分支度資訊,以達到產生不同社會網路結 構的需求,在此實驗了三種常見的社會結構分布情形,第一種類型是把所有個體 視為相同,意即每個個體的分支度資訊皆相同,可以視為社會上所有人都是交友 數量差不多的普通人,第二種類型是個體的分支度資訊呈現均勻分布的情形,可 以視為社會上外向的人、普通人與內向的人比例上各佔三分之一的分布比率,第 三種類型是個體的分支度資訊呈現常態分佈的情形,可以視為社會上普通的人佔 大多數,而外向的人與內向的人僅為少數個體。 在實驗中的參數設定上,第一種類型的社會將所有的個體的分支度資訊設定 為1;第二種類型的社會個體的分支度資訊,是由均勻分佈的亂數取出 3-6 之間 的整數,意即個體的分支度資訊值可能為 3、4、5、6,這四種數值出現的機率 各佔四分之一,而外向的人比內向的人多一倍的機會交到新朋友;第三種類型的 社會個體的分支度資訊,是由常態分布亂數中心值5 標準差 1 取出的整數設定, 所設定的值可能為1-9 之間的整數,而多數的個體會被設定為 4、5、6 的值,僅 有少數的個體會被設定為1 或 9 數值。0 100 200 300 400 500 600 0 10 20 30 40 50 60 70 80 90 Time Indi vi dual s i n t h e I-s tate Constant Uniform [3,6] Normal [5,1] 圖 C-3 比較三種不同設定個體分支度資訊方法在與三個鄰居互動的模式下的結果 0 200 400 600 800 1000 1200 0 10 20 30 40 50 60 70 80 90 Time Indivi dual s i n the I-state Constant Unifom[3,6] Normal[5,1] 圖 C-4 比較三種不同設定個體分支度資訊方法在與所有鄰居互動的模式下的結果
圖C-3、C-4 呈現此實驗的結果,可以明顯看到在兩種不同的互動模式下, 比較三種不同網路結構下所產生的曲線,圖中各曲線第一個高峰的最高點數值有 些微的差異在,但是第一高峰曲線升起與落下的時間卻相當的吻合,可以從這個 結論歸納出在加入相同數量的捷徑的情況下,設計區域性的網路結構不同,對於 疾病爆發高峰的總人數有些微的影響,對於疾病爆發的曲線走勢起伏沒有什麼影 響,所以在未來要做相似議題的模擬時,可以不必花太多心思在設定細微網路狀 態,可以將心思放在找尋適當的全域資訊上,像連接最鄰近的個體數量或者增加 捷徑數量上。
C.2
異常個體數量的影響
第二個實驗在研究異常個體佔整體族群比率對於模擬所造成的影響,由於每 個個體對於不同事物抵抗力不同,舉流行感冒為例子,有些個體可能擁有較佳的 抵抗力,則不容易得到感冒,有些個體可能擁有較差的抵抗力,則特別容易感冒, 在小世界模型下個體平均分隔度很低的情況下,是否會由於少部分個體特別容易 受到感染,而造成整體群體的流行感冒的大爆發,這是這個部分想要去探討的對 象。 在實驗中的參數設定上,可以透過設定個體的抵抗力屬性資訊,來達到呈現 個體之間抵抗力差異的需求,在此設定異常個體抵抗力為平常個體的一半,意即 異常個體比起正常個體多一倍的機率被感染,異常的個體與正常個體皆為隨機分 布在整個環境當中,在此研究六種不同的異常個體佔人口的比率,0%、1%、5%、 10%、30%、50%,超過 50%的情況下,可以把異常個體視為正常個體,把正常 個體視為異常個體,用這種看法來看,所以我們僅需要作到50%就可以看出異常 個體的比例所造成的影響是否顯著。0 200 400 600 800 1000 1200 1400 1600 0 10 20 30 40 50 60 70 80 90 Time Individuals in the I-state 1% 5% 10% 30% 50% 0% 圖 C-5 比較六種不同異常個體佔總人口比率在與三個鄰居互動的模式下的結果 0 500 1000 1500 2000 2500 0 10 20 30 40 50 60 70 80 90 Time Individu als in the I-stat e 1% 5% 10% 30% 50% 0% 圖 C-6 比較六種不同異常個體佔總人口比率在與所有鄰居互動的模式下的結果
圖 C-5、C-6 呈現此實驗的結果,可以明顯的看到在兩種不同的互動模式下, 比較六種不同異常個體的比率下所產生的曲線,異常個體的比例越高,則第一個 高峰的最高點數值也越高,而出現的時間也越早,所以可以觀察到異常個體的比 率造成的影響十分的明顯,此外可以從 0%與 1%兩者的比較發現,即使異常個 體出現的比率很少,對於整個模擬過程的影響卻很明顯,在此可以歸納出個體屬 性資訊值是有顯著影響的因子,所以使用者在設定社會人口屬性值時必須要特別 的小心,即使僅有1%的誤差也會造成明顯的影響。
C.3
異常個體設置樣式的影響
第三個實驗探討相同數量的異常個體不同設置樣式所造成的影響,例如所有 的異常個體被設置群聚在一起,或者均勻散佈在環境之中兩種不同設置樣式,是 否對於模擬的結果會產生影響,則是這個研究的對象。 在這個實驗中使用了半徑參數 r 表現出異常個體可以散佈的範圍(參照圖 C-7),當半徑值 r 為 0 的時候所有異常的個體都會完全的群聚在一起,而當半徑 值r 為 1 的時候所有的異常個體會在整個環境中均勻的散佈,當半徑值介於 0 與 1 之間時,表示異常個體會在由此半徑所涵括的範圍中,均勻的散佈,如果異常 個體的數量多過於此範圍所能涵括的範圍,此一半徑值會自動從新設置為最小可 以涵括所有異常個體的半徑值。再這裡的實驗當中,比較了在六種不同的半徑值 0.0、0.2、0.4、0.6、0.8 下,設置 1 %的異常個體的分布情形,觀察分布樣式對 於模擬結果的影響。 圖 C-7 不同半徑 r 涵括範圍的示意圖0 100 200 300 400 500 600 0 10 20 30 40 50 60 70 80 90 Time Individuals in th e I -s ta te 0 0.2 0.4 0.6 0.8 1 圖 C-8 比較六種不同異常個體散佈半徑範圍在與三個鄰居互動的模式下的結果 0 200 400 600 800 1000 1200 0 10 20 30 40 50 60 70 80 90 Time Individuals in t h e I-st at e 0 0.2 0.4 0.6 0.8 1 圖 C-9 比較六種不同異常個體散佈半徑範圍在與所有鄰居互動的模式下的結果 圖 C-8、C-9 呈現此實驗的結果,可以明顯的看到在兩種不同的互動模式下, 比較六種不同設置半徑值下所產生的曲線,並無任何明顯的不同,因此可以從此