j o u r n a l h o m e p a g e : w w w . i n t l . e l s e v i e r h e a l t h . c o m / j o u r n a l s / c m p b
Predicting hypotensive episodes during spinal anesthesia
with the application of artificial neural networks
Chao-Shun Lin
a,b, Jainn-Shiun Chiu
d, Ming-Hui Hsieh
b, Martin S. Mok
b,
Yu-Chuan Li
c,f,∗∗,1, Hung-Wen Chiu
e,∗,1aGraduate Institute of Medical Sciences, College of Medicine, Taipei Medical University, Taiwan bDepartment of Anesthesiology, Taipei Medical University Hospital, Taiwan
cInstitute of Biomedical Informatics, National Yang-Ming University, Taiwan dDepartment of Nuclear Medicine, Buddhish Dalin Tzu Chi General Hospital, Taiwan eGraduate Institute of Medical Informatics, Taipei Medical University, Taiwan fDepartment of Dermatology, Taipei Veterans General Hospital, Taiwan
a r t i c l e
i n f o
Article history:
Received 25 January 2008 Received in revised form 23 April 2008
Accepted 27 June 2008
Keywords:
Artificial neural networks Spinal anesthesia Hypotension Logistic regression
a b s t r a c t
Hypotension is one of the most frequent adverse effects of spinal anesthesia. Several factors might be related to the occurrence of hypotension. Predictions of the hypotensive event, however, had been addressed by only a few authors using logistic regression (LR) models. Artificial neural networks (ANN) are pattern-recognition tools that can be used to detect complex patterns within data sets. The purpose of this study was to develop the ANN-based predictive model to identify patients with high risk of hypotension during spinal anesthesia. From September 2004 to December 2006, the anesthesia records of 1501 patients receiving surgery under spinal anesthesia were used to develop the ANN and LR models. By random selection 75% of data were used for training and the remaining 25% of data were used as test set for validating the predictive performance. Five senior anesthesiologists were asked to review the data of test set and to make predictions of hypotensive event during spinal anesthesia by clinical experience. The ANN model had a sensitivity of 75.9% and specificity of 76.0%. The LR model had a sensitivity of 68.1% and specificity of 73.5%. The area under receiver operating characteristic curves were 0.796 and 0.748. The ANN model performed significantly better than the LR model. The prediction of clinicians had the lowest sensitivity of 28.7%, 22.2%, 21.3%, 16.1%, and 36.1%, and specificity of 76.8%, 84.3%, 83.1%, 87.0%, and 64.0%. The computer-based predictive model should be useful in increasing vigilance in those patients most at risk for hypotension during spinal anesthesia, in allowing for patient-specific therapeutic intervention, or even in suggesting the use of alternative methods of anesthesia.
© 2008 Elsevier Ireland Ltd. All rights reserved.
∗Corresponding author. No.250, Wusing Street, Sinyi District, Taipei 110, Taiwan. Tel.: +886 2 27361661x3347; fax: +886 2 27339049. ∗∗Corresponding author. No.155, Sec. 2, Linong Street, Beitou District, Taipei 112, Taiwan. Tel.: +886 2 28267349; fax: +886 2 28202508.
E-mail addresses:[email protected](Y.-C. Li),[email protected](H.-W. Chiu). 1 These authors contributed equally to this work.
0169-2607/$ – see front matter © 2008 Elsevier Ireland Ltd. All rights reserved. doi:10.1016/j.cmpb.2008.06.013
1.
Background
Although spinal anesthesia (SpA) has long been considered a safe technique, it is not without risk or adverse effects. Hypotension is one of the most frequent adverse effects of spinal anesthesia with reported incidence of 15–33%[1,2]. The clinical importance of this side effect had been shown in sev-eral studies which proved that hypotensive episodes clearly correlated with morbidity and mortality[3,4]. Identification of patients with high risk of hypotension would be an impor-tant step in the rational selection of anesthetic techniques and adoption of therapeutic interventions. Certain factors related to patient history, basal clinical state, or anesthetic technique might be associated with an increased risk for hypotensive episodes. History of hypertension[5], basal heart rate[6], and obesity[7,8]have been considered to be possible predisposing factors for hypotension during spinal anesthesia. Predictions of the hypotensive event, however, have been addressed by only a few studies using logistic regression models which have limited discriminating power[9].
Artificial neural networks (ANN) are pattern-recognition tools that can be used to detect complex patterns within data sets. In recent years ANN has been widely applied in computer-aided diagnosis [10,11,21], in medical signal processing [12,13], and in outcome prediction [14,15,22]. The purpose of this study was to develop the ANN-based predictive model to predict patients with high risk of hypoten-sion during spinal anesthesia. Furthermore, we compare the predictive performance of the ANN model to those of the logistic regression model and the prediction of clini-cians.
2.
Materials and methods
2.1. Study population
From January 2004 to December 2006, the anesthesia records of 1611 patients receiving surgery under spinal anesthesia were reviewed. Records with missing data were excluded. A total of 1501 data were included in the study for model construction and performance evaluation. The Hospital Ethics Commit-tee had approved the protocol. Because the study entailed no interventions in patient care, informed consent was not required.
The predictive power of 8 patient-related, 2 surgical, 1 anesthesia-related variables and 3 hemodynamic variables was recorded and studied:
1. Patient-related variables included: age, gender, height, weight, hematocrit, American Society of Anesthesiologist (ASA) physical status, history of hypertension, history of diabetes.
2. Surgical variables included: emergency or elective surgery, surgical category (orthopedics, plastic surgery, general surgery, obstetrics, and urology).
3. Anesthetic variables included: dose of local anesthetics (0.5% bupivacaine).
4. Hemodynamic variables included: basal systolic blood pressure (SBP), basal diastolic blood pressure (DBP), and basal heart rate (HR).
2.2. Hypotension
Hypotension was defined if SBP fell below 90 mmHg or if the patient developed the associated symptoms (nau-sea/vomiting) within 15 min after induction of spinal anes-thesia. The dichotomous variable “hypotension” was used as target criterion and was defined as “1” if hypotension occurred and “0” if hypotension not occurred.
2.3. Logistic regression (LR)
Data analysis and statistics were performed using the com-mercial software SAS (SAS for Windows, Version 9.0, SAS Inc.). Randomly selected 75% data were used for model construction and the remaining 25% data were used as test set for validating the predictive performance.
First, variables were checked with univariate analysis for associations with hypotension. We calculated mean value, standard deviation, median, inter-quartile range, and 95% confidence interval as metric variables. Metric variables were analyzed by Mann–Whitney U-test. Categorical variables were assessed for a significant association by either Chi-square statistics or Fisher’s exact test.
Second, the stepwise algorithm was used for the construc-tion of the multivariate model. At each step, independent variables not yet included in the equation were tested for possible inclusion. The variable with the strongest significant contribution to improving the model was included. Variables already included in the logistic regression equation were tested for exclusion on the basis of the probability of a log likelihood test ratio. The analysis ended when no further variables for inclusion or exclusion were available. Further-more, logistic regression was used to estimate the coefficients (ˇ) of these variables. On the basis of the results, the prob-ability of hypotension may be estimated with the logistic equation.
2.4. Artificial neural network
We used the NeuroShell 2 (Release 4.0, Ward systems Group Inc.) to develop the ANN model. The architectures selected in this study were the multilayer perceptron and 1 hidden layer with 12 hidden nodes were defined due to the complex-ity of the data set. There were 14 parameters chosen as input variables according to the related literatures and clinical expe-riences (Table 1). Randomly selected 75% data were used for training and the remaining 25% data which were not involved in the training process were used as test set for validating the predictive performance.
2.5. Simplified artificial neural network (SANN)
To study the predictive performance of the ANN model with lesser input nodes, the seven variables selected in the logis-tic regression model (surgical category, weight, height, ASA physical status, emergency, basal SBP, and dose of local
Table 1 – Variables used for training of the ANN model
Variable Coding
Age Years
Gender 0: female; 1: male
Weighta kg
Heighta cm
Hematocrit %
ASA physical statusa 0: class 1, 2; 1: class 3, 4
Basal SBPa mmHg
Basal DBP mmHg
Basal HR Beat per minute
History of hypertension 0: no; 1: yes History of diabetes 0: no; 1: yes
Surgical categorya c1(1,0,0,0,0): ORT; c2(0,1,0,0,0): PS;
c3(0,0,1,0,0): GS; c4(0,0,0,1,0): OBS; c5(0,0,0,0,1): URO
Emergencya 0: no; 1: yes
Dose of local anestheticsa mg
ORT: Orthopedics, PS: plastic surgery, GS: general surgery, OBS: obstetrics, URO: urology.
a Used for training of the SANN model.
anesthetics) were used as input variables to develop the “simplified” ANN model. The architectures selected were the multilayer perceptron and 1 hidden layer with 8 hid-den nodes were defined. The data set and training process were the same as the ANN model with all 14 input vari-ables.
2.6. Prediction of clinicians
The data of test set were presented to 5 senior anesthesiol-ogists. They were asked to make predictions about whether the patient may have a hypotensive episode after spinal anes-thesia induction case by case. The results of their predictions were computed and then compared to the other predictive models.
2.7. Performance evaluation
The test data set was used to evaluate predictive per-formance. Accuracy, sensitivity, specificity, and likelihood ratios for positive and negative tests were calculated for each model. Receiver operating characteristic (ROC) curves were plotted and the areas under ROC curve were calcu-lated. The ROC curve represents a graphical display of the true-positives (sensitivity) plotted against the false-positive (1− specificity) for various thresholds. The area under the curve could indicate the discriminating power of the model. This may be interpreted as the probability of correct patient classification in one of the two categories for hypoten-sion.
3.
Results
The characteristics, surgical and anesthesia data, along with the distribution of hypotension of the training set and the test set are shown inTable 2. The incidence of hypotension of the training set and test set were 32.8% and 31.5%, respectively.
Table 2 – Characteristics of patients
Training set (n = 1126) Test set (n = 375) p-Value Hypotension (%) 32.8 31.5 – Age (years) 49.5± 18.5 50.6± 18.8 0.2091 Gender: male (%) 54.4 54.7 – Height (cm) 162.9± 7.5 163.2± 8.0 0.4933 Weight (kg) 67.3± 12.7 67.5± 12.3 0.5416 Hematocrit (%) 39.0± 7.8 38.9± 5.9 0.9247 Basal SBP (mmHg) 139.3± 24.5 138.4± 25.1 0.0823 Basal DBP (mmHg) 84.6± 13.4 85.9± 15.1 0.0765 Basal HR (bpm) 79.8± 15.5 78.1± 14.7 0.0534 History of hypertension (%) 19.0 20.5 -History of diabetes (%) 11.5 11.5 -Emergency (%) 15.5 13.1 -Dose of local anesthetics 10.6± 1.8 10.5± 1.7 0.2547
Data are mean± S.D.
Of the total of 1501 patients, 1126 were selected for training the predictive model and the rest (375 patients) were avail-able for testing. There was no significant difference in the demographic data between both data sets.
The results of logistic regression analysis are summarized inTable 3. There are seven variables included in the final logis-tic regression model—surgical category, weight, height, ASA physical status, emergency, SBP, and dose of local anesthet-ics. The probability of hypotension could be calculated by the following logistic equation:
probability= 1+ e1−ˇ, with ˇ
= 2.9 + 2.4458 × (surgical category) +0.0254 × (weight) − 0.0061 × (height) +0.7406 × (ASA physical status)
+0.5388 × (emergency) + 0.0107 × (basal SBP) +0.18 × (dose of local anesthetics)
The ANN had an overall accuracy of 77.6% in predicting hypotension. The sensitivity was 75.9% and specificity was 76.0%. The accuracy of the SANN model was 76.5%; the sen-sitivity was 73.1%, with a specificity of 77.5%. The logistic regression model had an accuracy of 71.2%. The sensitivity
Table 3 – Coefficient of the logistic regression model
Parameter Coefficient (ˇ) Standarderror p-Value Intercept 2.9000 2.0482 0.1568 Surgical category 2.4458 0.2011 <0.0001 Weight 0.0254 0.0078 0.0012 Height −0.0061 0.0133 <0.0001
ASA physical status 0.7406 0.2463 0.0026
Emergency 0.5388 0.2131 0.0115
Basal SBP 0.0107 0.0037 0.0040
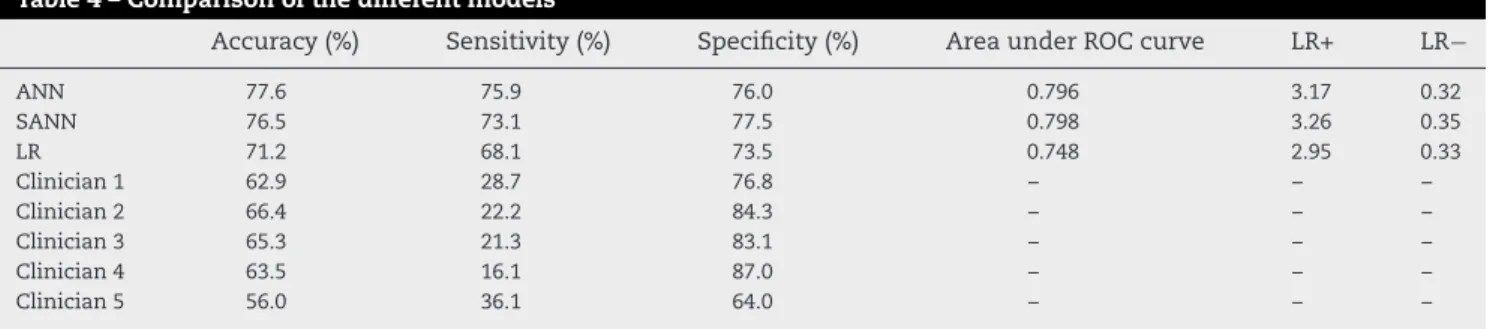
Table 4 – Comparison of the different models
Accuracy (%) Sensitivity (%) Specificity (%) Area under ROC curve LR+ LR−
ANN 77.6 75.9 76.0 0.796 3.17 0.32 SANN 76.5 73.1 77.5 0.798 3.26 0.35 LR 71.2 68.1 73.5 0.748 2.95 0.33 Clinician 1 62.9 28.7 76.8 – – – Clinician 2 66.4 22.2 84.3 – – – Clinician 3 65.3 21.3 83.1 – – – Clinician 4 63.5 16.1 87.0 – – – Clinician 5 56.0 36.1 64.0 – – –
LR+: Likelihood ratio for positive test. LR−: Likelihood ratio for negative test.
was 69.1% and specificity was 73.5% (Table 4). The ANN had the highest accuracy and sensitivity among all predictive models. The SANN model which are developed with seven variables has similar predictive performance to the ANN model. The receiver operative characteristic curves were plotted inFig. 1. The area under ROC curves of ANN, SANN and LR models were 0.796, 0.798, and 0.748, respectively. It revealed that the ANN and SANN models have better discriminating power than the LR model to identify the patient with high risk to develop hypotension during spinal anesthesia. The accuracy of the prediction of clinicians were 62.9%, 66.4%, 65.3%, 63.5, and 56.0. The sensitivity were 28.7%, 22.2%, 21.3%, 16.1%, and 36.1%; the specificity were 76.8%, 84.3%, 83.1%, 87.0%, and 64.0%. The clinician had the lowest predictive accuracy and sensitivity.
4.
Discussion
In our study the ANN and SANN demonstrated the power in detecting whether hypotension occurred after induction of spinal anesthesia. The ROC curves were plotted to summa-rize the findings of the multivariate analysis. The predictive performance of the ANN and SANN models were superior to those of the LR model and the clinicians’ prediction.
The ANN and SANN models which were developed by the parameters available before induction of spinal anes-thesia had good predictive performance. When applied in
Fig. 1 – ROC curves of ANN, SANN, and LR models.
clinical practice, we can identify the patient with high risk of hypotension before spinal anesthesia is performed. We could undertake some therapeutic interventions to prevent the occurrence of hypotension or consider if other anesthesia techniques could be used.
In this study, we use the 7 variables selected in the logis-tic regression model to construct the SANN model. The SANN model with the 7 variables presented a good predictive per-formance similar to the ANN model which was developed by 14 variables. In clinical practice, the SANN model which need less parameters would be easier to use and probably more acceptable.
The prediction of clinician had very low sensitivity and high specificity. It indicted that it was very difficult for a clin-ician to identify the risk of hypotensive episode according to the concomitant parameters. When many determinant fac-tors exist, it is impossible for a clinician to consider every factor simultaneously before making decision. In this study the computer-based ANN model presented the power in pre-dicting the occurrence of hypotensive episode much better than just clinical judgment.
In recent years Hanss et al. had concluded that heart rate variability (HRV) analysis could be used to predict the occur-rence of hypotension during spinal anesthesia[16,17]. Because fast Fourier transformation analysis requires stationary data, patients were asked to lie calmly in the supine position dur-ing HRV measurements. Artifacts durdur-ing HRV data recorddur-ing, e.g., due to movements of the patient, were inevitable to some degree. The application of HRV to a clinically routine setting is currently not possible so it was not included in our predic-tive models. If HRV analysis could be applied and included in the construction of predictive model it could improve the predictive performance of the models.
In conclusion, the knowledge of these risk factors and the computer-based predictive models should be useful in increasing vigilance in those patients most at risk for hypoten-sion, in allowing for patient-specific therapeutic intervention [18–20], or even in suggesting the use of alternative methods of anesthesia, such as epidural anesthesia or general anesthesia.
Conflict of interest
We certify that all the authors of the manuscript have no commercial association or funding support that might post a conflict of interest in connection with this report.
Acknowledgement
This study was supported by the National Science Council of Taiwan (NSC 93-2213-E-038-008).
r e f e r e n c e s
[1] R.L. Carpenter, R.A. Caplan, D.L. Brown, C. Stephenson, R. Wu, Incidence and risk factors for side effects of spinal anesthesia, Anesthesiology 76 (1992) 906–916.
[2] B. Hartmann, A. Junger, J. Klasen, M. Benson, A. Jost, A. Banzhaf, G. Hempelmann, The incidence and risk factors for hypotension after spinal anesthesia induction: an analysis with automated data collection, Anesth. Analg. 94 (2002) 1521–1529.
[3] R.A. Caplan, R.J. Ward, K. Posner, F.W. Cheney, Unexpected cardiac arrest during spinal anesthesia: a closed claims analysis of predisposing factors, Anesthesiology 68 (1988) 5–11.
[4] Y. Auroy, P. Narchi, A. Messiah, L. Litt, B. Rouvier, K. Samii, Serious complications related to regional anesthesia: results of a prospective survey in France, Anesthesiology 87 (1997) 479–486.
[5] J.P. Racle, J.Y. Poy, J.P. Haberer, A. Benkhadra, A comparison of cardiovascular responses of normotensive and hypertensive elderly patients following bupivacaine spinal anesthesia, Reg. Anesth. 14 (1989) 66–71.
[6] M.A. Frolich, D. Caton, Baseline heart rate may predict hypotension after spinal anesthesia in prehydrated obstetrical patients, Can. J. Anaesth. 49 (2) (2002) 185–189. [7] T. Taivainen, M. Tuominen, P.H. Rosenberg, Influence of
obesity on the spread of spinal analgesia after injection of plain 0.5% bupivacaine at the L3-4 or L4-5 interspace, Br. J. Anaesth. 64 (1990) 542–546.
[8] W.J. McCulloch, D.G. Littlewood, Influence of obesity on spinal analgesia with isobaric 0.5% bupivacaine, Br. J. Anaesth. 58 (1986) 610–614.
[9] P. Tarkkila, J. Isola, A regression model for identifying patients at high risk of hypotension, bradycardia and nausea during spinal anesthesia, Acta Anaesthesiol. Scand. 36 (1992) 554–558.
[10] W.G. Baxt, J. Skora, Prospective validation of artificial neural network trained to identify acute myocardial infarction, Lancet 347 (8993) (1996) 12–15.
[11] R.L. Kennedy, R.F. Harrison, A.M. Burton, H.S. Fraser, W.G. Hamer, D. MacArthur, R. McAllum, D.J. Steedman, An artificial neural network system for diagnosis of acute myocardial infarction (AMI) in the accident and emergency
department: evaluation and comparison with serum myoglobin measurements, Comput. Methods Programs Biomed. 52 (1997) 93–103.
[12] B. Heden, H. Ohlin, R. Rittner, L. Edenbrandt, Acute myocardial infarction detected in the 12-lead ECG by artificial neural networks, Circulation 96 (6) (1997) 1798–1802. [13] A. Subasi, E. Erc¸elebi, Classification of EEG signals using
neural network and logistic regression, Comput. Methods Programs Biomed. 78 (2005) 87–99.
[14] L. Bottaci, P.J. Drew, J.E. Hartley, M.B. Hadfield, R. Farouk, P.W. Lee, I.M. Macintyre, G.S. Duthie, J.R. Monson, Artificial neural networks applied to outcome prediction for colorectal cancer patients in separate institutions, Lancet 350 (9076) (1997) 469–472.
[15] Y.F. Wang, T.M. Hu, C.C. Wu, F.C. Yu, C.M. Fu, S.H. Lin, W.H. Huang, J.S. Chiu, Prediction of target range of intact parathyroid hormone in hemodialysis patients with artificial neural network, Comput. Methods Programs Biomed. 83 (2006) 111–119.
[16] D. Chamchad, V.A. Arkoosh, J.C. Horrow, J.L. Buxbaum, I. Izrailtyan, L. Nakhamchik, D. Hoyer, J.Y. Kresh, Using heart rate variability to stratify risk of obstetric patients undergoing spinal anesthesia, Anesth. Analg. 99 (2004) 1818–1821.
[17] R. Hanss, B. Bein, H. Weseloh, M. Bauer, E. Cavus, M. Steinfath, J. Scholz, P.H. Tonner, Heart rate variability predicts severe hypotension after spinal anesthesia, Anesthesiology 104 (2006) 537–545.
[18] A. Lee, W.D. Ngan Kee, T. Gin, A dose–response
meta-analysis of prophylactic intravenous ephedrine for the prevention of hypotension during spinal anesthesia for elective cesarean delivery, Anesth. Analg. 98 (2004) 483–490. [19] C.C. Rout, D.A. Rocke, J. Levin, E. Gouws, D. Reddy, A
reevaluation of the role of crystalloid preload in the prevention of hypotension associated with spinal
anesthesia for elective cesarean section, Anesthesiology 79 (1993) 262–269.
[20] D. Buggy, P. Higgins, C. Moran, D. O’Brien, F. O’Donovan, M. McCarroll, Prevention of spinal anesthesia-induced hypotension in the elderly: comparison between
preanesthetic administration of crystalloids, colloids, and no prehydration, Anesth. Analg. 84 (1997) 106–110. [21] J.S. Chiu, C.F. Chong, Y.F. Lin, C.C. Wu, Y.F. Wang, Y.C. Li,
Applying artificial neural network to predict total body water in hemodialysis patients, Am J Nephrol. 25 (2005) 507–513. [22] C.C. Lin, Y.C. Wang, J.Y. Chen, Y.J. Liou, Y.M. Bai, I.C. Lai, T.T.
Chen, H.W. Chiu, Y.C. Li, Artificial neural network prediction of clozapine response with combined pharmacogenetic and clinical data, Comput. Methods Programs Biomed. 91 (2008) 91–99.