Disaccharides by Capillary Electrophoresis
Tandem Mass Spectrometry Using Ion Trap
Mass Spectrometry
D. T. Li, J. F. Sheen, and G. R. Her
Department of Chemistry, National Taiwan University, Taipei, Taiwan, Republic of China
Disaccharides tagged with p-aminobenzoic acid (ABA) were separated by capillary electro-phoresis (CE) and analyzed on-line with negative ion electrospray ionization tandem mass spectrometry (ESI/MS/MS). The formation of glycosylamine instead of reductive amination was selected as the derivatization reaction. In negative ion ESI, the glycosylamine approach provides more information on linkage and anomeric configuration than reductive amination. In CE analysis of ABA-labeled disaccharides,␣-cyclodextrin (CD) was found to play a crucial role in the separation of linkage isomers. Although ammonium acetate/␣-CD provided the best resolution of linkage isomers, the borate buffer was superior to␣-CD in the separation of disaccharides with the same linkage but different anomeric configuration and/or monosac-charide composition. Both␣-CD and borate suppressed the ion signal in ESI, and operational conditions were successfully obtained using 10 mM␣-CD or 10 mM borate. (J Am Soc Mass Spectrom 2000, 11, 292–300) © 2000 American Society for Mass Spectrometry
T
he growing interest in biological functions of carbohydrates has prompted the need of high resolution separation techniques for the struc-tural analysis of complex carbohydrates. In recent years, capillary electrophoresis (CE) has emerged as an alternative technique to conventional analytical tech-niques (gas chromatography, thin-layer chromatogra-phy, and high-performance liquid chromatography) for carbohydrate analysis. The separation of carbohydrates by CE, especially capillary zone electrophoresis (CZE) has often required the in situ conversion of these compounds into charged species. Charged species like borate [1–11] or metal ions [12] have been used as in situ complexation reagents in the separation of carbohy-drates by CZE. Furthermore, since carbohycarbohy-drates are weakly acidic compounds, they can also be separated as anions under strong alkaline conditions [13–15].Another difficulty encountered in the analysis of sugars is the lack of their inherent chromophore in the ultraviolet-visible region. To visualize carbohydrates for UV or fluorescence detection, introducing a chro-mophore into the molecules has received considerable attention [2–11, 16, 17]. In recent years, derivatization of carbohydrate has been used not only to enable sensitive detection by UV or fluorescence but also to improve the resolution of multicomponents samples in CE analysis. Efficiencies in excess of one million plates per meter
have been achieved by labeling carbohydrates with 8-aminonaphthalene-1,3,6-sulfonate [8].
Reductive amination is the most popular labeling procedure and has been used in the analysis of carbo-hydrates by CE with UV detection [18, 19]. This proce-dure reduces the reducing sugar and produces an open ring product. In the labeling of oligosaccharides, in addition to the very popular reductive amination pro-cedure, glycosylamine approach has been reported [20 – 22]. Unlike reductive amination, the reducing sugar maintains its closed ring structure as in glyco-sylamine. Based on our previous study [20, 21], closed ring derivatives (glycosylamines) provided improved structural information on linkage and ano-meric configuration information compared to open ring products under negative ion FAB/CID or ESI/in source CID.
On-line coupling of CE and mass spectrometry (CE/ MS) is a very promising technique for carbohydrate analysis. To obtain more structural information, disac-charides were derivatized with the glycosylamine ap-proach and studied by CE/MS/MS. The utilities and limitations of this approach are discussed.
Experimental
Chemicals
Glc␣1–2Glc, Glc␣1–3Glc, Glc1–3Glc, Man␣1–3Man, Glc␣1–4Glc, Glc1–4Glc, Gal1–4Glc, Gal1–4Man,
Address reprint requests to G. R. Her, Department of Chemistry, National Taiwan University, Taipei 10764, Taiwan. E-mail: [email protected]
© 2000 American Society for Mass Spectrometry. Published by Elsevier Science Inc. Received June 10, 1999
1044-0305/00/$20.00 Revised November 26, 1999
Glc␣1–6Glc, Glc1–6Glc, Gal␣1–6Glc, Gal1–6Gal were obtained from Sigma Chemical (St Louis, MO). Sodium tetraborate anhydrous, ammonium acetate, and ammonium hydroxide were purchased from Janssen (Belgium). p-Aminobenzoic acid ethyl ester (ABEE), p-aminobenzoic acid (ABA), and m-aminobenzoic sul-fonic acid (ABS) were purchased from Aldrich Chemi-cal (St Louis, MO). Deionized (18 Mohms) water (Milli-Q water system, Millipore, Bedford, MA) was used in the preparation of the samples and buffer solution. HPLC grade 2-propanol was obtained from J. T. Baker (Phillipsburg, NJ).
Preparation of Chromophore-Labeled
Oligosaccharides
The procedure of Reinhold et al. [22] was adopted for the preparation of glycosylamine derivatives. For ABA glycosylamines, the sugars (up to 1 mg) were dissolved in 20L water and 80 L reagent solution (prepared by dissolving 1 g of ABA in 0.5 mL methanol at 50 °C) and reacted at 50 °C for 6 h. The solution was washed with 2 mL of ethyl acetate to remove the excess ABA reagent before the CE separation.
Apparatus
The CZE system was made in-house using a CZE 1000R (Spellman, Plainview, NY) high voltage power supply. CE columns were fused-silica capillary (Polymicro Technologies, Phoenix, AZ) 50m i.d., 375 m o.d., and 92 cm length (84 cm to detector). A small area of the polyimide coating was burned off to form a window for UV detection. The detection (UV-C Rainin, Emeryville, CA) wavelength was set at 254 nm. Before use, the capillary column was washed with 1 M sodium hydrox-ide followed by water and running buffer. The capillary was then equilibrated with the running buffer for 20 min. To avoid analyte adsorption, the capillary column needs to be rinsed with 0.1 N sodium hydroxide be-tween analysis.
Mass spectra were acquired using a LCQ quadrupole ion trap mass spectrometer equipped with an electro-spray ionization source (Finnigan MAT; San Jose, CA). The spray needle voltage was set to ⫺4.5 kV and the spray was stabilized with a nitrogen sheath gas operat-ing at 30 lb/in.2. The stainless-steel inlet capillary was heated to 200 °C. Helium was admitted to the vacuum system to a pressure of 1 mtorr, and the instrument was operated at a background pressure of 2⫻ 10⫺5torr. In MS/MS experiments, a mass range of m/z 160 – 480 was scanned. The automatic gain control was used to set the maximum injection time at 800 ms. In no case did a CE peak produce sufficient ions to trigger the automatic gain control of the ion trap.
Results and Discussion
Choice of Chromophore
UV or fluorescence sensitivity, structural information from product ion spectra, and CE separation efficiency were the important factors in the selection of suitable chromophore in our CE/MS/MS study. Mainly for the CE separation, a charged compound in aqueous solu-tion, m-aminobenzoic sulfonic acid (ABS), was selected as the chromophore. Disaccharides were labeled with the glycosylamine approach because such a derivative (glycosylamine) provided much more linkage informa-tion than the corresponding reductive aminainforma-tion deriv-ative [20, 21].
According to our previous study [21], the ESI mass spectra of the ABEE-tagged disaccharides of different linkages are similar in the positive ion mode but quite different in the negative ion mode. Therefore, the mass analysis was performed in the negative ion mode. The negative ion ESI/MS/MS spectra of ABS-labeled Glc1–4Glc and Glc1–6Glc are shown in Figure 1a,b, respectively. The differences between these two spectra are the absence of the peaks at m/z 316 and 298 in the 1– 6 linked disaccharide. The results indicate that a 1– 4 linkage can be differentiated from a 1– 6 linkage on the basis of the presence or absence of the m/z 316 and 298 ions, but the lack of a characteristic ion in a 1– 6 linked disaccharide might make the assignment ambiguous, especially if these two sugars are not separated by CE. An alternative derivatization reagent, p-aminobenzoic acid (ABA) was then evaluated. In comparison with
Figure 1. Negative ion ESI product ion mass spectra of ABS-labeled (A) Glc1–4Glc and (B) Glc1–6Glc. The major product ions were assigned based on the nomenclature proposed by Domon and Costello [26].
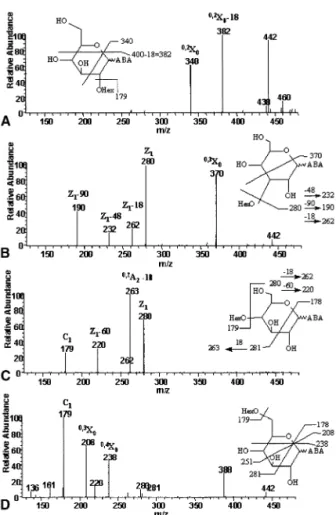
ABS derivatives, ABA-labeled disaccharides yielded many characteristic fragment ions under negative ion ESI/MS/MS (Figure 2). These fragments are presumed to arise from cross-ring cleavage ions on the reducing end monosaccharide and were critical for the differen-tiation of different glycosidic linkages. The characteris-tic fragment ions for all ABA-labeled disaccharides investigated are listed in Table 1. In general, the product
ion spectra are similar to ABEE derivatives in ESI/in source CID [21] and ABBE derivatives in FAB/CID [20]. A notable difference was the observation of a peak at m/z 388, one of the characteristic ions in ABA-tagged 1– 6 linked disaccharide. The corresponding fragment ion was not detected in ABEE derivatives [21] or ABBE derivatives [20].
Determination of the anomeric configuration by mass spectrometry directly is limited mainly because stereoisomers often give very similar mass spectra. Traeger et al. [23] and our group [21] differentiated the anomeric configuration by the relative abundance of selected ions in negative ion ESI mass spectra. In this study, similar to that of the ABEE derivative [21], the relative abundance of some fragment ions was found to be sensitive to the anomeric configurations. For exam-ple, among the three major fragment ions, the intensi-ties of the m/z 370 and 190 ion varied synchronously relative to the intensity of the m/z 280 ion when the anomeric configuration of the 1–3 linked disaccharide was changed. In replicate injections obtained over six consecutive days, the ion ratios of m/z 280/(370⫹ 190)⫾ 2 for Glc1–3Glc–ABA and Glc␣1–3Glc–ABA were 1.01⫾ 0.21 and 0.47 ⫾ 0.19, respectively. The significant difference between these two values pro-vides a reliable method for the detection of the ano-meric configuration of 1–3 linked disaccharides. Al-though anomeric configurations of 1– 4 and 1– 6 linked disaccharides could be determined by the ion ratio as for 1–3 linked disaccharides, examination of the prod-uct ions of 1– 4 and 1– 6 linked disaccharides with different anomeric configuration (Table 1) showed that the peak at m/z 221 was detected in both 1– 4 and 1– 6 linked disaccharides of ␣ configuration but not in  configuration. In ABEE derivatives, the anomeric con-figuration of 1– 4 and 1– 6 linked disaccharides was determined by the relative abundance of certain ions [21]. The determination of the anomeric configuration by the presence or absence of the peak at m/z 221, as proposed in this study, is easier than by the relative abundance of selected fragment ions as suggested for the ABEE derivatives [21].
Figure 2. Negative ion ESI product ion mass spectra of ABA-labeled (A) Glc1–2Glc, (B) Glc1–3Glc, (C) Glc1–4Glc, and (D) Glc1–6Glc. The major product ions were assigned based on the nomenclature proposed by Domon and Costello [26].
Table 1. Specific fragment ions for ABA-labeled disaccharides (m/z)
Glc1–2Glc 340 382 Glc␣1–3Glc 190 232 370 Glc1–3Glc 190 232 370 Man␣1–3Man 190 232 370 Glc␣1–4Glc 221 263 Glc1–4Glc 263 Gal1–4Glc 263 Gal1–4Man 263 Glc␣1–6Glc 208 221 238 388 Glc1–6Glc 208 238 388 Gal␣1–6Glc 208 221 238 388 Gal1–6Gal 208 238 388
CE Analysis of ABA-Labeled Disaccharides of
Different Linkages
The most commonly used background electrolyte in the electrophoretic separation of carbohydrates is borate buffer [10, 11]. Under alkaline conditions, borate ions form complexes with vicinal hydroxyl groups, thus imparting a negative charge to carbohydrates and mak-ing them amenable to migration under an electric field. The electropherogram of ABA-labeled disaccharides obtained by using 10 mM pH 10.0 borate buffer is shown in Figure 3. The mobility of ABA-labeled disac-charides depends on the stability of the complexes formed with borate. The ABA-labeled Glc1–2Glc formed the most stable complex with borate and thus had the highest mobility (the longest retention time) among the four disaccharides. The ABA-labeled Glc1– 4Glc and Glc1–6Glc coeluted and formed the least stable complexes with borate. Borate concentration up to 50 mM has been studied to improve the resolution of Glc1–4Glc–ABA and Glc1–6Glc–ABA, however, no improvement was observed.
Ammonium acetate, one of the widely used buffers for CE-ESI/MS analysis, was then studied to enhance separation of linkage isomers. The migration times of the four ABA-labeled glucose disaccharides were iden-tical when using 50 mM ammonium acetate. This ob-servation can be accounted for by the fact that these ABA-labeled isomers not only have identical molecular masses and very similar pKa values, but also lack of selective interaction between the ammonium acetate and the isomers of ABA-labeled glucose disaccharides. Thus, it is found that the separation of ABA-labeled disaccharides with different linkage can not be achieved by varying the pH of buffer over a limited range (pH 5.5 to 6.5).
Cyclodextrins (CDs) are frequently employed as a running buffer modifier in CE. Separation of ABA-labeled linkage isomers with addition of␣-CD, -CD, or ␥-CD into ammonium acetate was studied. It was found that the resolving power was greatly enhanced with the addition of␣-CD in ammonium acetate. The hydropho-bic interior and cavity size of␣-CD might facilitate the
formation of inclusion complexes with the ABA deriv-atives and improve the separation. The electrophero-grams obtained by using 50 mM ammonium acetate containing 10 mM␣-CD at different pH are shown in Figure 4. The best electropherogram was obtained using a pH 5.5 buffer (Figure 4b). The ABA-labeled Glc1– 2Glc, Glc1–4Glc, Glc1–3Glc, and Glc1–6Glc eluted past the detector in the order of increasing electro-phoretic mobility and, hence, in the order of decreasing interaction with ␣-CD. The concentration of ␣-CD on separation efficiency was also studied. No enhancement of the resolving power was observed with concentra-tions of␣-CD above 10 mM. In comparison with borate buffer, although Glc1–3Glc–ABA and Glc1–4Glc– ABA were still not baseline resolved, the overall sepa-ration power of the ammonium acetate/␣-CD was superior to borate electrolyte for the analysis of linkage isomers.
Despite the fact that the in-source CID spectra pro-vide similar information as MS/MS product ion spec-tra, MS/MS has the advantage of reducing background ions and resulting in a total ion electropherogram (TIE) of higher signal/noise ratio. The on-line CE-ESI/ MS/MS analysis of a mixture of ABA-tagged disaccha-rides of different linkages is given in Figure 5. Ions at m/z 340, 263, 190, and 208, which represented 1–2, 1– 4, 1–3, and 1– 6-linked disaccharides, were selected for the reconstructed ion electropherograms. The CE peak width at half height measured from the electrophero-gram is approximately 13 s. Although 1–3 and 1– 4 linked disaccharides had very similar migration times, the appearance of characteristic product ions provided significant differentiation between these two isomers.
It is well known that the ionization efficiency of the electrospray is deteriorated by the presence of other species in the sprayed solution, such as electrolyte or other matrix molecules [24]. A␣-CD concentration of 10 mM lowered the ESIMS signal of ABA-labeled disac-charides by a factor of approximately 2. However, the use of ␣-CD enabled the separation of ABA-labeled disaccharides of different linkage, otherwise impossible with only ammonium acetate buffer.
CE Analysis of ABA-Disaccharides of Different
Anomeric Configuration and Monosaccharide
Composition
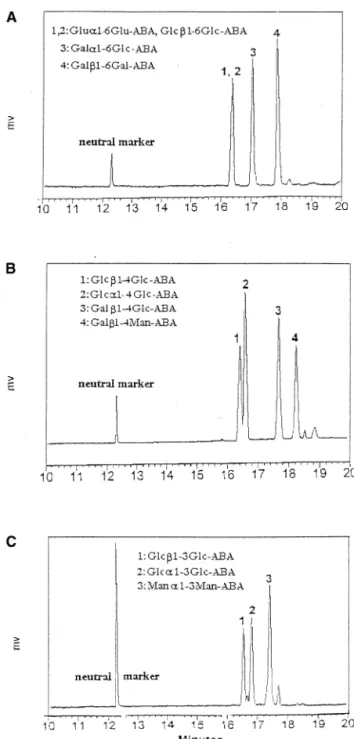
Although ammonium acetate/␣-CD buffer was supe-rior to borate buffer in separating disaccharides of different linkages, carbohydrates of the same linkage but different anomeric configuration or monosaccha-ride composition could not be resolved with the ammo-nium acetate/␣-CD buffer. Borate has been reported to provided enhanced separation of these isomers [10, 11]. The CE/UV electropherograms of mixtures of 1– 6, 1– 4, and 1–3 linked disaccharides using 10 mM pH 10.0 borate buffer are shown in Figure 6a,b,c, respectively. As can be seen, most disaccharides could be separated
Figure 3. CE/UV electropherogram of ABA-tagged disacchar-ides of different linkage. Condition: 20 kV, UV detection at 254 nm. Running buffer: 10 mM borate, pH 10.0. Neutral marker: mesityl oxide.
except for Glc␣1–6Glc–ABA and Glc1–6Glc–ABA. These two anomeric isomers could not be separated even though the concentration of borate was increased to 50 mM. High concentration of borate has been reported to be unsuitable for ESI analysis [25], conse-quently, a buffer with 10 mM borate at pH 10.0 was used for the analysis of ABA-labeled disaccharides of
different anomeric configuration and/or monosaccha-ride composition by CE-ESI/MS/MS.
The stability of sugar– borate complex depends strongly on the number of vicinal hydroxyl groups. The 1– 4 linked disaccharides, Glc␣1–4Glc–ABA and Glc1– 4Glc–ABA formed the least stable complexes with bo-rate. In comparison, Gal1–4Glc–ABA has a higher
Figure 4. The CE/UV electropherograms of ABA-tagged Glc1–2Glc, Glc1–3Glc, Glc1–4Glc, and Glc1–6Glc. Condition: 20 kV, UV detection at 254 nm. Running buffer: 50 mM ammonium acetate containing 10 mM␣-CD at pH: (A) 6.5, (B) 5.5, and (C) 4.5.
electrophoretic mobility due to the galactose moiety, which enables complexation of the cis-oriented hy-droxyl groups at C-3 and C-4. The Gal1–4Man–ABA has the highest mobility because both the terminal galactose and the reducing end mannose have cis-oriented hydroxyl groups. This rational can be also used to explain the elution order of 1–3 and 1– 6 linked disaccharides.
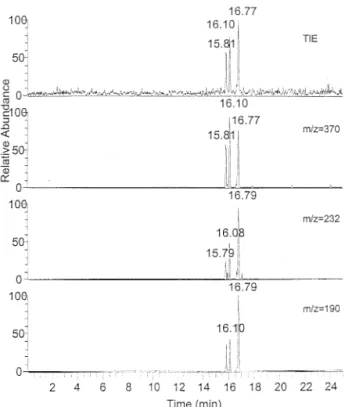
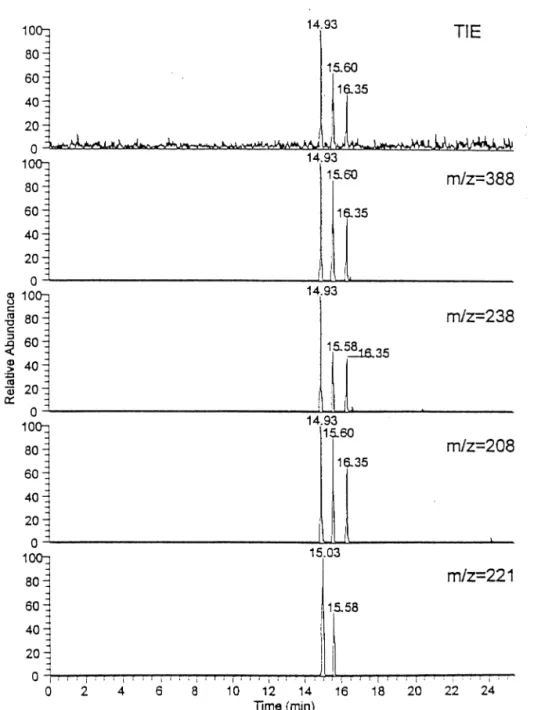
The CE-ESI/MS/MS electropherograms of 1–3, 1– 4, and 1– 6-linked ABA labeled disaccharides using 10 mM borate at pH 10.0 are shown in Figures 7, 8, and 9, respectively. The TIE and mass electropherograms of 1–3 linked ABA-labeled disaccharides are shown in Figure 7, the three ions at m/z 370, 232, 190 are charac-teristic of a 1–3 linkage. The mass electropherograms and TIE of four 1– 4 linked disaccharides are shown in Figure 8. The characteristic ion of a 1– 4 linked disac-charide is the ion at m/z 263. Because the anomeric configuration of a 1– 4 linked disaccharide could be determined according to the presence or absence of the ion at m/z 221, the second peak (15.41 min) was assigned as the␣ form of 1–4 linked disaccharide but the others were all attributed to the  form. Figure 9 shows the mass electropherograms using the ions at m/z 388, 238, 208, and 221. The first three are specific product ions of a 1– 6 linkage. The last one (m/z 221) is a specific product ion of the␣ form of 1–6 and 1–4-linked ABA-labeled
disaccharides. According to the mass electropherogram of m/z 221, peak 1, 2 were assigned as the␣ form of 1–6 linked disaccharides (there are two disaccharides in peak 1 and one of them is due to the␣-form disaccha-ride), whereas peak 3 was attributed to the form of a 1– 6 linked disaccharide.
The selection of the glycosylamine approach rather than the popular reductive amination for labeling the reducing end of disaccharides was mainly due to the fact the negative ion MS/MS mass spectrum of a closed ring (glycosylamine) derivative was much more
char-Figure 5. The CE/MS/MS mass electropherogram of ABA-tagged Glc1–2Glc, Glc1–3Glc, Glc1–4Glc, and Glc1–6Glc mixture. Condition: 20 kV, running buffer: 50 mM ammonium acetate containing 10 mM ␣-CD at pH 5.5. Make up solution (sheath liquid) was water-2-propanol (20:80) containing 0.5% ammonia.
Figure 6. The CE/UV electropherogram of ABA-tagged (A) Glc␣1–6Glc, Glc1–6Glc, Gal␣1–6Glc, and Gal1–6Gal; (B) Glc␣1–4Glc, Glc1–4Glc, Gal1–4Glc, and Gal1–4Man; and (C) Glc␣1–3Glc, Glc1–3Glc, and Man␣1–3Man. Conditions were the same as in Figure 3.
acteristic than that of an open ring (reductive amina-tion) derivative. However, one limitation of this ap-proach is that disaccharides derivatized with glycosylamine can produce two anomers. Anomers of 1–2, 1– 4, and 1– 6-linked ABA disaccharides can be separated by using ammonium acetate/␣-CD buffer system, which might make the electropherogram more complicated. Fortunately, the yield of the minor anomer of most derivatives could be significantly reduced by setting the reaction temperature to 50 °C.
ABEE and ABA have been used as the derivatization reagent of reductive amination in CE/UV analysis [10, 11] using borate as the running buffer. Although ABEE derivatives exhibit lower electrophoretic mobilities than ABA derivatives, the migration order was generally not affected by the different derivatization agent. ABEE derivative was not chosen in this study mainly because of two reasons: (1) The derivatives cannot be separated with ammonium acetate/␣-CD electrolyte, most likely due to the lack of carboxyl group. (2) Because of the acidic carboxyl groups, the sensitivity of ABA deriva-tives in negative ion ESI is approximately 30-fold higher than the neutral ABEE derivatives.
Conclusions
ABA provides the charge and the chromophore for the sensitive detection of disaccharides in ESI/MS and CE/UV, respectively. The product ion spectra of the closed ring (glycosylamine) derivative provides more information on anomeric configuration and linkage than those of the popular reductive amination ap-proach. Running buffer containing ammonium acetate/ ␣-CD provided better resolution than borate in the separation of linkage isomers. The interaction between ␣-CD and the derivatized sugar was believed to play an important role in the separation of linkage isomers. Although ammonium acetate/␣-CD provided better results in the analysis of linkage isomers, running buffer containing borate was found to be superior to ammonium acetate/␣-CD in the separation of disaccha-rides of the same linkage but different anomeric config-uration and/or monosaccharide composition. Both ␣-CD and borate were found to reduce the analyte signal under ESI. To reduce the effect of ion signal suppression, less concentrated␣-CD or borate, provid-ing acceptable CE resolution should be used. Because of the lack of standards, the potential of this approach to the analysis of oligosaccharides remains to be explored. Preliminary results indicated that the linkages of linear oligosaccharides such as maltotriose, isomaltotriose, and maltopentaose could be analyzed with this ap-proach.
Acknowledgment
This work was supported by National Research Council of the Republic of China.
Figure 7. The CE/MS/MS mass electropherogram of ABA-tagged Glc␣1–3Glc, Glc1–3Glc, and Man␣1–3Man mixture. Run-ning buffer: 10 mM borate, pH 10.0. Make up solution (sheath liquid) was water-2-propanol (20:80) containing 0.5% ammonia.
Figure 8. The CE/MS/MS mass electropherogram of ABA-tagged Glc␣1–4Glc, Glc1–4Glc, Gal1–4Glc, and Gal1–4Man mixture. Conditions were the same as in Figure 7.
References
1. Hoffstetter-Kuhn, S.; Paulus, A.; Gassmann, E.; Widmer, H. M. Anal. Chem. 1991, 63, 1541–1547.
2. Honda, S.; Iwase, S.; Makino, A.; Fujiwara, S. Anal. Biochem.
1989,176, 72–77.
3. Liu, J.; Shirota, O.; Novotny, M. Anal. Chem. 1991, 63, 413– 417. 4. Liu, J.; Shirota, O.; Wiesler, D.; Novotny, M. Proc. Natl. Acad.
Sci. USA 1991, 88, 2302–2306.
5. Suzuki, S.; Kakehi, K.; Honda, S. Anal. Biochem. 1993, 205, 227–236.
6. Gluttman, A. J. Chromatogr. A 1997, 763, 271–277.
7. Liu, J.; Shirota, O.; Donald, W.; Novotny, M. Proc. Natl. Acad. Sci. USA 1991, 88, 2302–2306.
8. Stefansson, M.; Novotny, M. Anal. Chem. 1994, 66, 1134 – 1140.
9. Stefansson, M.; Novotny, M. J. Am. Chem. Soc. 1993, 115, 11573–11580.
10. Vorndran, A. E.; Grill, E.; Huber, C.; Oefner, P. J.; Bonn, G. K. Chromatographia 1992, 34, 109 –114.
11. Oefner, P. J.; Vorndran, A. E.; Grill, E.; Huber, C.; Bonn, G. K. Chromatographia 1992, 34, 308 –316.
12. Honda, S.; Yamamoto, K.; Suzuki, S.; Ueda, M.; Kakehi, K. J. Chromatogr. 1991, 588, 327–333.
13. Colo´n, L. A.; Dadoo, R.; Zare, R. N. Anal. Chem. 1993, 65, 476 – 481.
14. Garner, T. W.; Yeung, E. S. J. Chromatogr. 1990, 515, 639 – 644. 15. Vorndran, A. E.; Oefner, P. J.; Scherz, H.; Bonn, G. K.
Chro-matographia 1992, 33, 163–168.
16. Klockow, A.; Widmer, H. M.; Amado`, R.; Paulus, A. Fresenius J. Anal. Chem. 1994, 350, 415– 425.
17. Nashabeh, W.; Rassi, Z. E. J. Chromatogr. 1992, 600, 279 –287.
Figure 9. The CE/MS/MS mass electropherogram of ABA-tagged Glc␣1–6Glc, Glc1–6Glc, Gal␣1– 6Glc, and Gal1–6Gal mixture. Conditions were the same as in Figure 7.
18. Hase, S.; Hara, S.; Matsushima, Y. J. Biochem. 1979, 85, 217–220. 19. Hase, S.; Ibuki, T.; Ikenaka, T. J. Biochem. 1984, 95, 197–203. 20. Li, D. T.; Her, G. R. Anal. Biochem. 1993, 211, 250 –257. 21. Li, D. T.; Her, G. R. J. Mass Spectrom. 1998, 33, 644 – 652. 22. Her, G. R.; Santikarn, S.; Reinhold, V. N.; Williams, J. C.
J. Carbohydr. Chem. 1987, 6, 129 –139.
23. Mulroney, B.; Traeger, J. C.; Stone, B. A. J. Mass Spectrom. 1995, 30, 1277–1283.
24. Cole, R. B. Electrospray Ionization Mass Spectrometry (Part I); Wiley: New York, 1997.
25. Tasi, C. Y.; Her, G. R. J. Chromatogr. 1996, 743, 315–321. 26. Domon, B.; Costello, C. Glycoconjugate J. 1988, 5, 397– 409.