Eu
2+
-Activated Sr
8
ZnSc(PO
4
)
7
: A Novel Near-Ultraviolet Converting
Yellow-Emitting Phosphor for White Light-Emitting Diodes
Chien-Hao Huang,*
,†Yi-Chen Chiu,
†Yao-Tsung Yeh,
†Ting-Shan Chan,
‡and Teng-Ming Chen*
,§ †Material and Chemical Research Laboratories, Industrial Technology Research Institute, Hsinchu, Taiwan 30011, Republic of China ‡National Synchrotron Radiation Research Center, Hsinchu Science Park, Hsinchu, Taiwan 30076, Republic of China§Phosphors Research Laboratory and Department of Applied Chemistry, National Chiao Tung University, Hsinchu, Taiwan 30010,
Republic of China
*
S Supporting InformationABSTRACT: The crystal structure of Eu2+-activated Sr8
ZnSc-(PO4)7:Eu2+phosphor was refined and determined from XRD
profiles by the Rietveld refinement method using a synchrotron light source. This phosphor crystallizes in the monoclinic structure with the I2/a space group. The SZSP:xEu2+ phosphors showed a broad yellow emission
band centered at 511 and 571 nm depending on the concentration of Eu2+, and the composition-optimized
concentration of Eu2+ in the Sr8ZnSc(PO4)7:Eu2+ phosphor
was determined to be 2 mol %. The estimated crystal-field splitting and CIE chromaticity coordinates of Sr8
ZnSc-(PO4)7:xEu2+ (x = 0.001−0.05 mol) were 20181−20983
cm−1 and (0.3835, 0.5074) to (0.4221, 0.5012), respectively,
and the emission band showed a redshift from 547 to 571 nm with increasing Eu2+concentration. The nonradiative transitions
between the Eu2+ions in the Sr8ZnSc(PO4)7host were attributable to dipole−dipole interactions, and the critical distance was
approximately 19.8 Å. The combination of a 400 nm NUV chip with a blend of Sr8ZnSc(PO4)7:0.02Eu2+ and BAM:Eu2+
phosphors (light converters) gave high color rendering indices between 79.38 and 92.88, correlated color temperatures between 4325 and 7937 K, and tuned CIE chromaticity coordinates in the range (0.381, 0.435) to (0.294, 0.310), respectively, depending on the SZSP:0.02Eu2+/BAM:Eu2+ weight ratio. These results suggest that the Sr8ZnSc(PO4)7:0.02Eu2+/BAM:Eu2+ phosphor
blend has potential applications in white NUV LEDs.
KEYWORDS: Sr8ZnSc(PO4)7, yellow-emitting, Eu2+, NUV, white LED, photoluminescence
1. INTRODUCTION
In 1996, Nichia coupled their blue LED with the yellow-emitting Y3Al5O12:Ce3+ (YAG:Ce3+) and developed white
LEDs. Thereafter, much effort has been focused on white LEDs, both in academia and in the industry worldwide. In recent years, white LEDs have attracted much attention because of their high efficiency, small size, compactness, safety (these LEDs are mercury-free), high material stability, long opera-tional lifetime, and resultant energy-saving capacity. Hence, these LEDs are expected to replace conventional incandescent and fluorescent lamps for general lighting applications in the near future.1−3 An LED, however, generates only a limited amount of light and single color at a time. To obtain white light for solid-state lighting, emission spanning the visible spectrum (red, green, and blue) must be generated in the appropriate proportions. To achieve this effect, researchers generally used three approaches for generating white light with LEDs: (a) combining with trichromatic RGB LED chip;4 (b) blue-light LED chip comprised of yellow-emitting phosphor of YAG:Ce3+;5
(c) ultraviolet/near-ultraviolet (UV/NUV) chip
pumped of a phosphor blend of RGB-emitting phosphors.6,7 The disadvantage of trichromatic RGB LED systems is that individual colored LEDs respond differently to the drive current, dimming, operating temperature, and operating time; furthermore, the controls required for color consistency serve to increase the cost factor. The major disadvantages of the combination of a blue InGaN chip and a YAG:Ce3+phosphor are the poor color rendering index (75), which results from the lack of red spectral contribution, and the high color temperature (7756 K).8 Integration of RGB-emitting phos-phors with a UV/NUV chip for white-emitting system does help in generating white light, but this approach is expensive, and the luminous efficiency may degrade because of reabsorption. Recently, white LEDs fabricated using NUV chips (380−420 nm) coupled with a blend of blue- and yellow-emitting phosphors have been found to show favorable Received: August 30, 2012
Accepted: November 21, 2012 Published: November 21, 2012
properties, including tunable correlated color temperature (CCT), high color-rendering index (CRI, Ra), and tunable CIE chromaticity coordinates. Therefore, the development of new yellow-emitting phosphors that can be effectively excited in the NUV range is a very important prospect that requires prompt attention. Many yellow-emitting phosphors for NUV LEDs have been identified and investigated, for example, Ba2Gd(BO3)2Cl:Eu2 +,9 Ba2Mg(BO3)2:Eu2 +,1 0 Ba2
Mg-(PO4)2:Eu2+,11 γ-Ca
2SiO4:Ce3+,Li+, 12
Sr3B2O6:Eu2+,13
Sr3SiO5:Ce3+,Li+,14and Y2(CN2)3:Ce3+.15
To the best of our knowledge, the crystal structures and luminescence properties of Sr8ZnSc(PO4)7:xEu2+ have not yet
been reported. In this study, we focus on the preparation of a series of yellow-emitting Sr8ZnSc(PO4)7:Eu2+ phosphors and
investigate their crystal structure, luminescence properties, and reflectance spectra. We have also successfully fabricated a white pc-LED by using a blend of yellow-emitting Sr8 ZnSc-(PO4)7:Eu2 + and blue-emitting BaMgAl1 0O1 7:Eu2 +
(BAM:Eu2+) phosphors with a 400 nm NUV LED chip and
examined its optical properties. The results indicate that the yellow-emitting Sr8ZnSc(PO4)7:Eu2+ phosphor has great
potential for applications in white NUV LEDs.
2. EXPERIMENTAL SECTION
2.1. Materials and Synthesis. The polycrystalline phosphors composed of Sr8ZnScY(PO4)7:xEu2+(SZSP:xEu2+) were prepared by a solid-state reaction in which the constituent raw materials SrCO3(A. R., 99.9%), ZnO (A. R., 99.99%), Sc2O3(A. R., 99.99%), (NH4)2HPO4 (Merck ≥99%), and Eu2O3 (A. R., 99.99%) were weighed in stoichiometric proportions. The powder mixtures were sintered under a reducing atmosphere (15% H2/85% N2) at 1300°C for 8 h with one intermittent regrinding to prevent the possibility of incomplete reaction.
2.2. Materials Characterization. The crystal structure for phase formation was refined and determined by using synchrotron XRD profiles with λ = 0.7749 Å, recorded with a large Debye−Scherrer camera installed at beamline 01C2 of National Synchrotron Radiation Research Center (NSRRC) in Hsinchu, Taiwan; the GSAS program16 was used for the structural refinements. The photoluminescence (PL) and photoluminescence excitation (PLE) spectra of the samples were analyzed by using a Spex Fluorolog-3 Spectrofluorometer equipped with a 450-W Xe light source. The Commission International de I’Eclairage (CIE) chromaticity coordinates for all samples were measured by a Laiko DT-101 color analyzer equipped with a CCD detector (Laiko Co., Tokyo, Japan). Diffuse reflectance spectra of phosphor samples were measured with a Hitachi 3010 double-beam UV−visible (vis) spectrometer (Hitachi Co., Tokyo, Japan) equipped with a Ø60 mm integrating sphere whose inner face was coated with BaSO4 or Spectralon, and α-Al2O3 was used as a standard in the measurements. Thermal quenching measurements were investigated using a heating apparatus (THMS-600) in combination with the PL equipment.
2.3. White-Light LED Lamps Fabrication. White LED lamps were fabricated by integrating a mixture of transparent silicone resin and phosphors blend of yellow-emitting Sr8ZnSc(PO4)7:xEu2+ (x = 0.01, 0.02, 0.03, 0.04) and blue-emitting BaMgAl10O17:Eu2+ commodity on an 400 nm NUV chip (AOT Product No: C06HC, Spec: 400 V10C, wavelength peak: 395−400 ± 1.32 nm, chip size: 40 × 40 mil2, VF1: 3.8−4.0 ± 0.06 V, IV1: 90−100 ± 2.65 mW) and roast at 120°C/10 h afterward.
3. RESULTS AND DISCUSSION
3.1. Crystal Structure. Figure 1 shows the observed (crosses), calculated (solid line), and difference (bottom) synchrotron XRD profiles for the Rietveld refinement of Sr8ZnSc(PO4)7 and Sr8ZnSc(PO4)7:0.05Eu2+ phosphors at
298K with λ = 0.7749 Å. The Rietveld refinement results indicate that neither the host nor the doped 0.05 mol Eu2+ions
caused any impurity or secondary phases in SZSP host structure. The Sr8ZnSc(PO4)7:xEu2+ crystallizes as a
mono-clinic structure with space group I2/a. For Sr8ZnSc(PO4)7
crystal, the lattice parameters were determined to be a = 18.0681(9) Å, b = 10.6813(5) Å, c = 18.4116(9) Å, V = 2600.74(23) Å3 and the refinement finally converged to R
p =
9.06%, Rwp= 13.05%, andχ2= 5.31. As Sr2+was substituted by
a small Eu2+ion in Sr
8ZnSc(PO4)7host, the lattice parameters
of Sr8ZnSc(PO4)7:0.05Eu2+ became a = 18.0597(10) Å, b =
10.6744(6) Å, c = 18.4036(9) Å, V = 3510.8 Å3, and the
refinement finally converged to Rp= 9.49%, Rwp= 13.79%, and
χ2= 5.81, which was shown in Table 1. All atom positions and
occupancies factors for Sr8ZnSc(PO4)7:0.05Eu2+ phosphors
were shown in Table S1 in the Supporting Information. The simulation of the crystal structure of Sr8ZnSc(PO4)7
using Rietveld refinement is shown in Figure 2. Sr8ZnSc(PO4)7 is isostructural to β-Ca3(PO4)2 crystal structure. In the
β-Ca3(PO4)2 crystal structure, the Ca2+ cations occupy five
positions and one vacancy; Ca1 and Ca2 are eight-coordinated, Ca3 is nine-coordinated by oxygen atoms, the distorted octahedral (six-coordinated) Ca5 site is fully occupied, Ca4 is surrounded by nine oxygen atoms and half-occupied by calcium cations, and Ca6 is a vacancy. The Sr/Zn2, (Sr/Zn1, Sr/Zn3, Sr/Zn4, Sr/Zn5), Sr/Zn6, and Sc sites in the Sr8ZnSc(PO4)7 structure17 correspond to the (Ca1, Ca2), Ca3, (Ca4, Ca6),
Figure 1.Observed (crosses), calculated (solid line), and difference (bottom) synchrotron XRD profiles for the Rietveld refinement of (a) Sr8ZnSc(PO4)7; (b) Sr8ZnSc(PO4)7:0.05Eu2+phosphors at 298 K with λ = 0.7749 Å. Bragg reflections are indicated by tick marks.
and Ca5 sites in theβ-Ca3(PO4)2-type structure, respectively.
In the Sr8ZnSc(PO4)7crystal structure, an 8f site corresponding to the Ca4 and Ca6 sites in theβ-Ca3(PO4)2-type structure is
vacant and Sr/Zn hasfive different coordination numbers: Sr/ Zn2 is defined to be eight-coordinated; Sr/Zn1, Sr/Zn3, Sr/ Zn4, and Sr/Zn5 are nine-coordinated; Sc is six-coordinated; and P shows four four-coordination. The ionic radii for eight-and nine-coordinated Sr2+ are 1.26 and 1.31 Å,
eight-coordinated Zn2+ is 0.9 Å, six-coordinated Sc3+ is 0.745 Å, respectively. However, the ionic radii for six-, eight- and nine-coordinated Eu2+are 1.17, 1.25, and 1.3 Å. On the basis of ionic radii, the Eu2+ions are expected to randomly occupy the Sr2+or
Zn2+or Sc3+ ions sites in the SZSP host.
3.2. Photoluminescence Properties. Figure 3 illustrates the PL/PLE spectra of the Sr8ZnSc(PO4)7:xEu2+ (x = 0.001−
0.05 mol) phosphors under 400 nm excitation. Figure 3a shows the normalized PLE spectra of a series of SZSP:xEu2+ phosphors. The PLE spectrum shows a broad hump between 240 and 500 nm, which is attributed to the 4f7 → 4f65d1
transition of the Eu2+ ions. The full width at half-maximum (FWHMs) of the SZSP:xEu2+PLE spectra increases from 132
to 156 nm with increasing Eu2+content, as shown in Table 2. The broad excitation band matches well with the range of the NUV LED chip (380−420 nm). Figure 3b shows the emission spectra of Eu2+for different values of x (x = 0.001−0.05 mol) in
SZSP:xEu2+ phosphors. The PL spectra of the SZSP:xEu2+ phosphors show broad yellow emission bands from 450 to 800 nm, which can be attributed to the 4f65d1→ 4f7transition of the Eu2+ ions.18
When the doped concentration of Eu2+ is
increased in SZSP:xEu2+ phosphors, the peak emission wavelength is red-shifted from 547 to 571 nm. The red-shift is mainly ascribed to the change in the crystal-field splitting of Eu2+. The crystal-field splitting of Eu2+ (shown in Table 2) is
estimated to be 20181−20983 cm−1 in Sr8ZnSc(PO4)7 (x =
0.001−0.05 mol).19 This phenomenon can be explained in terms of energy transfer from the Eu2+ ions at the higher 5d levels to those at the lower levels, which causes a decrease in the emission energy from the 5d excited state to the 4f ground state and a resultant red-shift of the emission. The estimated Stokes shifts and CIE chromaticity coordinates of Sr8
ZnSc-(PO4)7:xEu2+(x = 0.001−0.05 mol) are 8966−9735 cm−1and
(0.3835, 0.5074) to (0.4221, 0.5012), respectively. The broad asymmetric yellow-emitting band of Sr8ZnSc(PO4)7:xEu2+was
attributed to the 4f65d1 → 4f7 electronic dipole allowed transitions of Eu2+ ions occupying different cation ions and
coordination environments in the Sr8ZnSc(PO4)7 host.
Table 1. Rietveld Refinement and Crystal Data of Sr8ZnSc(PO4)7and Sr8ZnSc(PO4)7:0.05Eu2+ Phosphors
formula Sr8ZnSc(PO4)7 Sr8ZnSc(PO4)7:0.05Eu2+
radiation type (Å) 0.7749 0.7749 2θ range (deg.) 5−40 5−40
T (K) 298 298
form wt 1476.18 1501.92 symmetry monoclinic monoclinic space group I2/a I2/a a (Å) 18.0681(9) 18.0597(10) b (Å) 10.6813(5) 10.6744(6) c (Å) 18.4016(9) 18.4136(9) α = γ (deg) 90 90 β (deg) 132.9186(20) 132.9141(24) V (Å3) 2600.74(23) 2599.71(26) Z 4 4 Rp(%) 9.06 9.49 Rwp(%) 13.05 13.79 χ2 5.31 5.81
Figure 2.Crystal structure of Sr8ZnSc(PO4)7.
Figure 3. (a) Excitation and (b) emission spectra of Sr8 ZnSc-(PO4)7:xEu2+ (x = 0.001−0.05 mol) phosphors under 400 nm excitation.
According to the report of Van Uitert,20 the possible crystallographic site can be investigated theoretically by the following equation21 = −⎜ ⎟ − ⎡ ⎣ ⎢ ⎢ ⎛ ⎝ ⎞⎠ ⎤ ⎦ ⎥ ⎥ E Q 1 V 4 10 V nE r 1/ /80 a (1)
where E represents the position of the d-band edge in energy for the rare-earth ion (cm−1), Q is the position in energy for the lower d-band edge for the free ion (34 000 cm−1for Eu2+); V is
the valence of the activator (Eu2+) ion (V = 2), n is the number of anions in the immediate shell about the Eu2+ ion, r is the
radius of the host cation replaced by the Eu2+ion (in Å), Eais
the electron affinity of the atoms that form anions (in eV). For PO43− phosphor, the value of Ea is approximately 2.19 eV.
22
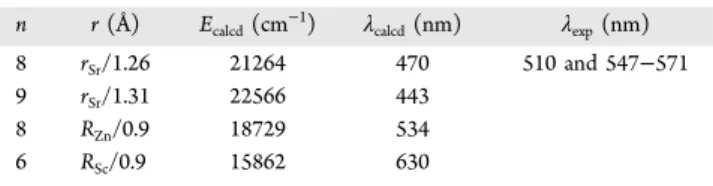
Table 3 show the experimental and calculated emission
wavelengths of Eu2+ ions occupying different cation ions and coordination environments in the Sr8ZnSc(PO4)7 host. The result indicate that the experimental values agree well with the calculated values and the broad asymmetric yellow-emitting band is due to Eu2+ions occupying eight-coordinated Sr2+and Zn2+, and six-coordinated Sc3+ site.
Figure 4 illustrates the concentration dependence of the emission intensity of Sr8ZnSc(PO4)7:xEu2+ (x = 0.001−0.05
mol) under 400 nm excitation. The optimal doping concentration for the PL intensity was 0.02 mol under 400 nm excitation, and the emission efficiency of Sr8
ZnSc-(PO4)7:0.02Eu2+ phosphor compared with that of the
commercial YAG:Ce3+ (excited at 460 nm) phosphor is calculated to be 32.5%. The lower luminescence of Sr8 ZnSc-(PO4)7:0.02Eu2+ could be further enhanced by process
optimization. The emission intensity increased with increasing x when x < 0.02 and the Eu2+ doped content exceeded 0.02 mol, concentration quenching was observed, and the emission intensity decreased with increasing Eu2+content. According to the percolation model, concentration quenching of the compound can occur by two mechanisms:23 (1) interactions between the Eu2+ ions, which result in energy reabsorption
among neighboring Eu2+ ions in the rare-earth sublattice; (2)
energy transfer from a percolating cluster of Eu2+ions to the killer centers.
Nonradiative energy transfer between the Eu2+ions may take place via an exchange interaction or an electric multipolar interaction. The exchange interaction requires a large direct or indirect overlap of the wave functions of the donor and acceptor, and this mechanism is responsible for energy transfer in the case of forbidden transitions. The critical distance for the exchange interaction is approximately 5 Å.24This indicates that the mechanism of exchange interaction plays no role in energy transfer between Eu2+ ions in the Sr
8ZnSc(PO4)7:xEu2+
phosphor. However, energy transfer between the Eu2+ions in
the Sr8ZnSc(PO4)7:xEu2+ phosphor was attributed to
non-radiative electric multipolar interaction. The mechanism of interaction between the Eu2+ ions can be expressed by the
following equation25 β = + θ I x k x 1 ( ) /3 (2)
where k andβ are constants for each interaction for a given host lattice, χ is the activator concentration; According to the research result of Van Uitert, θ = 3 for the energy transfer among the nearest-neighbor ions, asθ = 6, 8, 10 corresponds to dipole−dipole, dipole−quadrupole, quadrupole−quadrupole interactions, respectively. The inset of Figure 4 illustrates the I/x dependence on x on a logarithmic scale. log(I/xEu2+)
showed a relatively linear dependence on log(xEu2+), and the slope was determined to be−0.9922. The value of θ was found to be approximately 3. This result indicated that the energy Table 2. Excitation and Emission Bands, Stokes Shift, Crystal Field Splitting, Normalized PL Intensity, and the CIE Coordinates of Sr8ZnSc(PO4)7:xEu2+ (x = 0.001−0.05 mol) Phosphors
Eu2+conc. λ
exrange (nm) fwhm ofλex(nm) λem(nm) Stokes shift (cm−1) crystalfield splitting (cm−1) relative PL intensity (%) CIE (x, y)
0.001 240−450 132 547 8966 20181 75.5 (0.3835, 0.5074) 0.003 240−460 137 550 9066 20188 80.5 (0.3892, 0.5066) 0.005 240−470 140 552 9132 20319 85.5 (0.3897, 0.5061) 0.010 240−480 144 554 9197 20448 93.7 (0.3927, 0.5054) 0.020 240−490 151 562 9454 20786 100.0 (0.4108, 0.5042) 0.030 240−500 154 569 9673 20991 90.8 (0.4195, 0.5030) 0.040 240−500 156 570 9704 20822 85.6 (0.4201, 0.5022) 0.050 240−500 156 571 9735 20983 65.0 (0.4221, 0.5012)
Table 3. Experimental and Calculated Emission Wavelengths of Eu2+Ions Occupying Different Cation Ions and
Coordination Environments in the Sr8ZnSc(PO4)7Host
n r (Å) Ecalcd(cm−1) λcalcd(nm) λexp(nm)
8 rSr/1.26 21264 470 510 and 547−571
9 rSr/1.31 22566 443
8 RZn/0.9 18729 534
6 RSc/0.9 15862 630
Figure 4. Concentration dependence of emission intensity of Sr8ZnSc(PO4)7:xEu2+(x = 0.001−0.05 mol) under 400 nm excitation. The inset illustrates the I/x dependence on x on a logarithmic scale.
transfer among the nearest-neighbor ions and the quenching was proportional to the Eu2+ ions concentration in the SZSP:xEu2+phosphor.26
The critical distance Rcwas estimated by Blasse using the following equation27
π ≈ ⎡ ⎣ ⎢ ⎤ ⎦ ⎥ R V x N 2 3 4 c c 1/3 (3)
where V is the volume of the unit cell, and N is the number of host cations in the unit cell. The values of V and N are 2600.74 Å3and 4. The Eu2+−Eu2+distance R
Eu−Eu in SZSP:xEu2+ was
determined to be 53.74, 37.26, 31.43, 24.94, 19.80, 17.30, 15.71, and 14.59 Å for x = 0.001, 0.003, 0.005, 0.01, 0.02, 0.03, 0.04, and 0.05, respectively. The aforementioned result indicated that with an increase in the doped Eu2+ molar concentration, R
c
decreased and the crystal-field splitting of the 5d bands of the Eu2+ ions increased, leading to a continuous increase in the
redshift with the doped Eu2+ concentration (Figure 3b and Table 2).The critical concentration (xc) of Eu2+ in the SZSP
host was found to be 0.02 mol. Therefore, the Rc value for
energy transfer was calculated to be 19.80 Å.
3.3. Reflectance Spectra Properties. The diffuse reflectance spectra of Sr8ZnSc(PO4)7 and Sr8 ZnSc-(PO4)7:0.02Eu2+ and the PL/PLE spectra of Sr8
ZnSc-(PO4)7:0.02Eu2+ are shown in Figure 5. The SZSP host
material showed energy absorption in the≤350 nm region,28 and the band gap was estimated to be about 4.34 eV (34965 cm−1). As Eu2+ ions were doped into the SZSP host, the
reflection spectra of the host became different from that of SZSP:0.02Eu2+: a strong broad absorption, assigned to the 4f7
→ 4f65d1 absorption of the Eu2+ ions, was observed in the
240−500 nm NUV range for SZSP:0.02Eu2+. The broad
absorption from 240 to 450 nm for the SZSP:0.02Eu2+ phosphor matched well with the excitation spectra. The as-synthesized SZSP:0.02Eu2+ phosphor exhibited very broad excitation bands (PLE spectra) from 240 to 500 nm, indicating efficient excitation of the phosphor by the NUV LED chips (380−420 nm) for applications in white NUV LEDs. The emission spectra showed a strong, broad yellow emission band in the range 450−800 nm, centered at 511 and 564 nm, typically attributed to the 4f65d1 → 4f7 electronic-dipole-allowed transitions of Eu2+ ions. The broad asymmetric
emission band for SMGP:Eu2+was attributed to the transition
of Eu2+occupying thefive crystallographically distinct Sr2+sites
in the SZSP host.29
3.4. EL Spectrum of White-Light LED Lamp. To demonstrate the potential application of Sr8ZnSc(PO4)7:xEu2+
phosphors, white LED lamps were fabricated using a 400 nm NUV chip combined with a blend of blue-emitting BaMgAl10O17:Eu2+ (BAM:Eu2+) and yellow-emitting Sr
8
ZnSc-(PO4)7:xEu2+ phosphors driven by 350 mA current. Figure 6
shows the electroluminescence (EL) spectra of the lamps. Four emission bands could be clearly seen in Figures 6a−d: 400 nm, attributed to the NUV chip; 454 nm, attributed to BAM:Eu2+;
and 511−571 nm, attributed to the SZSP:xEu2+ phosphor. With increasing Eu2+ doped concentration, the CIE
chroma-ticity coordinates (x, y) of the white LEDs were measured as (0.311, 0.360), (0.322, 0.359), (0.329, 0.360) eventually to (0.325, 0.356) for SZSP:xEu2+phosphors with x = 0.01, 0.02, 0.03, and 0.04. The color rendering index (CRI) increased when the Eu2+-doped concentration was less than 0.02 mol, and hence, the optimal Eu2+ion concentration was identified to be
0.02 mol (CRI, Ra = 87.15, Figure 6b). However, the correlated color temperature (CCT) decreased as the Eu2+concentration
increased, reaching a maximum at x = 0.02 mol (5520 K), and then increased from 5520 K (Figure 6b) to 5829 K (Figure 6d). The luminous efficacy of 400 nm NUV chip combined with a
Figure 5.Diffuse reflectance spectra of Sr8ZnSc(PO4)7 (black line) and Sr8ZnSc(PO4)7:0.02Eu2+ (red line), and PL/PLE spectra of Sr8ZnSc(PO4)7:0.02Eu2+phosphor.
Figure 6.Electroluminescent spectra of white-LED lamps fabricated using a 400 nm NUV chip combined with a blend of blue-emitting BaMgAl10O17:Eu2+and yellow-emitting (a) Sr8ZnSc(PO4)7:0.01Eu2+, (b) Sr8ZnSc(PO4)7:0.02Eu2+, (c) Sr8ZnSc(PO4)7:0.03Eu2+, (d) Sr8ZnSc(PO4)7:0.04Eu2+ phosphors. Insets show the photograph of the LED lamp package driven by 350 mA current.
blend of BAM:Eu2+and SZSP:xEu2+white LED were measured
to be 15.3, 13.2, 10.9, and 9.6 lm/W for Figure 6a to Figure 6d. The lower values of luminous efficacy of the fabricated white LEDs were due to poor chip and quantum efficiencies. The insets of Figure 6a−d show the photographs of a white LED lamp package driven by 350 mA current.
Figure 7a shows the EL spectrum of white LEDs composed of a 400 nm NUV chip and a phosphor blend of
BaMgAl10O17:Eu2+ and Sr
8ZnSc(PO4)7:0.02Eu2+ in various
mixing ratios. The EL spectrum of the white LEDs shows four emission bands at 400, 454, 501, and 562 nm, which are due to the NUV chip, BAM:Eu2+, and SZSP:0.02Eu2+ phosphors, respectively. The EL spectrum of BAM:Eu2+ at
454 nm increases with increasing BAM:Eu2+ weight ratio. When the BAM:Eu2+ weight ratio is increased, the CCT
continuously increases from 3868 to 7937 K, while Ra gradually increases from 66.38 to a maximum of 92.88, as shown in Table 4 (point g in Figure 7a). The eight CRIs and average Ra values of the white LEDs driven by 350 mA current are listed in Table S2 in the Supporting Information. On the other hand, Ra and the CIE color coordinates of the white LED with the blue InGaN chip pumped to the YAG:Ce3+ phosphor, whose spectrum is shown in Figure 7b, are 78.38 and (0.302, 0.315), respectively, at a CCT of 7272 K. The white NUV LEDs fabricated in this study show high Ra values and low CCT values. Therefore, the results indicate that the BAM:Eu2+/ SZSP:0.02Eu2+blends display suitable colors and tunable CCT
and high Ra values for application in white NUV LEDs. Figure 8 shows the electroluminescence spectra of the fabricated white LED under various currents (150−750 mA). The inset of
Figure 8 displays the variation of CIE chromaticity coordinates of white LED operated under different currents. With increasing the current from 150 mA to 750 mA, the CIE chromaticity coordinates blue-shift slightly tuned from (0.3256, 0.3659) at 150 mA to (0.3222, 0.3593) at 350 mA and eventually to (0.3175, 0.3499) at 750 mA with correlated color temperature 5481, 5520, and 5903 K. The color rendering index Ra of the fabricated LED was found to increase from 85.1 to 87.9 with increasing the forward-bias current, as shown in Table S3 in the Supporting Information. The results demonstrated the excellent color stability of Sr8ZnSc(PO4)7: Eu2+phosphors with different driving currents.
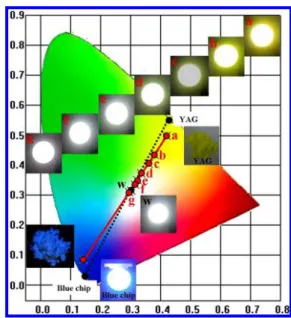
Figure 9 shows the CIE chromaticity diagram of white LEDs with various BaMgAl10O17:Eu2+ and Sr8ZnSc(PO4)7:0.02Eu2+
mixing ratios. By weight ratio tuning, the outputs of the BAM:Eu2+ and SZSP:0.02Eu2+ phosphors were found to systematically emit hues and chromaticity coordinates (x, y) of whitet LEDs from yellow-light (point a, (0.421, 0.497)) through warm-white (point c, (0.360, 0.405)) and then to white-light (point f, (0.314, 0.336)) region with increasing BAM:Eu2+weight ratio. The inset shows the photograph of the
LED package driven by 350 mA current. For comparison, a blue InGaN chip pumped with YAG:Ce3+ phosphor was
considered, and this system was found to emit white light with CIE chromaticity coordinates of (0.302, 0.315). The white NUV LEDs fabricated in this study (point e) showed higher Ra
Figure 7.EL spectrum of white LEDs composed of (a) 400 nm NUV chip and a phosphor blend of BaMgAl10O17:Eu2+ and Sr8 ZnSc-(PO4)7:0.02Eu2+ in various mixing ratios; (b) InGaN chip pumped with YAG:Ce3+phosphor, driven by 350 mA current.
Table 4. CIE Chromaticity Coordinates, CCT, andRa of White LEDs Having a Phosphor Blend of BAM:Eu2+and SZSP:0.02Eu2+with 400 nm NUV Chip Driven by 350 mA
Current
CIE coordinates
white-light LEDs CIE site x y CCT (K) Ra a 0.421 0.497 3868 66.38 b 0.381 0.435 4325 79.38 c 0.360 0.405 4721 82.13 d 0.336 0.372 5370 85.75 e 0.322 0.349 5956 88.88 f 0.314 0.336 6395 90.63 g 0.294 0.310 7937 92.88 w 0.302 0.315 7272 78.38
Figure 8. Electroluminescence spectra of the fabricated white LED under various currents (150−750 mA). The inset displays the variation in CIE chromaticity coordinates of white LED operated under different currents.
values (88.88 for SZSP:0.02Eu2+, 78.38 for YAG:Ce3+) and lower CCT values (5956 K for SZSP:0.02Eu2+, 7272 K for
YAG:Ce3+). The results obtained for the LED package demonstrated that SZSP:0.02Eu2+ has potential applications
in the white NUV LEDs with excellent Ra.
4. CONCLUSIONS
In summary, a novel Eu2+-activated Sr
8ZnSc(PO4)7
yellow-emitting phosphor has been synthesized and evaluated for use in white NUV LEDs. The excitation and reflectance spectra of this phosphor show strong broad absorption in the 240−500 nm region, which matches well with that in the case of NUV chips; the emission intensity of the optimized Sr8
ZnSc-(PO4)7:Eu2+ is 0.02 mol under 400 nm excitation. The
emission band shows a redshift (from 547 to 571 nm) with increasing Eu2+concentration, mainly because of the change in
the crystal-field splitting of Eu2+. The emission wavelength, Stokes shift, crystal-field splitting, and CIE chromaticity coordinates of the Sr8ZnSc(PO4)7 (x = 0.001−0.05 mol)
phosphors are estimated to be in the range 547−571 nm, 8966−9735 cm−1, 20181−20983 cm−1, and (0.3835, 0.5074) to (0.4221, 0.5012), respectively, depending on the Eu2+ molar
concentration. Moreover, white NUV LEDs are fabricated by integrating a 400 nm NUV chip and a mixture of yellow-emitting Sr8ZnSc(PO4)7:0.02Eu2+and blue-emitting BAM:Eu2+
phosphors into a single package. Under 350 mA forward-bias current, the package shows a high Ra between 79.38 and 92.88, CCT between 4325 and 7937 K, and tuned CIE chromaticity coordinates ranging from (0.381, 0.435) to (0.294, 0.310) when the yellow-to-blue-phosphor weight ratio is changed. These results demonstrate that Sr8ZnSc(PO4)7:xEu2+phosphors have
considerable potential for use in NUV chips as compared to that incorporating YAG:Ce3+and pumped by blue LED chips [CIE = (0.302, 0.315), CCT = 7272 K, Ra = 78.38]. Therefore, our novel yellow-emitting Sr8ZnSc(PO4)7:Eu2+ phosphor can
serve as the key material for phosphor-converted white NUV LEDs.
■
ASSOCIATED CONTENT*
S Supporting InformationAtomic positions and lattice parameters for Sr8
ZnSc-(PO4)7:0.05Eu2+ phosphors; eight CRIs and Ra values of
white LEDs having a phosphor blend of BAM:Eu2+ and
SZSP:0.02Eu2+ with 400 nm NUV chip driven by 350 mA
current; CIE chromaticity coordinates, CCT, Ra of as-fabricated white-LED under various currents (150−750 mA). This material is available free of charge via the Internet at http://pubs.acs.org.
■
AUTHOR INFORMATIONCorresponding Author
*Tel: +886-3-5732438. E-mail: [email protected] (C.-H.H.); [email protected] (T.-M.C.).
Notes
The authors declare no competingfinancial interest.
■
ACKNOWLEDGMENTSThis research were supported by Industrial Technology Research Institute under Contract B301AR4850 (C.H.H.) and in part by National Science Council of Taiwan under Contract NSC101-2113-M-009-021-MY3 (T.M.C.).
■
REFERENCES(1) Kim, J. S.; Jeon, P. E.; Choi, J. C.; Park, H. L.; Mho, S. I.; Kim, G. C. Appl. Phys. Lett. 2004, 84, 2931−2933.
(2) Im, W. B.; Kim, Y. I.; Fellows, N. N.; Masui, H.; Hirata, G. A.; Den, S. P.; Seshadri, B. R. Appl. Phys. Lett. 2008, 93, 091905.
(3) Nishida, T.; Ban, T.; Kobayashi, N. Appl. Phys. Lett. 2003, 82, 3817−3819.
(4) Muthu, S.; Schuurmans, F. J. P.; Pashley, M. D. IEEE. J. Sel. Top. Quantum Electron. 2002, 8, 333−338.
(5) Lee, S.; Seo, S. Y. J. Electrochem. Soc. 2002, 149, J85−j88. (6) Huang, C. H.; Chen, T. M. J. Phys. Chem. C 2011, 115, 2349− 2355.
(7) Huang, C. H.; Wu, P. J.; Lee, J. F.; Chen, T. M. J. Mater. Chem. 2011, 21, 10489−10495.
(8) Jang, H. S.; Won, Y. H.; Jeon, D. Y. Appl. Phys. B: Laser Opt. 2009, 95, 715−720.
(9) Xia, Z.; Zhuang, J.; Liao, L.; Liu, H.; Luo, Y.; Du, P. J. Electrochem. Soc. 2011, 158, J359−J362.
(10) Zhang, X.; Fei, L.; Shi, J.; Gong, M. Physica B 2011, 406, 2616− 2620.
(11) Wu, Z.; Gong, M.; Shi, J.; Wang, G.; Su, Q. Chem. Lett. 2007, 36, 410−411.
(12) Jang, H. S.; Kim, H. Y.; Kim, Y. S.; Lee, H. M.; Jeon, D. Y. Opt. Express 2012, 20, 2761−2771.
(13) Song, W. S.; Kim, Y. S.; Yang, H. Mater. Chem. Phys. 2009, 117, 500−503.
(14) Jang, H. S.; Jeon, D. Y. Opt. Lett. 2007, 32, 3444−3446. (15) Wu, Y. C.; Chen, T. M.; Chiu, C. H.; Mo, C. N. J. Electrochem. Soc. 2010, 157, J342−J346.
(16) Larson, A. C.; Von Dreele, R. B. Generalized Structure Analysis System (GSAS), Los Alamos National Laboratory Report LAUR 86-748; Los Alamos National Laboratory: Los Alamos, NM, 1994.
(17) Belik, A. A.; Izumi, F.; Ikeda, T.; Okui, M.; Malakho, A. P.; Morozov, V. A.; Lazoryak, B. I. J. Solid State Chem. 2002, 168, 237− 244.
(18) Huang, C. H.; Luo, L.; Chen, T. M. J. Electrochem. Soc. 2011, 158, J341−J344.
(19) Chiu, Y. C.; Huang, C. H.; Lee, T. J.; Liu, W. R.; Yeh, Y. T.; Jang, S. M.; Liu, R. S. Opt. Express 2011, 19, A331−A339.
(20) Van Uitert, L. G. J. Lumin. 1984, 29, 1−9.
(21) Xia, Z.; Liu, R. S.; Huang, K. W.; Drozd, V. J. Mater. Chem. 2012, 22, 15183−15189.
Figure 9. CIE chromaticity diagram of white LEDs with BaMgAl10O17:Eu2+and Sr8ZnSc(PO4)7:0.02Eu2+phosphors in various mixing ratios. Inset shows the photograph of the LED package driven by 350 mA current.
(22) Li, P. L.; Yang, Z. P.; Wang, Z. J.; Guo, Q. L. Chin. Phys. B 2008, 17, 1135−1138.
(23) Kuo, T. W.; Huang, C. H.; Chen, T. M. Opt. Express 2010, 18, A231−A236.
(24) Dexter, D. L. J. Chem. Phys. 1953, 21, 836−850.
(25) Vanuiter, L. G. J. Electrochem. Soc. 1967, 114, 1048−1053. (26) Xia, Z.; Liu, J.; Li, Q.; Sun, J. Electrochem. Solid-State Lett. 2007, 1, J4−J8.
(27) Blasse, G. Philips Res. Rep. 1969, 24, 131−144.
(28) Huang, C. H.; Chen, T. M. Inorg. Chem. 2011, 50, 5725−5730. (29) Zhang, X.; Chen, H.; Ding, W.; Wu, H.; Kim, J. J. Am. Ceram. Soc. 2009, 92, 429−432.