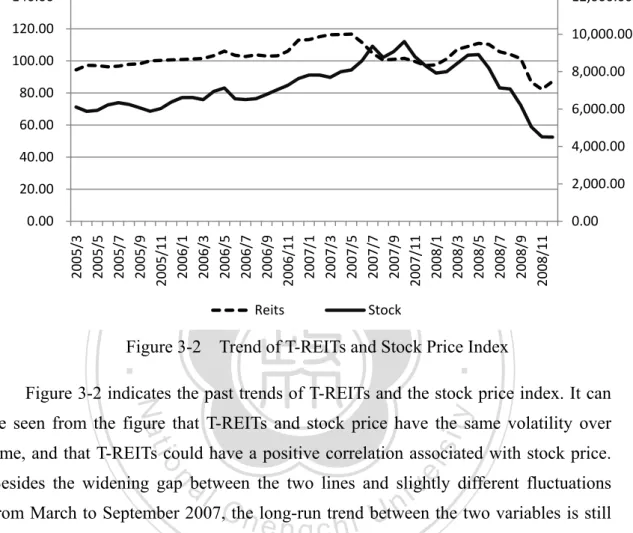
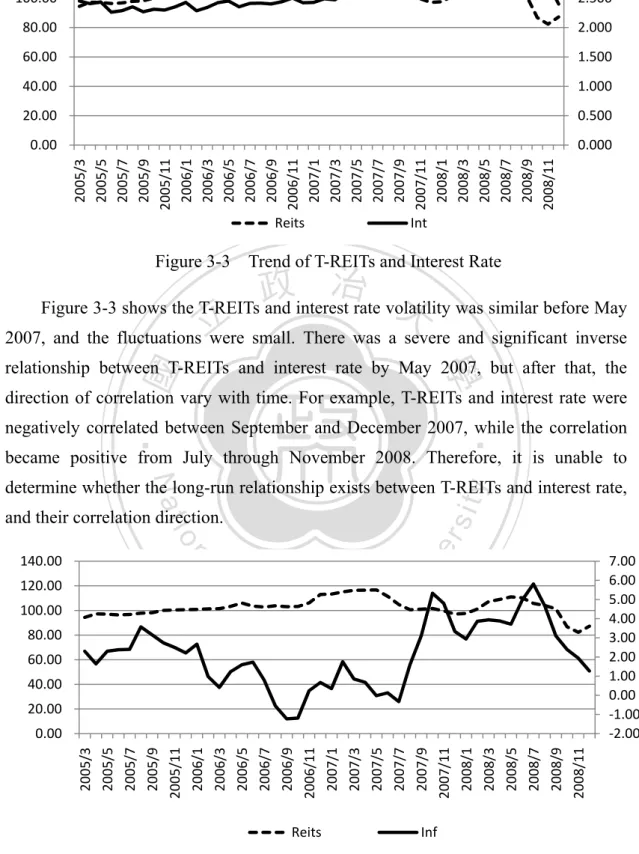
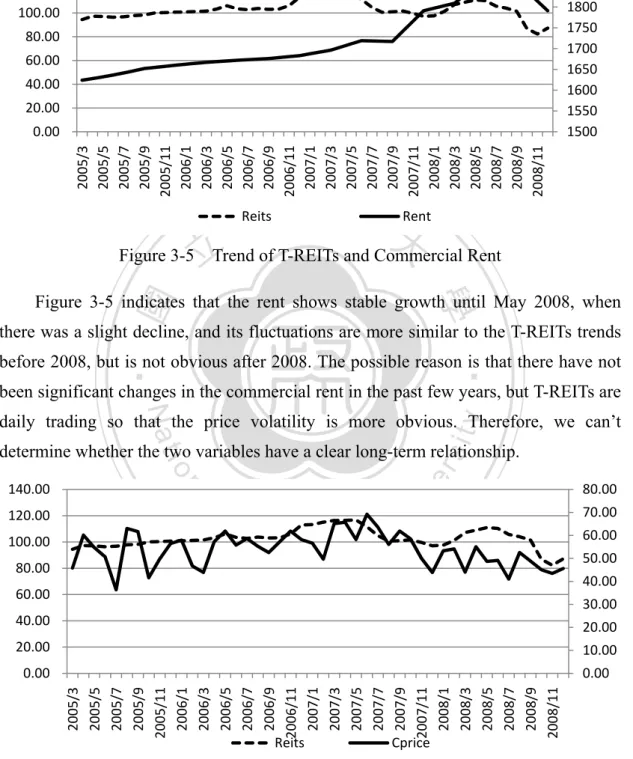
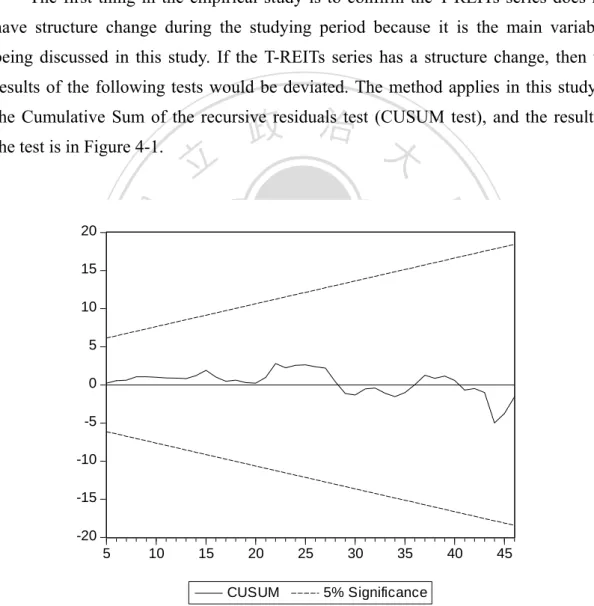
T-REITs與總體經濟及商用不動產市場關聯性之探討 - 政大學術集成
67
0
0
全文
(2) 謝誌 期待已久可以在論文蓋上浮水印的時刻終於要到來了!!非常開心研究所可 以繼續在政大學習,當初帶著既期待又怕受傷害的心情踏入研究所的生活,而在 碩士生涯的兩年中,面臨到自我的學習與論文的奮鬥,在過程中曾經對自己失去 信心,也曾懷疑過自己的能力,更常面臨到挫折與不確定感,但也因為這樣的過 程,我感覺到自己正一步步的成長,磨練自己研究與獨立作業的能力。在這艱辛 的過程裡,幸好身邊有許多幫助我和陪伴我一起走過的好夥伴,讓我能順利的度 過碩士生活。 在研究的過程中,最需要感謝的莫過於我的指導教授林左裕老師,從一開始 找題目與蒐集文獻時就在討論的過程中提供可以研究的思考方向,當面臨到實證. 政 治 大. 結果解釋有困難或是有疑惑時,也提出不同角度的觀點釐清我的問題,讓我對論. 立. 文的架構以及內容的撰寫有更多的想法。也謝謝老師鼓勵我以英文進行寫作,藉. ‧ 國. 學. 由這樣的過程訓練英文寫作能力。謝謝口試委員林哲群老師與張元晨老師,在有 限的時間內看完全文真是辛苦老師們,而老師們提出的中肯建議也讓我對論文後 續修改有更多的發展空間。此外,要特別謝謝張老師在最初進行研究模型設計時. ‧. 給予專業的指導。博士班的芳妮學姐和淑湄學姐,期初和期末報告都麻煩兩位學. y. Nat. 姐真是不好意思,也謝謝學姐們提出的寶貴意見,讓我更了解自己論文所不足的. io. sit. 地方,也提供我改進的方向,讓我獲益良多。謝謝佳君學姐給與的貼心意見,讓. n. al. er. 我了解研究所的事前準備。. Ch. i Un. v. 除了老師和學姐們給與我論文專業上的協助,曾經一起同甘共苦的左家人─. engchi. 博翔學長、于芳、小慈、小雞、馬夫、展豪和宗炘,這兩年大家一起為了案子熬 夜打拼,連寫報告都有左家人特有的輪班制,建立了屬於我們的默契和友誼,因 為有大家的協助,即使時間再緊迫、報告內容再複雜,我們都互相扶持度過那段 煎熬的時光。謝謝博翔學長在碩一時提供許多寫作與資料蒐集的協助,雖然做事 常出包,但也幫助過我許多,可是說好的氣球呢?于芳的活潑和網拍功力讓我的 碩士生活變得有趣許多,雖然有時候讓我很無奈,還有笑聲太開心讓我家人覺得 奇怪;小慈會在我心情低落時提供心靈上的輔導,真的是我的心靈導師啊!希望 張老師專線可以一直開放;小雞時常發揮搞笑的本領帶給大家歡樂,雖然有時候 做事時試圖挑戰我的極限讓我生氣;馬夫原來是個 high 咖,總是在聚餐或是唱 歌時帶動大家的氣氛;展豪和宗炘在學長姐們忙碌的時候伸出援手,讓我們可以 專心的研究論文;新加入的小學妹逸芬最近跟著大家一起活動也是辛苦了…過往 這一切的一切,都要謝謝大家。.
(3) 碩二的夥伴們,不論是平淡的研究室生活或是放鬆心情的一起出遊,因為有 了你們的參與,讓我的研究生活豐富許多,也留下了珍貴的美好回憶。還記得大 家在寫論文時會偷偷聚集在研究室的一角聊天,也會一起討論課程或是論文的內 容(謝謝于婷在時間序列的部分幫助我許多) ;或者是趁著學校放假的時間一起 到郊外走走,抒發寫論文時的壓力與體驗放鬆的心境。謝謝常出外勤的香君、王 王、汝汝、泳泳、妍汎和伊芳,在南庄、福隆、台中等大小行程中,因為有你們 讓我更珍惜這些相處的時光。碩一的學弟妹們,謝謝你們在畢業的前夕給與一個 難忘的謝師宴回憶,你們真的很用心,尤其是最後的離別影片,讓我感動到流淚。 遠在北大的佳鈴以及大學的好朋友們,雖然我們相聚的時間變少了,但對彼此的 關心卻沒有減少,你們偶爾一句鼓勵或是關心的話語,都讓我備感窩心,也慶幸 自己可以有機會認識你們。 最後我可以有今天的成果,要感謝我的爸爸、媽媽和弟弟,雖然我很少在家. 政 治 大 些事情感到疑惑時,也會傾聽我的煩惱並幫助我,讓我可以有最安心的依靠,我 立 提到論文的事情,但家人總是做為我的後盾在背後默默的付出關心,當我對於某 愛你們!!. ‧ 國. 學. 要感謝的人真的太多,對於曾經給過我幫助或鼓勵的所有人,真的很感謝你. ‧. 們。當我有想放棄念頭或是沒有動力繼續的時候,也因為有你們的鼓勵和支持, 讓我找回可以繼續前進的力量。碩士生活即將要接近尾聲,過去的兩年有歡笑也. sit. y. Nat. 有淚水,而現在這些都將成為美好回憶中的一頁。未來的人生道路中一定還會碰. io. al. n. 路、迎接挑戰。. er. 到許多問題和難關,但我會記得大家曾給予我的關心和鼓勵,勇敢的邁向新的道. Ch. engchi. i Un. v. 蔚楚 2010/7 於綜院六樓研究室.
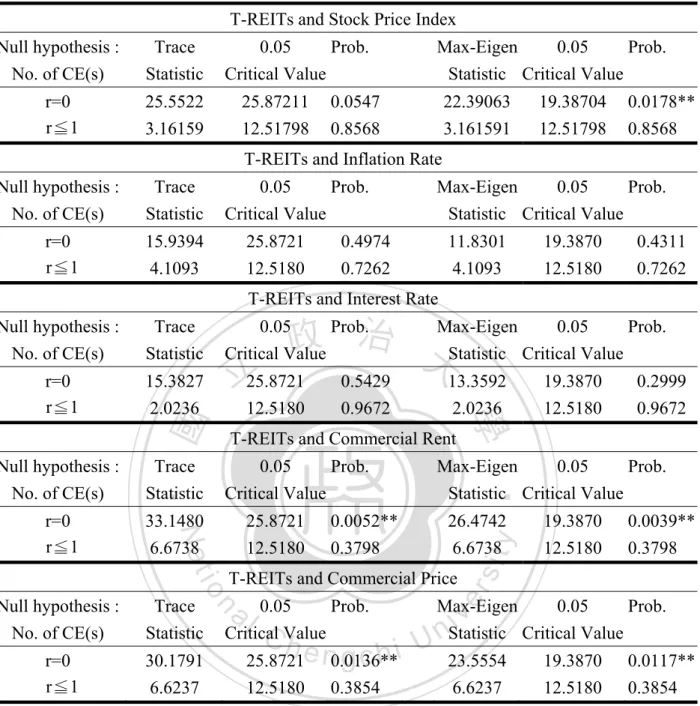
(4) 摘要. 台灣不動產投資信託(T-REIT)自 2005 年發行至今已逾四年,過去國內相關 的文獻多集中於法律面、制度架構及問卷調查等相關研究,對於整體市場實際表 現的討論則較缺乏。隨著交易歷史資料的延展,本研究針對國內 REITs 施行的現 況與總體經濟波動及不動產市場之關係進行討論。在總體經濟部分以股價指數、 利率與通貨膨脹進行分析,在不動產市場部分則採用辦公室平均租金水準與實際 商辦交易價格為指標,期望探索 T-REITs 價格與總體經濟及不動產市場間之長期 關係。 本文發現 T-REITs 與股價指數、商辦租金以及商辦交易價格間,均會存在長. 政 治 大 不具有長期均衡關係,且股價指數、商辦租金以及通貨膨脹率與 T-REITs 為正向 立 關係,利率及商辦租金與 T-REITs 則為反向關係。此外,根據因果關係檢定,股. 期均衡關係,即有共整合情形,而 T-REITs 與通貨膨脹率以及 T-REITs 與利率間. ‧ 國. 學. 價指數與通貨膨脹率皆領先 T-REITs,而商辦租金與 T-REITs 為雙向回饋。本文 結果顯示,台灣 REITs 與總體經濟及商用不動產市場具有長期均衡關係,亦即總. n. er. io. al. sit. Nat. 關鍵詞:不動產投資信託、REITs、共整合、因果關係. y. ‧. 體經濟的變動以及不動產市場的波動可做為探討 T-REITs 長期變化的指標。. Ch. engchi. i Un. v.
(5) Abstract Taiwan launched the first Real Estate Investment Trusts (T-REITs) in 2005. However, over the past few years, studies regarding T-REITs mainly focused on legal system, institutional framework and questionnaire surveys, but lack of empirical analysis on the performance of T-REIT markets. This study therefore intends to explore the cointegration and causality relationship among the T-REITs, macroeconomy and commercial real estate markets. The macroeconomic factors in this study include the stock prices, interest rate and inflation rate; and the real estate variables include the commercial rents and commercial prices. Empirical results first demonstrate that there exists the long-run relationship among T-REITs, stock prices, commercial rents and commercial prices, but not the. 政 治 大 prices, interest rate and inflation 立 rates as well as commercial rents and commercial interest rate or inflation rate. Moreover, T-REITs are significantly related to stock. ‧ 國. 學. prices. Third, the changes of stock prices and inflation rate lead the change of T-REITs. Finally, there is a significant feedback relationship between T-REITs and commercial rents.. ‧. n. al. er. io. sit. y. Nat. Key words: REITs, Cointegration, Granger Causality. Ch. engchi. i Un. v.
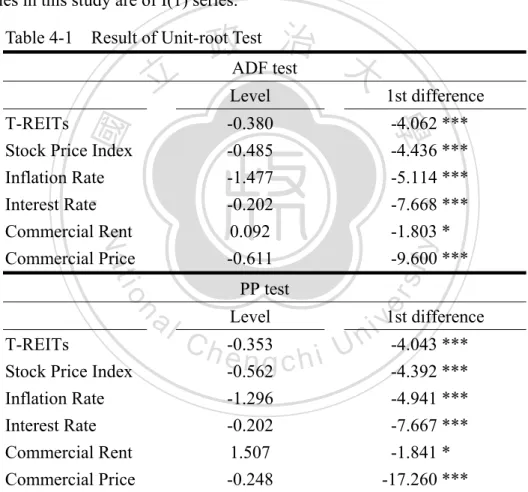
(6) The Relationship Among T-REITs, Macroeconomy and Commercial Real Estate Market. Context Chapter 1 Introduction ................................................................................................ 1 1.1 General Background and Motivation ............................................................... 1 1.2 Research Method and Scope ............................................................................ 3 1.3 Research Overview .......................................................................................... 5 Chapter 2 Literature Review ...................................................................................... 7 2.1 The Exploration of “ Wealth Effect Theory” ................................................... 7 2.2 Review of REITs Volatility Factors ................................................................. 9 2.3 Long-run Relationship Between REITs and Factors...................................... 16 Chapter 3 Research Method and Data Information ............................................... 22 . 政 治 大 3.2 Variable selection and data source ................................................................. 28 立 3.1 Research Method ........................................................................................... 22 3.3 T-REITs Index presentation and data analysis ............................................... 30 . ‧ 國. 學. Chapter 4 Empirical Results ..................................................................................... 38 4.1 Results of Structure Change and Unit-root Test ............................................ 38 . ‧. 4.2 Results of Cointegration Test ......................................................................... 40 . y. Nat. 4.3 Results of Vector Error Correction Model ..................................................... 44 . sit. 4.4 Results of Vector Autoregression ................................................................... 48 . er. io. 4.5 Results of Granger Causality Test .................................................................. 51 . al. n. iv n C 5.1 Conclusions .................................................................................................... 54 hengchi U 5.2 Limitations ..................................................................................................... 55 . Chapter 5 Conclusions and Discussion .................................................................... 54 . 5.3 Recommendations for Further Research ........................................................ 55 References ................................................................................................................... 56 . I.
(7) The Relationship Among T-REITs, Macroeconomy and Commercial Real Estate Market. Figures Figure 1-1 The research process ................................................................................. 6 Figure 3-1 Trend of T-REITs Index(Daily).......................................................... 33 Figure 3-2 Trend of T-REITs and Stock Price Index ................................................ 34 Figure 3-3 Trend of T-REITs and Interest Rate ........................................................ 35 Figure 3-4 Trend of T-REITs and Inflation Rate ....................................................... 35 Figure 3-5 Trend of T-REITs and Commercial Rent ................................................ 36 Figure 3-6 Trend of T-REITs and Commercial Price ................................................ 36 Figure 4-1 The Result of the CUSUM Test .............................................................. 38 Figure 4-2 The Impulse Response of T-REITs.......................................................... 49. 立. 政 治 大. ‧. ‧ 國. 學. n. er. io. sit. y. Nat. al. Ch. engchi. II. i Un. v.
(8) The Relationship Among T-REITs, Macroeconomy and Commercial Real Estate Market. Tables Table 3-1 The Variable Name ................................................................................... 29 Table 3-2 Basic Information of T-REITs................................................................... 32 Table 3-3 The Variables Descriptive Statistics ......................................................... 33 Table 4-1 Result of Unit-root Test ............................................................................ 39 Table 4-2 The Optimal Lag Order ............................................................................ 40 Table 4-3 Results of Cointegration Test ................................................................... 42 Table 4-4 Results of VECM ..................................................................................... 47 Table 4-5 Results of VAR......................................................................................... 48 Table 4-6 The Variance Decomposition of T-REITs ................................................ 50. 政 治 大 Result of Causality with VAR approach .................................................. 51 立. Table 4-7 Result of Causality with Cointegration .................................................... 51. 學 ‧. ‧ 國 io. sit. y. Nat. n. al. er. Table 4-8. Ch. engchi. III. i Un. v.
(9) The Relationship Among T-REITs, Macroeconomy and Commercial Real Estate Market. Chapter 1 Introduction This chapter contains the general background and motivation about the purpose of the paper, the research method and scope, and the research overview; that is, the research structure and process.. 1.1 General Background and Motivation 1.1.1 General Background In the United States, real estate securitization is flourishing in its financial system, especially in real estate investment trust (REITs), and there are lots of academic. 政 治 大. investigations about it. In Asia, Japan’s real estate investment trust is developing steadily; therefore, scholars often choose the United States and Japan as the reference. 立. sample when exploring the topic of REITs. In Taiwan, it has been five years since the. ‧ 國. 學. first real estate investment trust “Fubon No.1” was launched in 2005, but over the past few years, most of the studies about Taiwan real estate investment trust (T-REITs) are. ‧. focused on legal system, institutional framework and questionnaire surveys. There is still lack of discussion about the actual performance of T-REITs market. From an. sit. y. Nat. investment perspective, the price volatility and returns of REITs are the main factors that affect the investors’ willingness, and the changes of price and returns are related. io. n. al. er. to the interaction with other economic markets. However, only a small number of. i Un. v. studies discuss the actual performance in T-REITs, and only a few explore the risk. Ch. engchi. measurement, feasibility, and portfolio investments. Thus, it is necessary and important to study the performance of T-REITs. In the past, people discuss the relationship between real estate prices and macroeconomic variables, but due to the non-mobility and heterogeneity of real estate, the securities products with better liquidity were developed. Because the United States has developed REITs earlier, there are many studies between REITs and macroeconomic variables coming from them. For instance, Clayton and Mackinnon (2003) imply that NAREIT returns and risks should be related to macroeconomic variables that effect bond returns such as stock price, but the effects from stock price became weaker after 1980. The dramatic growth and maturation of the REITs sector since 1992 led to claims that the link between REITs prices and real estate market 1.
(10) The Relationship Among T-REITs, Macroeconomy and Commercial Real Estate Market. fundamentals had become much stronger and made REITs more like real estate. Chatrath and Liang (1998) make a case for an investigation into the possibility of fractional cointegration between REITs and general price levels to test if REITs can act as inflation hedging goods. In Taiwan, there is still lack of studies between T-REITs and macroeconomy, and as a substitute product for physical real estate, the relationship between T-REITs and real estate market needs to be discussed. In addition, the past studies can’t tell the long-run relationship between T-REITs, macroeconomy and commercial real estate market due to time restriction, and it is also important to know whether the lead/lag relationship exists between T-REITs and other economic variables. For real estate market, most of the studies use construction index rather than actual prices or rents as a proxy for real estate market, and it has room for further debate. To deeply understand the performance of T-REITs, there is a need to study the. 政 治 大. relationship between T-REIT, macroeconomy and commercial real estate markets.. 立. To sum up, this study tries to explore the long-run and short-run relationship. ‧ 國. 學. between T-REIT, macroeconomy and commercial real estate markets, and to examine the causality between T-REITs and economic variables.. ‧. 1.1.2 Research Motivation. sit. y. Nat. From the first launch in March 2005 to December 2008, there are 8 T-REITs on the market in Taiwan. This study attempts to explore the long-run and short-run. io. n. al. er. relationship between T-REIT, macroeconomy and commercial real estate markets. i Un. v. within this period. This study intends to discuss the following issues;. Ch. engchi. (1) To examine whether if there is long-run equilibrium relationship among T-REITs, macroeconomy and commercial real estate markets. (2) To explore the short-run relationship between T-REITs, macroeconomy and real estate variables. (3) To examine the lead/lag relationship between T-REITs, macroeconomy and real estate variables.. 2.
(11) The Relationship Among T-REITs, Macroeconomy and Commercial Real Estate Market. 1.2 Research Method and Scope 1.2.1 Research Method (1) Theory and Literature Review The first step is to clarify the macroeconomic variables and real estate market factors that will affect the REITs volatility. We can find the factors that will affect REITs prices, and understand the long-run and short-run relationship between REITs and factors from the past relevant literatures. These theories and findings will be the basis of this study. (2) Modeling and Empirical Analysis. 政 治 大 equilibrium relationship between 立 T-REITs and potential factors. If cointegration The Johansen cointegration method is applied to explore the long-run. relationship exists, we then employ vector error correction model (VECM) to estimate. ‧ 國. 學. the short-term effect; if cointegration does not exist, then we use vector autoregression model (VAR) to estimate the short-term effect. Finally, we will apply Granger. ‧. causality to test the lead/lag relationship between T-REITs and variables.. sit. n. al. er. io. (1) Time Scope. y. Nat. 1.2.2 Research Scope. i Un. v. This study collected data from the launched date. The study period ranges from March 2005 to December 2008.. Ch. engchi. (2) Spatial Extent Currently, most investment objects of T-REITs are located in Taipei1, therefore the commercial rents and prices discussed in this study are properties in Taipei. (3) Research Objects This study tries to explore the relationship between T-REITs and different economic variables, and the variables are divided into macroeconomic variables and the real estate market variables. The current T-REITs investments contain commercial. 1. In all the 8 T-REITs components, there are only one object in Taipei county and one in Tainan city. 3.
(12) The Relationship Among T-REITs, Macroeconomy and Commercial Real Estate Market. buildings, department stores, markets and hotels, but the mainly components are commercial buildings, so this study addresses only the commercial real estate markets.. 立. 政 治 大. ‧. ‧ 國. 學. n. er. io. sit. y. Nat. al. Ch. engchi. 4. i Un. v.
(13) The Relationship Among T-REITs, Macroeconomy and Commercial Real Estate Market. 1.3 Research Overview 1.3.1 Research Framework This study is divided into five chapters. The first chapter is introduction, which contains the general background, motivation and research overview. The second chapter is literature review, mainly discussing the relationship between T-REITs and other variables. The third chapter is research method, establishing long-run and short-run relationship discussion models, and using the empirical data to establish the T-REITs index. The fourth chapter is the empirical studies and results, analyzing the results of the models and discussing the degree of influence among the various variables. The final chapter is the conclusions and discussion, summarizing the. 政 治 大. preceding chapters and proposing recommendations for follow-up researches.. 立. ‧. ‧ 國. 學. n. er. io. sit. y. Nat. al. Ch. engchi. 5. i Un. v.
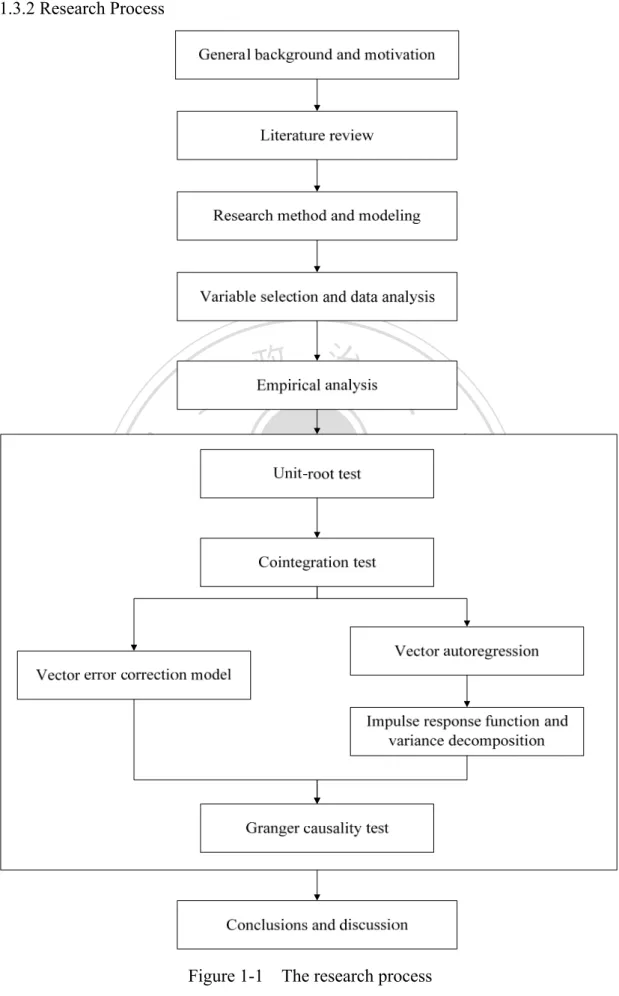
(14) The Relationship Among T-REITs, Macroeconomy and Commercial Real Estate Market. 1.3.2 Research Process. 立. 政 治 大. ‧. ‧ 國. 學. n. er. io. sit. y. Nat. al. Ch. engchi. i Un. v. Figure 1-1 The research process. 6.
(15) The Relationship Among T-REITs, Macroeconomy and Commercial Real Estate Market. Chapter 2 Literature Review REITs in Taiwan is still under development and the relevant studies are not as complete as those of the United States and Japan, therefore, most of the researches use data from the United States, Europe and Japan to do the empirical studies, especially about REITs returns on investment, risks, liquidity and portfolio investments. As well as the real property investment, the REITs price volatility and returns are the key factors to the investors willingness, and REITs frequently act as a substitute variable for real estate market, analyzing the relationship between macroeconomy and real estate markets. This chapter reviews the relevant foreign and domestic literatures about the relationship among REITs, macroeconomic variables and real estate markets, and is divided into three parts. The first part explores the “Wealth Effect Theory”, as. 政 治 大. the basis for analyzing the wealth among the various different markets if there will be. 立. mutual relations. The second part explores macroeconomic and real estate market. ‧ 國. 學. factors that affects REITs, and the third part compiles literatures about the models used in this study.. ‧. 2.1 The Exploration of “ Wealth Effect Theory”. sit. y. Nat. According to life cycle hypothesis, there is a relationship between stock price. io. er. and real estate market price changes; that is, consumption is based on the investors’ total wealth and goods, stocks or other assets and physical assets. When the stock. n. al. i Un. v. prices rise, the investors’ wealth will rise, and the consumption increases. Based on. Ch. engchi. the portfolio theory proposed by Markowitz (1952), investors could benefit from portfolio investments by reducing the risk but maintain the same return level or by increasing the portfolio returns under the same risk level. Both of the methods would reduce the overall investment risk. Thus, when investors increase the investments proportion in the stock markets, they will want to invest in other markets in order to achieve risk diversification. Because real estate goods are both consumption goods and investment goods, they become the first choice when investors want to invest outside stocks. That is, the investors’ wealth increase when stock prices go up, under the consideration of increasing consumption and risk diversification, investors will transfer part of the funds from the stock markets to the real estate markets, making the real estate prices also rise, and that is the so-called the “Wealth Effect” theory. 7.
(16) The Relationship Among T-REITs, Macroeconomy and Commercial Real Estate Market. There are a lot of studies discussing the wealth effect phenomenon between stock markets and real estate markets. Under the portfolio theory, Poterba (2000) observed the consumption status of U.S. stock holders in 1998, and he confirms that the wealth effect generated by the stock markets does exist. Tracy, Schneider and Chan (1999) analyze the portion of household assets in corporate equity and real estate, and they find that the wealth effect generated by the housing prices volatility is larger than by stock prices change. But for the household investors, the wealth effect generated by the rising house prices will offset the housing costs, so the wealth effect should be less than the stock market. Benjamin (2004) used consumption function to estimate the U.S. economy with real estate and financial wealth for quarterly data for the period, January 1952 to Apirl. 政 治 大. 2001, and he finds that the wealth effect generated by the real estate markets is higher than by the financial assets. The decline in the stock market during 2000-2001 had a. 立. limited impact on aggregate demand because of an offsetting real estate wealth effect.. ‧ 國. 學. With the wealth effect theory, although the real estate market is higher value maintenance, its liquidity is low and with high investment costs relative to other. ‧. financial markets. Therefore, after investors make profits in real estate market, they. y. Nat. may turn to invest in the stock market. In addition to the real estate market affecting. sit. the stock market or other financial market, investors’ behavior in real estate. al. er. io. investment may also affect other financial market through the wealth effect. So it can. n. be extrapolated that the stock market and real estate market may have feedback. Ch. i Un. v. relations. This study tries to explore whether the wealth effect occurs between. engchi. T-REITs and other financial markets by analyzing the relationship between T-REITs and other markets.. 8.
(17) The Relationship Among T-REITs, Macroeconomy and Commercial Real Estate Market. 2.2 Review of REITs Volatility Factors There are many factors affecting REITs price volatility, and we divide these factors into two parts, the macroeconomy and real estate markets. In this chapter, we will discuss the relationship and impact between these two markets and REITs. 2.2.1 REITs and Macroeconomy The nature of REITs is mutual funds, and it is similar to macroeconomic markets. Therefore, there are plenty of researches about the relationship between REITs and macroeconomic variables. Besides the legal and institutional side, most of the subjects focus on relationship between REITs returns and volatility and macroeconomic variables such as stock price, inflation rate and interest rate. This chapter reviews the. 政 治 大. relevant studies of these three variables.. 立. (1) REITs and Stock Markets. ‧ 國. 學. In the past, people use linear regression model to discuss the relationship between REITs and other markets. In the relation among REITs, macroeconomy and. ‧. real estate markets, stock markets can affect real estate markets through the wealth. y. Nat. effect; that is, the investors’ wealth increase when stock prices go up. Under the. sit. consideration of increasing consumption and risk diversification, investors will. al. n. the real estate prices.. er. io. transfer part of the funds from the stock markets to the real estate markets, influencing. Ch. engchi. i Un. v. Giliberto (1990) applied correlations and regression model to explore the relations between equity REITs, stock markets and real estate markets, and he found that when the impact of the bond market and stock market effects are removed, REITs returns are significantly correlated to the traditional real estate investment returns, which implies that there is a common factor (or factors) that affects both REITs and real estate market. The study also found that real estate market has lower volatility and is negatively correlated to EREITs returns. In addition, EREIT’s correlation with the stock market has declined over time and their correlation with bond returns has increased. Liu and Mei (1992) stated that while previous studies have found that EREIT returns resemble large cap stocks, they found that returns on EREITs move more 9.
(18) The Relationship Among T-REITs, Macroeconomy and Commercial Real Estate Market. closely with small cap stocks. Moreover, they found that real estate market conditions influence small cap stocks in addition to EREITs. Lee (1992) suggested that stock returns appear prior to Granger-Causal and help explain a substantial fraction of the variance in real activity, and is positively correlated to shocks in stock returns. Myer and Webb (1994) further explain that there is a positive contemporaneous relationship between retail stocks and retail REITs after controlling the market returns. However, no positive evidence is found for a relationship between retail real estate and either retail REITs or retail stocks, which does not support the previous conclusion about the existence of a stronger relationship between retail REITs and retail real estate. He expected that the differences between the results could be due to the presence of overage rents and perhaps other common factors.. 政 治 大. Liu, Hartzell, Greig and Grissom (1990) intended to explore whether the commercial non-form real estate market is segmented from the stock market in U.S.. 立. for the period from June 1978 through September 1986 using Capital Asset Pricing. ‧ 國. 學. Model (CAPM). In general, the results are consistent with the hypothesis that the commercial real estate market is segmented from the stock market as a result of. ‧. indirect constraints, but commercial real estate market appears to be integrated with the stock market when the tests of integration are performed. Therefore, equity REITs. sit. y. Nat. are integrated with the stock market even though the commercial real estate which underlies the equity REITs is segmented from the stock market. They show that. io. n. al. er. indirect barriers such as the cost, amount, and quality of information are the major. i Un. v. source of segmentation. Peterson and Hsieh (1997) find EREIT returns significantly. Ch. engchi. related to three stock market factors, whereas MREIT returns are related to the three stock market factors and two bond market factors in return. From the above literatures, whether we are discussing from the perspective of total REITs and individual REITs or from the perspective of equity REITs and mortgage REITs, the results both occur REITs and stock market are under certain correlation. However, stock market is not the only factor, factors such as bond market and indirect barriers such as cost may also affect REITs performance and reward. (2) REITs and Inflation Rate The discussion about whether REITs can act as inflation hedging products, the past researches have not reached the same conclusion. Fama and Schwert (1977) find 10.
(19) The Relationship Among T-REITs, Macroeconomy and Commercial Real Estate Market. that changes in returns on private residential real estate are positively related to changes in inflation, suggesting that such real estate is a hedge against inflation. Park, Mullineaux and Chew (1990) further examine the hedging ability of REITs and stock market based on the conclusion drawn by Fama and Schwert, and they find that for the most part, REITs are perverse inflation hedges just as stocks. Larsen and Mcqueen (1995) state that according to Fisher, real estate products can act as an effective hedge against inflation; however, the follow-up studies show the opposite result. They indirectly use the relation between gold and gold stocks to explore REITs’ hedging ability. The results turn out that gold is shown to hedge inflation whereas its securitized form, gold stocks, is shown to be a poor hedge against expected inflation. Therefore, the study from the gold market suggests that conclusions about real estate's ability to hedge inflation should not be drawn from equity REIT studies.. 政 治 大. Yobaccio, Rubens and Ketcham (1995) use autoregression model to do the. 立. time-series predictions, and the results indicate that REITs only act as a poor hedge. ‧ 國. 學. against inflation. The results also indicate that REITs, at best, act as a partial hedge against expected inflation and a perverse hedge against unexpected inflation. Studies. ‧. that have shown the real estate’s ability to act as a partial inflation hedge may be the result of well-documented appraisal basis, rather than real estate’s innate ability to be. sit. y. Nat. an effective hedge. Simpson et al (2007) point that EREIT returns do display a negative relationship with inflation, but only when inflation itself is going down. This. io. n. al. er. result indicates that EREIT returns are shown to rise when inflation goes up and also. i Un. v. rises when inflation decreases, and this involves other market mechanisms and fiscal. Ch. engchi. policies. Lu and So (2001), Glascoca et al (2002) conclude that the negative relationship observed between REIT returns and inflation is partially derived from the interaction between monetary policies and inflation. To sum up, based on the researches about REITs and inflation rate we still can’t conclude whether REITs can act as an effective hedge against inflation because the result may change with the time and scope of the research data selection. However, if REITs can be hedged against inflation in the long-run, it implies that there is a long-run relationship between REITs and inflation. (3) REITs and Interest Rate In exploring the relationship between REITs and interest rates, Liu and Mei 11.
(20) The Relationship Among T-REITs, Macroeconomy and Commercial Real Estate Market. (1992), Liang and Webb (1995), and Peterson and Hsieh (1997) believe that REITs are sensitive to interest rate changes, so a multi-factor model would be better than a single-factor model. The results of how interest rate affects REITs are divided into two conclusions. The first part thinks that REITs are highly sensitive to interest rate changes (Allen, Madura and Springer, 2000; Chen and Tzang, 1988). The second part believes that the correlation between REITs returns and interest rate changes is relatively low (Park et al., 1990;Mueller and Pauley, 1995;Li and Wang, 1995). However, those researches were not done under the same time frame, so interest rate volatility and the characteristics of REITs are not the same; thus, the relationship between REITs and interest rates still has room to be explored. Allen, Madura and Springer (2000) find strong evidence to suggest that REITs. 政 治 大. returns are sensitive to long-term and short-term interest rate changes, but they cannot conclude that REITs can affect their exposure to interest rate changes through asset. 立. structure, financial leverage, management strategy, or degree of specialization. The. ‧ 國. 學. results also show that REITs returns are more sensitive to stock market conditions than to interest rate changes, and there is evidence that individual REITs. ‧. characteristics would affect REITs riskiness. Chen and Tzang (1988) point that during 1973-1979, both equity and mortgage REITs were sensitive to changes in the. sit. y. Nat. long-term interest rates and changes in expected inflation, and for the period 1980-1985, both equity and mortgage REITs were sensitive to short-term and. io. n. al. er. long-term interest rate changes. Swanson, Theis and Casey (2002) indicate that. i Un. v. although the particular time frame according to daily market data are unevenly. Ch. engchi. dependent, interest rates still impact REITs. And it appears that the interest rate effects seem to have less explanations than in the time period as a whole, which is consistent with previous short versus long window analyses. Mueller and Pauley (1995) indicate that REITs price movements have a low correlation with interest rates changes and a lower correlation with interest rates than with movements in the stock markets as a whole. The results of correlation and regression also show that the spontaneous relationship between interest rates changes and REIT price changes is very weak. In addition, the NAREIT Equity Index had a low negative correlation with interest rate movements during the period under study. Although the correlation between REITs and interest rates were divided into two parts, we can ascertain that REITs and interest rates changes are still correlated. 12.
(21) The Relationship Among T-REITs, Macroeconomy and Commercial Real Estate Market. However, the results may show different degrees of relevance subject to the length of time frame and data sources selected. This study tries to find out whether there is a long-run relationship between REITs and interest rates, or interest rates changes only has a short-term impact on REITs. 2.2.2 REITs and Real Estate Markets There are also many studies exploring the relationship between REITs and real estate markets. Myer and Webb (1993) analyze the causality between REITs and real estate markets, and show the REIT index is found to Granger-cause the real estate indices, but there is no evidence that the real estate indices Granger-cause the REITs indices. In a time series sense, equity REITs returns appear to be much more like the returns on common stocks and closed-end fund. In addition, REITs returns are much. 政 治 大. more strongly related to unsecuritized real estate returns than are the returns on stocks or closed-end funds.. 立. ‧ 國. 學. Clayton and Mackinnon (2003) find that after 1980, the large-cap stock factors impact on REITs drop dramatically, and the small-cap stock factors impact also. ‧. occured. Since 1992, the dramatic growth and maturation of the REITs led to claims that the link between REITs prices and real estate market fundamentals become much. sit. y. Nat. stronger. Damodaran and Liu (1993) find the second-hand information associated with real estate appraisal announcements does not influence REITs prices. Following the. io. n. al. er. research by Damodaran and Liu, Downs, Guner, Hartzell and Torres (2001) show that. i Un. v. REITs prices change is a result of the information content in Barron’s “The Ground. Ch. engchi. Floor” column, and that the prices change more in the period following the REITs boom than during an earlier period.. Liang, Chatrath and McIntosh (1996) set up a hedged apartment REITs index by removing the return components of stocks in general and non-apartment equity REITs that invest in apartment real estate, and they use the index to analyze the relation between apartment REITs and apartment real estate. The results indicate that the “double-hedged” apartment REITs index satisfactorily track the performance of appraisal-based apartment real estate. Therefore, the hedged apartment REITs index can be used as a proxy for apartment real estate when making mixed-asset portfolio decisions. Ling and Naranjo (1997) use a standard multifactor asset pricing model to 13.
(22) The Relationship Among T-REITs, Macroeconomy and Commercial Real Estate Market. examine the macroeconomic factors that will affect real estate returns. This study identifies the growth rate in real per capita consumption, the real T-bill rate, the term structure of interest rates, and unexpected inflation as fundamental drivers or “state variables” that systematically affect real estate returns. The results show that previous findings of significant abnormal returns that have ignored consumption are potentially biased by omitting variables problem, and the dynamic asset allocation strategies involve the predictability of real estate returns using economic data. Myer and Webb (1994) find there is a positive contemporaneous relationship between retail stocks and retail REITs even after controlling the market returns, and support the hypothesis that the presence of overage rents would tend to link the performance of retail real estate with the performance of retail tenants. Lee, Lee and. 政 治 大. Chiang (2008) find evidence suggesting that the real estate factor plays an important role in explaining quarterly equity REIT returns, which is consistent with the result. 立. explored by Giliberto (1990) that REITs returns reflect the performance of underlying. ‧ 國. 學. real estate. Moreover, the sensitivity of big-cap REIT returns to lag supports the notion that institutional investors view REITs as potential substitutes for direct real. ‧. estate investments and switch their capital between public and private real estate markets. Interestingly, when a more sophisticated investor based on the new REITs. sit. y. Nat. era improves information flow, a high degree of participation from institutional. io. al. n. returns.. er. investors strengthens the linkage between REITs returns and private real estate. Ch. i Un. v. Quan and Titman (1999) find a significant positive relation between stock returns. engchi. and changes in commercial real estate values in contrast to earlier studies. One hypothesis is that real estate and stock prices are both driven up and down by changing expectations of future economic growth which is independent of current fundamentals, such as current rents and GDP. Moreover, they find that rental rates are strongly correlated with GDP growth rates as well as stock returns. The insignificance of the inflation rate coefficient and interest rate variables suggest that commercial real estate is a good long-term hedge against realized inflation, and that changes in anticipated inflation do not have long-term effects on commercial real estate values. Regardless of using price index or rent as the object, real estate activities do have some influence on REITs volatility and returns, and sometimes REITs can act as a proxy of real estate markets, especially of commercial real estate markets. Therefore, 14.
(23) The Relationship Among T-REITs, Macroeconomy and Commercial Real Estate Market. there is a correlation between the performance of real estate markets and REITs volatility and returns.. 立. 政 治 大. ‧. ‧ 國. 學. n. er. io. sit. y. Nat. al. Ch. engchi. 15. i Un. v.
(24) The Relationship Among T-REITs, Macroeconomy and Commercial Real Estate Market. 2.3 Long-run Relationship Between REITs and Factors This study applies cointegration method in exploring the long-run equilibrium relationship between REITs and other factors. Variables with cointegration relation are adjusted by a vector error correction term, and variables without cointegration relation are interpreted based on VAR approach. Finally, all the variables will do the causality test. This section reviews the researches about cointegration and VAR models. 2.3.1 Cointegration Other than using linear regression model to analyze the relation between REITs and other markets, many researches shift to using cointegration to discuss the long-run equilibrium relationship between REITs and other factors in recent years. This. 政 治 大 relationship by using a two-step 立 approach between the two variables. Later, Johansen concept was proposed by Engle and Granger (1987), where they explore the long-run. ‧ 國. 學. (1991) proposed the maximum likelihood method for verification of cointegration relationship between multi-variables.. ‧. Nasseh and Strauss (2000) indicate that the Johansen framework is a useful setting for analyzing stock market and macroeconomic activity because it incorporates. Nat. sit. y. dynamic co-movements or simultaneous interactions. Through this method we can. er. io. study the channels through macroeconomic variables affect asset prices as well as their relative importance. They find a strong, integrating relationship between stock. n. al. Ch. i Un. v. prices and domestic and international macroeconomic variables in Europe, and the. engchi. long-term interest rates are shown to negatively influence stock prices; whereas, short-term interest rates are shown to be positively related to stock prices. In addition, stock prices are grounded in economic fundamentals, influenced by production, interest rates, business expectations and the CPI, and the domestic and international macroeconomic activity and cointegration methodology can be an important tool in explaining stock returns. McCue and Kling (1994), Okunev and Wilson (1997) also state that cointegration model is commonly used in the analysis of correlation between real estate market and stock market, focusing on the long-term effects of the economic variables. Liu, Hartzell, Greig and Grissom (1990), exploring the relationship between real estate market and the stock market, pointed out that the commercial real estate market 16.
(25) The Relationship Among T-REITs, Macroeconomy and Commercial Real Estate Market. is segmented from the stock market as a result of indirect constraints. However, the equity REITs are integrated with the stock market even though the commercial real estate that underlies the equity REITs is segmented from the stock market, and indirect barriers such as the cost, amount, and quality of information are the major source of segmentation. The commercial real estate market appears to be cointegrated with the stock market when the tests of cointegration are performed. Li and Wang (1995) apply the method of two-factor asset pricing model and risk premium. The result lead to a similar conclusion without assuming the existence of a real estate factor premium in the economy, providing further evidence that REIT stocks are integrated with the general stock market. Ling. and. Naranjo. (1999). support. the. hypothesis. that. markets. for. 政 治 大. exchange-traded real estate companies, like REITs, are integrated with the market for exchange-traded (non-real-estate) stocks, and the level of integration significantly. 立. increase after 1990s. However, if the evaluated price is replaced by the actual market. ‧ 國. 學. price, it will have an opposite result from the perspective of real estate portfolio, which means the real estate market and stock market will not be integrated. The returns.. ‧. hypothesis is that the estimated returns can’t accurately represent the actual portfolio. y. Nat. sit. Quan and Timan (1999) study the global relation between stock markets and real. al. er. io. estate markets in 17 countries. The results show that apart from Japan, the stock. n. markets and real estate markets are not cointegrated in other countries. However, the. Ch. i Un. v. stock returns, real estate price changes and rentals would have a significant. engchi. relationship if all the national data are added up and examined under a longer period. In the long-run, stock returns and real estate returns are still correlated. Chaudhry, Myer and Webb (1999) further use Johansen test and the results suggest that the stocks tend to have an inverse long-run relationship with the real estate. Johnl, Lu and So (2000) believe that if REITs act more like real estate, there would be a cointegration between inflation and REITs, but they find that before 1992, REITs acted more like fixed-income instruments. The results show that REITs are cointegrated with the bond market before 1992 and that this cointegration relationship vanished afterwards. From 1992 to 1996, the cointegration are found between stocks and REITs, and after 1992, stocks and REITs share some common factors, and asset pricing structures and REITs behave more like stocks. Clayton and Mackinnon (2003) 17.
(26) The Relationship Among T-REITs, Macroeconomy and Commercial Real Estate Market. also find that the dramatic growth and maturation of the REIT sector since 1992 led to claims that the link between REIT prices and real estate market fundamentals had become much stronger as their returns become less dependent on major stock indices and more akin to real estate and sector effects, making REITs more like real estate and less like stock. Westerheide (2006) states that real estate stocks provide a (weak) hedge against consumer price inflation in almost every country, and cointegration is indicated in the Johansen specification as well. This implies that an equilibrium relationship exists, but the general stock market adjusts to the real estate stock market instead of the reverse. In the study of the U.S., Australia and Japan, there is weak evidence for a long-run equilibrium between real estate stock indicators and the CPI, indicating that. 政 治 大. real estate stocks could basically serve as an inflation hedge. Adrangi, Chatrath and Raffiee (2004) support the hypothesis the market for REITs and equities is integrated. 立. and the real REIT returns are negatively correlated with the inflation rate, and the. ‧ 國. 學. result is robust for the long-term.. The cointegration literatures discussed above are under a linear assumption.. ‧. However, Okunev and Wilson (1997) suggest that using a standard cointegration tests. y. Nat. β to produce conclusive evidence could be a failure because the relationship between. sit. real estate and financial assets markets may be nonlinear rather than linear. The results. al. er. io. suggest that the real estate markets are nonlinearly related to the stock market, so. n. there is a relationship between the stock and real estate markets but the link is weak. Ch. i Un. v. and nonlinear, and the movement of the real estate market towards the stock market is. engchi. slow. In 1999, the authors further use non-linear method to explore the long-run equilibrium relationship between the real estate market and stock market of the United States, Britain and Australia. The results show that the real estate market and the stock market do not have a significant long-run equilibrium relationship in the U.S. and the U.K., and the result in Australia is not significant. However, if the cutoff point is in 1987, the real estate market in U.S. and the U.K. will be cointegrated. There are also some domestic researches for cointegration between different markets. Zheng (2008) illustrates that cointegration test is often interpreted as “The economic variables have a long-run equilibrium relationship.” If the linear combination between variables has a cointegration relationship, even a short period of imbalance with a deviation from equilibrium occurred, but the error correction 18.
(27) The Relationship Among T-REITs, Macroeconomy and Commercial Real Estate Market. function will gradually reduce this deviation and eventually adjust to the long-run equilibrium level. If cointegration exists between variables, then the error correction term must be added to fix the short-run non-equilibrium and to explain the short-run changes of the series in inter-relations. Zheng and Chang (2007) point out that the T-REITs index and stock price index are not cointegrated, neither is T-REITs and construction index, suggesting that the investors can achieve risk diversification and gain profits by joining T-REITs in portfolio investment. In addition, the T-REITs have low correlation coefficient with stock price index and construction index. In this case, investors can effectively reduce the investment risk if T-REITs are included in the portfolio. Wang (2007) shows that industrial/office, special use, retail and warehousing,. 政 治 大 housing-based REITs, however, have the characteristics against increasing price, they 立 are more able to offset the decline in purchasing power when prices rise. In addition, and personal use of REITs do not have the characteristics against increasing price. The. ‧ 國. 學. using unemployment as a macroeconomic indicator, the study found that unemployment only has negative effects on industrial/office-based REITs.. ‧. Nie and Zheng (2000) use general linear analysis and non-linear concept. sit. y. Nat. proposed by Okunev and Wilson to explore the relationship between housing price index and stock price index in Taipei City, Taipei County, Kaohsiung City, Taichung. io. n. al. er. and Taiwan from March 1991 to April 1999. The results show that the long-term. i Un. v. equilibrium relationship does not exist between housing price and stock price except. Ch. engchi. in Kaohsiung City. In addition, the study found that during the study period, the interaction between Taiwan housing price and stock prices are mostly negative, which is contrary to other studies. Overview of domestic and foreign cointegration literatures and researches of REITs, in foreign researches, the macroeconomic variables such as stock price, interest rate and inflation rate are cointegrated with REITs, thus they have long-term equilibrium relationship. However, the researches in Taiwan find that T-REITs are not cointegrated with stock price index. The foreign discussions about the ability of REITs against inflation do not reach any unanimous conclusion, but some studies suggest that it should not be a portfolio with similar nature products like stocks. In Taiwan, the studies suggest that although T-REITs is not an inflation hedge, they can 19.
(28) The Relationship Among T-REITs, Macroeconomy and Commercial Real Estate Market. serve as an effective tool for risk diversification because of its low stock price index-related. 2.3.2 Vector Autoregression VAR model can be used to explore the effects and direction of short-term changes among REITs and other variables, and to understand the degree of influence of lag periods. Lee (1992) uses the VAR approach to explore the causal relations among stock returns, interest rate, real activity, and inflation. The results show that the stock returns appear prior to Granger-Cause and help explain a substantial fraction of the variance in real activity, and it responds positively to shocks in stock returns. When adding interest rate in VAR model, the interpretation ability of stock returns on inflation is reduced, but the interest rate is with most of the explanatory power of. 政 治 大 returns when testing with real interest rates. Finally, the inflation explains little 立 variation in real activity.. inflation instead. In addition, the inflation rate has a negative relationship with stock. ‧ 國. 學. Ling and Naranjo (2003) apply VAR approach to examine the interrelationships. ‧. between short- and long-run dynamics among capital flows to the REIT sector and REIT returns, particularly whether REIT capital flows affect REIT prices and returns. sit. y. Nat. and whether the effect is temporary or permanent. They also use impulse response functions to provide the time path of the short-run dynamic relationships that result. io. n. al. er. from a shock to the variables in the system. The result suggests there is positive. i Un. v. momentum in REIT flows, but this momentum reverses after two quarters. It also. Ch. engchi. indicates that current flows are highly significant in explaining current returns. Ling and Naranjo (2006) further use VAR to examine the effects of weekly and monthly capital flows into the dedicated REIT mutual fund sector on aggregate REIT returns. They find consistent evidence that REIT mutual fund flows are significantly and positively related to prior industry-level returns, but prior fund flows do not significantly influence subsequent REIT returns. In addition, contemporaneous fund flows do have an initial positive effect on returns, which is partially reversed one period later. Interestingly, the unexpected REITs mutual fund flows have positive contemporaneous effects and the expected portion is insignificant. Bredin, O’Reilly and Stevenson (2007) apply VAR model to analyze the relationship between REITs and interest rate. They conclude that in comparison to 20.
(29) The Relationship Among T-REITs, Macroeconomy and Commercial Real Estate Market. previous studies of REIT interest rate sensitivity, this study find significant responses in both returns and volatility to unanticipated rate changes. However, the effect of the shock is significant on both returns and volatility and there is no evidence of asymmetry between them. Glascoca, Lu and So (2002) use VAR to explore the relationship between REITs returns, real activity, monetary policies, and inflation. The evidence suggest that neither expected nor unexpected inflation signal REIT returns, but the finding is consistent with previous findings that REIT returns are sensitive to interest rate changes. In addition, they conclude that REITs returns do not behave as perverse inflation hedges. To sum up the above studies, foreign researches about the relationship between. 政 治 大 the long-run and short-run impacts. However, the relative empirical studies in Taiwan 立 are still less prominent. Although there are some studies using cointegration model to REITs and other markets are more extensive, and apply different models to explore. ‧ 國. 學. discuss the long-run relationship between T-REITs and other variables, most of them focus on relationship between T-REITs and stocks or T-REITs and construction index.. ‧. There are other economic variables that can still be discussed as regards T-REITs, and. n. al. er. io. sit. y. Nat. that is the research gap this study would like to explore.. Ch. engchi. 21. i Un. v.
(30) The Relationship Among T-REITs, Macroeconomy and Commercial Real Estate Market. Chapter 3 Research Method and Data Information This chapter is divided into research method, variable selection and T-REITs index presentation. The first part shows the models applied in this study for empirical tests. The second part shows the approaches of variable selection and clarifies the data source. The last part is establishing T-REITs index for the use of empirical study since there is no official REITs index in Taiwan.. 3.1 Research Method The purpose of this study is to explore the long-run and short-run relationship between T-REITs, macroeconomy and commercial real estate market. In the long-run. 政 治 大. equilibrium section, we employ Johansen cointegration method to analyze T-REITs and other variables, respectively. Variables with cointegration relationship are. 立. analyzed through VECM approach for further study; and variables without. ‧ 國. 學. cointegration relation are interpreted based on the VAR approach, discussing the short-term influence of each variable to T-REITs. Finally, we conduct Granger. ‧. causality test to explore the lead/lag relation between variables.. sit. y. Nat. 3.1.1 Cointegratoin Test. Cointegration test was proposed by Engle and Granger in 1987, which is. io. n. al. er. specifically for the analysis of the relationship between a set of economic variables.. i Un. v. When a set of non-stationary variables become stationary through a linear. Ch. engchi. combination, the non-stationary time series are said to be cointegrated. Cointegration is commonly used to explain the long-run equilibrium relationship between economic variables. When there is a cointegration relationship between variables, the characteristics of these variables tend to adjusted to the balanced direction, and the effects from the external factors are only a short-term deviation from equilibrium. Therefore, the error correction function must be applied to decrease the deviation gradually, so that the variables will eventually return to the long-run equilibrium value. The short-run relation between variables is described in the VECM approach. Engle and Granger (1987) propose a two-step method approach to test the cointegration relation. The hypothesis is that when two non-stationary variables Y and X. become stationary in a first-order differential, the Engle-Granger 22.
(31) The Relationship Among T-REITs, Macroeconomy and Commercial Real Estate Market. cointegration test can be applied. The first step of regression can be written as follow. Y. α. βX. ε. (3.1). In this equation, Y represents the dependent variable; X independent variable and ε. represents the. is the error term. The second-step of Engle-Granger. cointegration is to decide the integrated order of residuals using unit-root test. The regression residuals can be expressed as: ∆ε. ρε. ε. (3.2). The null hypothesis of the equation is that there is no cointegration relationship between the two variables. If the result can’t reject the null hypothesis of ρ. 0, then. the residual series has a unit-root, implying there is no cointegration between series. 政 治 大. Y and X .. 立. However, the Engle-Granger two-step method can’t point out one or more of the. ‧ 國. 學. cointegration relationship and the relative dynamics of the adjustment process over two variables, thus Johansen (1991) proposes a new method based on VAR approach.. ‧. This method uses maximum likelihood estimation to clearly point out the existence of one or more cointegration relationship provides a more robust interpretation of the. y. Nat. multiple long-run equilibrium relationship between variables. The variables generate a. io. sit. long-run impact matrix after differential, and use the two likelihood ratio statistics to. n. al. er. confirm the rank of matrix, which determines the number of cointegration vector.. i Un. v. Assuming a VAR model of order p and n variables can be expressed as: Y. Ch. A Y. e n g c h iA. A Y. Y. BX. ε. (3.3). where Y is a k-vector of non-stationary I(1) variables; X. is a d-vector of. deterministic variables; ε is a vector of innovations generated by the equation. Let Π. ∑. A. I ,Γ ∆Y. ∑. ∏Y. A , the equation (3.3) can be rewritten as: ∏ Y. ∏ Y. ∏. ∆Y. (3.4). And equation (3.4) can further be expressed as:. ∆Y. ∏Y. Γ. 23. Y. BX. (3.5).
(32) The Relationship Among T-REITs, Macroeconomy and Commercial Real Estate Market. where ∏ is the long run impact matrix, and the rank of ∏ decides the number of cointegration existed in Y . The Johansen test is to examine whether the rank generated by ∏ can be rejected through the estimation of non-restricted VAR model to the Π matrix. In order to carry out tests of the rank to determine the number of cointegration, Johansen proposed Trace test and Maximum Eigenvalue test. λ. r. T. ln 1. λ. (3.6). where T = number of sample size, λ = max-Eigen statistic of matrix ∏. The null hypothesis is H :rank≦r. r. λ. Tln 1. λ. (3.7). 政 治 大. The null hypothesis is H :rank=r, representing number of r cointegration vectors.. 立. The alternative hypothesis is H :rank=r+1, representing number of r+1 cointegration. ‧ 國. 學. vectors existing between variables. 3.1.2 Vector Error Correction Model. ‧. According to Granger’s representation theorem, when cointegration exists. sit. y. Nat. between two variables, an error correction term must be added to correct the short-term imbalance between variables, making the time series back to long-run. io. n. al. er. equilibrium. The VECM approach restricts the long-run behavior of the endogenous. i Un. v. variables to converge to their cointegrated relationships while allowing for short-run. Ch. engchi. adjustment dynamics. In addition, since the traditional time-series model complies with the requirements of stationary, the non-stationary series have to be differentiated before analyzing. But the difference will result in the loss of long-term information. The adoption of error correction model can also save the problem. Error correction model is derived from the VAR approach, it specifies the correction term should be added into VAR when cointegration exists, making the variables move toward the direction of long-run equilibrium. Therefore, the movement of series is not only affected by the changes of current variables and itself, but also affected by the previous imbalance. Under the assumption of one cointegration and no lags, the cointegration model between series. Y and. corresponding to the VECM can be expressed as: 24. X. is Y. βX , and the two.
(33) The Relationship Among T-REITs, Macroeconomy and Commercial Real Estate Market. ∆X. α Y. βX. ε. ,. (3.8a). ∆Y. α Y. βX. ε. ,. (3.8b). Only the right variables are the error correction terms generated by integrating, and α is the speed of adjustment. From (3.8a) and (3.8b), and in the case of long-run equilibrium, the value of the error correction term should be 0, and the error correction term will not be 0 when Y and X deviate from the equilibrium. Generally, the error correction model corrects the short-term imbalances through the error correction term, implying that when imbalance occurred in the previous period, it will be partially corrected at current period. Therefore, the error correction term may be regarded as the speed of. 政 治 大 error correction model contains a variable differential, error correction term, and the 立 short-term changes between variables under long-run equilibrium relationship, which adjustment between variables and the long-run equilibrium value. In addition, the. ‧ 國. 學. avoids the spurious regression error and the long-run messages that can be ignored by differential.. ‧. 3.1.3 Vector Autoregression Model. y. Nat. sit. The groups of variables without cointegration relationship apply the VAR. al. er. io. approach. The VAR is commonly used for forecasting systems of interrelated time. n. series and for analyzing the dynamic impact of random disturbances on the system of. Ch. i Un. v. variables. The VAR model uses its own information and characteristics to do the. engchi. analysis. In each equation, the dependent variable begins with the lags of their own period and together with the lags of other variables. In each regression, the interpreted variable uses its own lags as the explanatory variable, viewed as endogenous variable, to reflect the dynamic relationships between variables. Because the VAR model can indicate the lags’ short-term impact on the dependent variable by studying the correlation between the lags of the dependent variable and the lags of other variables. In this study, the VAR model is to explore the short-term impact changes under the long-run fluctuations. On the assumption that Y is influenced by the lag of itself and other variables and all the series are stationary, it includes the following two regressions:. 25.
(34) The Relationship Among T-REITs, Macroeconomy and Commercial Real Estate Market P. Y. α. P. α. Y. P. X. α. α. X. ε. (3.9a). α. Y. ε. (3.9b). P. α. X. where Y is the value of the dependent variable at time t, and X is the value of the independent variable at time t. 3.1.4 Granger Causality Test Besides using cointegration and VAR to explore the relationship between. 治 政 大 two variables A and B is between T-REITs and other variables. The causality between 立 defined as whether placing the lag of A into the prediction equation of B would variables, this study also uses Granger causality test to explore the lead/lag relations. ‧ 國. 學. provide better forecasting results than only place the lag of A into the equation. This means that when there are two series Y and X , the inclusion of the lag Y items. ‧. would enhance the prediction accuracy of X , and will also enhance the overall explanatory power of X . At this point, we say Y leads X , and X leads Y vice. Nat. sit. y. versa. The significance of the test results is that one variable contributes to the. er. io. forecast of another variable, and provides leading information. If there exists an interaction between the two variables, then the result indicates the feedback. n. al. Ch. i Un. v. relationship between variables. Suppose two variables are stationary, but does not. engchi. have a cointegration relationship, the Granger causality equation is defined as: ∆Y. α. α ∆X. β ∆Y. ε. (3.10). where Y is dependent variable; X is independent variable, and P is lag terms. The null hypothesis is H :α. α. α. 0 . If the results reject the null. hypotheses, meaning it refuses that X does not lead Y, then the results indicating that adding X in the equation is useful in predicting Y. If there is cointegration between the two variables, there would be bias by using equation (3.10) directly. In order to avoid the bias, the variables deviate from the 26.
(35) The Relationship Among T-REITs, Macroeconomy and Commercial Real Estate Market. long-run equilibrium level needs to be taking into consideration. Therefore, we should use VECM to do the estimation by adding error correction term λ. into the. above VAR model, becoming equation (3.11). α. α ∆X. 立. β ∆Y. λ. ε. 政 治 大. 學 ‧. ‧ 國 io. sit. y. Nat. n. al. er. ∆Y. Ch. engchi. 27. i Un. v. (3.11).
(36) The Relationship Among T-REITs, Macroeconomy and Commercial Real Estate Market. 3.2 Variable selection and data source In this section, we illustrate the reasons for selecting the macroeconomic and commercial real estate market variables and the sources. 3.2.1 Macroeconomic Variables Selection According to Giliberto (1990), there is a correlation between REITs and real estate market. Because the essence of REITs is similar to the stock market, the stock prices can be an appropriate variable to analyze. Liu and Mei (1992), Liang and Webb (1995), and Peterson and Hsieh (1997) indicate REITs are highly sensitive to interest rate, therefore could be used as a way to investigate the correlation between the two variables. However, Mueller and Pauley (1995), Li and Wang (1995) claim the. 政 治 大 REITs capability of hedge立 is also under discussion. Larsen and Mcqueen (1995). correlation between REITs returns and interest rate changes is relatively low. The. ‧ 國. 學. confirm that REITs can significantly hedge against inflation. However, Yobaccio, Rubens and Ketcham (1995) argue that REITs are only act as a poor hedge tools against inflation. Although the conclusions regarding whether REITs are sensitive to. ‧. interest rate or whether REITs can hedge against inflation are not consistent, interest. y. Nat. rate and inflation is still important economic indicators. This study thus intends to. sit. explore their relationship with T-REITs. In sum, the macroeconomic variables. al. n. rate.. er. io. discussed with T-REITs in this study are stock price index, inflation rate and interest. Ch. engchi. 3.2.2 Real Estate Market Variables Selection. i Un. v. In addition to macroeconomic variables, the real estate market is also an important factor affecting REITs. Myer and Webb (1993) find that the impact of real estate index to REITs is more significant than the impact of stocks or funds, and the rents tend to affect REITs returns. Therefore, this study adopts the physical real estate prices and rents as the real estate market variables. Since most of the compositions of current T-REITs are commercial office buildings, we thus focus on the relationship between T-REITs and commercial real estate markets, and select commercial real estate prices and rents as variables. 3.2.3 Sources of variables 28.
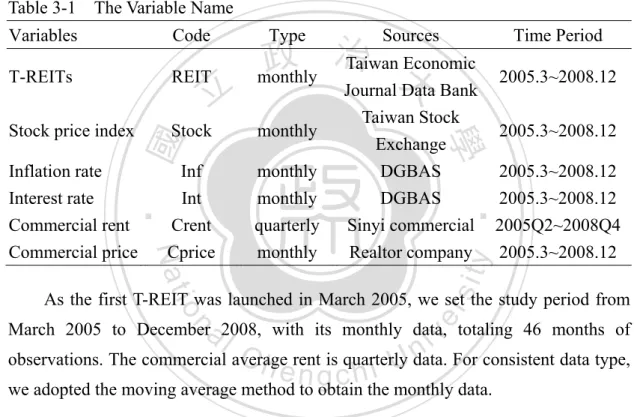
(37) The Relationship Among T-REITs, Macroeconomy and Commercial Real Estate Market. Variables been explored in this study includes T-REITs price index, stock price index, inflation rate, interest rate, commercial real estate price and rent. The macroeconomic variables collected for analysis are the weighted average stock price index from the Taiwan Stock Exchange, the average interest rate reported by Directorate-General of Budget, Accounting and Statistics (DGBAS), and the inflation rate comes from the annual growth of consumer price index (CPI) as an alternative indicator by DGBAS. The commercial real estate market variables are commercial real estate transaction price provided by a prestigious realtor company and the average commercial office rent from Sinyi Commercial. Table 3-1 shows the brief description of these variables name and data information in this study. Table 3-1 The Variable Name Variables. Code. T-REITs. REIT. Stock price index. Stock. monthly. Inflation rate Interest rate Commercial rent Commercial price. Inf Int Crent Cprice. monthly monthly quarterly monthly. Sources. 治 政 Taiwan Economic monthly 大 Journal Data Bank. Time Period 2005.3~2008.12 2005.3~2008.12 2005.3~2008.12 2005.3~2008.12 2005Q2~2008Q4 2005.3~2008.12. sit. y. ‧. Nat. Taiwan Stock Exchange DGBAS DGBAS Sinyi commercial Realtor company. 學. ‧ 國. 立. Type. er. io. As the first T-REIT was launched in March 2005, we set the study period from. al. iv n C observations. The commercial average is quarterly h erent i U data. For consistent data type, h n c g we adopted the moving average method to obtain the monthly data. n. March 2005 to December 2008, with its monthly data, totaling 46 months of. 29.
(38) The Relationship Among T-REITs, Macroeconomy and Commercial Real Estate Market. 3.3 T-REITs Index presentation and data analysis Most of the researchers use exponential pattern while studying REITs, however, T-REITs index has not yet been officially established in Taiwan. In order to better understand the overall performance of T-REITs and to support the follow-up researches, the T-REITs index should be established. This section reviews the REITs index of United States and Japan, and applies the establishment method proposed by Zheng and Chang (2007) to generate a longer T-REITs index. Further, we intend to outline the basic information on T-REITs and illustrate the past performance and trend of T-REITs. 3.3.1 U.S. REITs Index. 政 治 大 Investment Trust (NAREIT) 立is on December 31, 1971, and the base value is set to be. The base period of REITs index sets up by National Association of Real Estate. ‧ 國. 學. 100. The NAREIT includes all the REITs from New York Stock Exchange (NYSE), the NASDAQ Stock Market and American Stock Exchange (AMEX). In addition to a composite REITs index, NAREIT also provides index of equity REITs, mortgage. ‧. REITs and hybrid REITs. The methodology is as:. ∑. n. al. , ,. Ch where n=the number of companies; of the previous day; ,. ,. , ,. er. io. ,. sit. y. Nat ∑. i Un. v. i current day; e=nprice g c ofh the. ,. ( .. ). ( .. ). =stock price. = stock numbers of the previous day; ∑. ,. = total market value.. 3.3.2 Japan’s REITs Index There are two prestigious REITs index in Japan, one is the STBRI J-REITs index established by Sumitomo Trust & Banking Co., which is the same method as the U.S.. The other one is the Topix REITs established by Tokyo Stock Exchange, the same one that established TOPIX, which is from March 31, 2003 and set a value of 1000. The methodology is as:. 30.
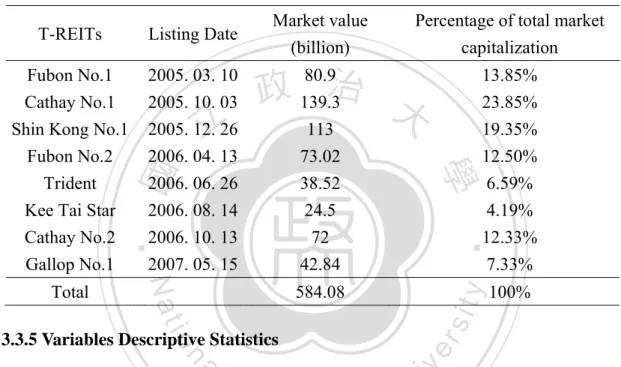
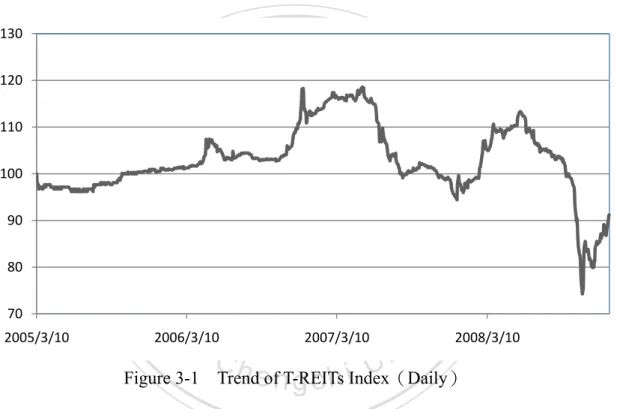
(39) The Relationship Among T-REITs, Macroeconomy and Commercial Real Estate Market. ∑. ,. ,. ∑. ,. ,. where n=the number of companies; numbers of the current day;. ,. ,. ( . = price of the current day;. =stock price of the base period;. ,. ,. ). = stock. = stock numbers. of the base period. 3.3.3 Establish T-REITs index This study is based on the establishment of T-REITs index method proposed by Zheng and Chang (2007), using Japan's Topix REITs index mode. The T-REITs index contents all the REITs listed on OTC (Over-the-counter) since the launched date, including Fubon No.1, Cathay No.1, Shin Kong No.1, Fubon No.2, Trident, Kee Tai. 政 治 大 establishing 立 T-REITs index by. Star, Cathay No.2 and Gallop No.1. The method of. Zheng and Chang is a. circulation-weighted price index, using each REITs’ number of shares as weighted. ‧ 國. 學. values. REITs index for the day of the date is the total issue value divided by the base value, and the base value is market value of total issued during base period. Total. ‧. market value is the sum of the daily market price (closing price in this study). y. Nat. multiplied by the number of shares issued. In this study, the launched date of Fubon. er. io. is:. sit. No.1, March 10, 2005, is the base period, and the base value is 100. The methodology. n. a∑l. , ni C h, U ,e n , gchi. ∑. where n=the number of companies; numbers of the current day;. ,. ,. v. ( .. = price of the current day;. =stock price of the base period;. ,. ,. ). = stock. = stock numbers. of the base period. Because this study uses monthly data as research units, we will first establish the daily T-REITs index then calculate the average of each month's index as the study used data on T-REITs. 3.3.4 Basic Information of T-REITs Taiwan has a total of eight REITs listing. Since the time of this study ranges from March 2005 to December 2008, all the eight REITs are the subjects under study. The basic information of all T-REITs are shown in Table 3-2, the basic information of 31.
數據
+7
相關文件
For the next nitrogen delivery system, In this study, the high-tech industry, nitrogen supply, for example, to explore in depth the relationship between
Therefore, in order to effectively utilize and manage the coastal lands in Tao-Zhu-Miao region, this study will intensively explore the current situation of land use and
This study aims to explore whether the service quality and customer satisfaction have a positive impact on the organizational performance of the services and whether the
Based on a sample of 98 sixth-grade students from a primary school in Changhua County, this study applies the K-means cluster analysis to explore the index factors of the
The purpose of this paper is to use data mining method in semiconductor production to explore the relation of engineering data and wafer accept test.. In this paper, we use two
The purposes of this research are to find the factors of affecting organizational climate and work stress, to study whether the gender, age, identity, and
In this study, Technology Acceptance Model (TAM 2) is employed to explore the relationships among the constructs of the model and website usage behaviors to investigate
This study evaluates the service quality gap of leisure farms through the consumers' ideas, and applies Kano’s two-dimensional quality analysis to not only explore service
