行政院國家科學委員會專題研究計畫 成果報告
數值地形模型與 GIS 於集水區水文模式上之應用(2/2)
計畫類別: 個別型計畫 計畫編號: NSC91-2313-B-004-001- 執行期間: 91 年 08 月 01 日至 92 年 07 月 31 日 執行單位: 國立政治大學地政學系 計畫主持人: 詹進發 計畫參與人員: 廖健智、郭芳誠、林瑋棠 報告類型: 完整報告 處理方式: 本計畫可公開查詢中 華 民 國 92 年 11 月 3 日
行政院國家科學委員會補助專題研究計畫
■ 成 果 報 告 □期中進度報告數值地形模型與 GIS 於集水區水文模式上之應用(2/2)
計畫類別:■ 個別型計畫 □ 整合型計畫
計畫編號:NSC
91-2313-B-004-001-
執行期間:
91 年 8 月 1 日至 92 年 7 月 31 日
計畫主持人:
詹進發
共同主持人:
計畫參與人員:
廖健智、郭芳誠、林瑋棠(國立政治大學地政學系)
成果報告類型(依經費核定清單規定繳交):□精簡報告 ■完整報告
本成果報告包括以下應繳交之附件:
□赴國外出差或研習心得報告一份
□赴大陸地區出差或研習心得報告一份
■出席國際學術會議心得報告及發表之論文各一份
□國際合作研究計畫國外研究報告書一份
處理方式:除產學合作研究計畫、提升產業技術及人才培育研究計畫、
列管計畫及下列情形者外,得立即公開查詢
□涉及專利或其他智慧財產權,□一年□二年後可公開查詢
執行單位:
國立政治大學地政學系
中 華 民 國 92 年 10 月 31 日
I
中文摘要
對於集水區地文特性之瞭解,為研究集水區水文特性不可或缺之程序。利用數值地形 模型,配合地理資訊系統之空間分析功能,可以迅速獲取集水區面積、河川網路、河川級 序、河川長度等地文參數,近年來已被廣泛應用於集水區水文研究上。然而,其他有關流 域之地文因子如:排水密度、平均高程、中值高程、圓比值等,以及河川分岔比、河川長 度比、河川面積比、河川頻率等有關河川網路特性之參數,則仍需以人工方式檢視圖形與 屬性資料方能求得,因此需耗費相當之時間,頗不利於水文研究。本研究之目的為利用數 值地形模型,以 ArcInfo 地理資訊系統軟體發展一能自動分析集水區地文參數之軟體,期能 迅速、有效的獲取集水區水文模擬分析所需之參數。由分析濁口溪集水區數值地形模型之 結果顯示,利用地理資訊系統自動粹取集水區地文參數確實為可行之方法,獲得之河川支 數、河川長度、集水區面積等地文參數,均與 Horton 地形法則極為吻合,其相關判定係數 (R2)介於 0.96 與 0.99 之間。此外,本研究以河川網路自動分析集水區出水口,並可依據河 川級序劃分多尺度之集水區單元,頗符合不同尺度集水區水文分析之需求。Abstract
Full understanding of the physiographic characteristics of a watershed is essential for studying the watershed hydrologic characteristics. Using digital terrain model and geographic information system, one can rapidly obtain some physiographic parameters such as watersheds areas, stream networks, stream orders, and stream lengths. In recent years, this technique has been widely adopted for watershed hydrologic studies. However, some parameters still require the analyst to manually examine maps and attributes tables in order to obtain the data, for instance, drainage density, mean elevation, median elevation, circularity ratio, bifurcation ratio, streams lengths ratio, stream areas ratio, and stream frequency. The process is often very time consuming, such that makes it difficult for hydrologic researches. The objective of this study was to develop a GIS software with an aim to automatically extract various watershed physiographic parameters using digital terrain model, in order to efficiently and effectively provide necessary parameters for watersheds hydrologic modeling analysis. The Cho-Ko-Shi watershed was selected as the study site. The results indicate that using digital terrain model and GIS to automatically extract watershed physiographic parameters is a feasible approach. The stream numbers, stream lengths, and watersheds areas obtained in the study all agree with the Horton’s laws very well, with R2 ranging between 0.96 and 0.99. In addition, this study implemented an approach that can automatically search for outlets of watersheds using stream network, and delineate multi-scale watersheds based on stream orders. The results may fill the requirements of watershed hydrologic analysis at various scales.
目錄
報告內容
摘要………
1
一、前言………
2
二、研究目的………
2
三、文獻探討………
2
四、研究方法………
3
五、結果與討論………
4
六、結論………
5
七、參考文獻………
6
附圖………
8
Fig. 1 Digital terrain model of the study site.………
8
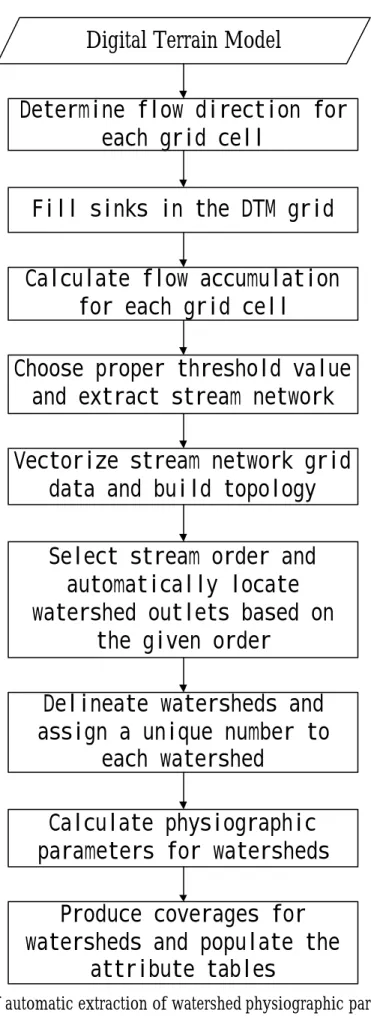
Fig. 2 Workflow of automatic extraction of watershed physiographic
parameters using digital terrain model.………
9
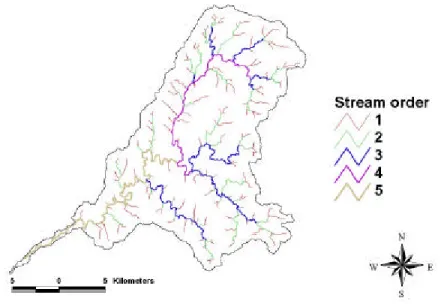
Fig. 3 Stream network of the study site.………
10
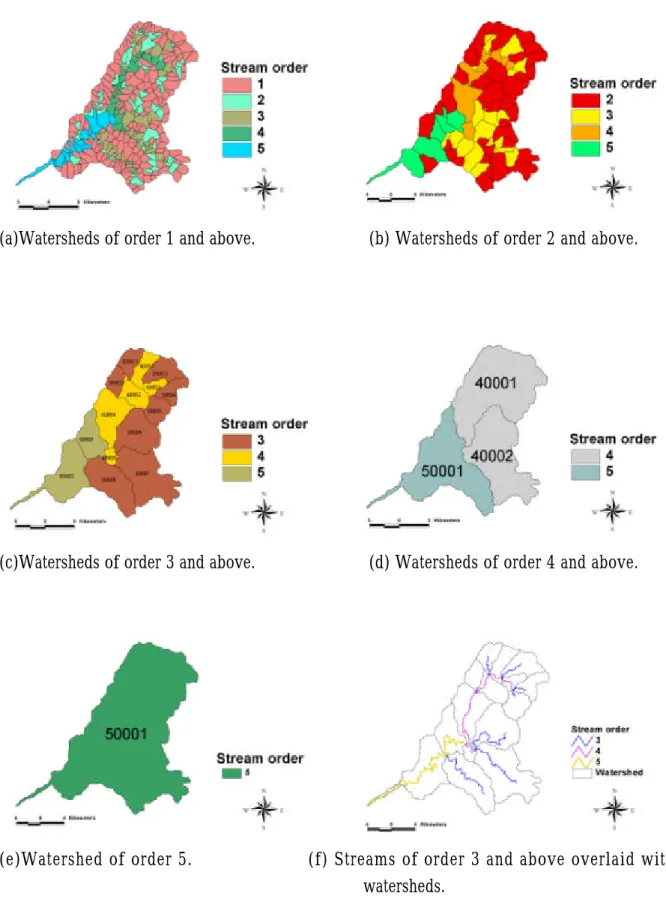
Fig. 4 Watersheds delineated for different minimum stream orders.………
11
Fig. 5 Horton’s ratios of stream numbers, stream lengths, and stream areas
derived from DTM of the Cho-Ko-Shi watershed.………
12
附表………
13
Table 1. Statistics of the stream network.………
13
Table 2. Physiographic parameters of the Cho-Ko-Shi watershed.…………
14
計 畫 成 果 自 評 … … …
15
1
數值地形模型與 GIS 於集水區水文模式上之應用(2/2)
Application of Digital Terrain Model and GIS in Watershed Hydrologic
Models
計畫編號:NSC 91-2313-B-004-001
執行期限:91 年 8 月 1 日至 92 年 7 月 31 日
主持人:詹進發([email protected]) 國立政治大學地政學系
計畫參與人員:廖健智、郭芳誠、林瑋棠(國立政治大學地政學系)
摘要 對於集水區地文特性之瞭解,為研究 集水區水文特性不可或缺之程序。利用數 值地形模型,配合地理資訊系統之空間分 析功能,可以迅速獲取集水區面積、河川 網路、河川級序、河川長度等地文參數, 近年來已被廣泛應用於集水區水文研究 上。然而,其他有關流域之地文因子如: 排水密度、平均高程、中值高程、圓比值 等,以及河川分岔比、河川長度比、河川 面積比、河川頻率等有關河川網路特性之 參數,則仍需以人工方式檢視圖形與屬性 資料方能求得,因此需耗費相當之時間, 頗不利於水文研究。本研究之目的為利用 數值地形模型,以 ArcInfo 地理資訊系統軟 體發展一能自動分析集水區地文參數之軟 體,期能迅速、有效的獲取集水區水文模 擬分析所需之參數。由分析濁口溪集水區 數值地形模型之結果顯示,利用地理資訊 系統自動粹取集水區地文參數確實為可行 之方法,獲得之河川支數、河川長度、集 水區面積等地文參數,均與 Horton 地形法 則極為吻合,其相關判定係數(R2 )介於 0.96 與 0.99 之間。此外,本研究以河川網路自 動分析集水區出水口,並可依據河川級序 劃分多尺度之集水區單元,頗符合不同尺 度集水區水文分析之需求。 關鍵詞:數值地形模型、地理資訊系統、 地文參數。 AbstractFull understanding of the physiographic characteristics of a watershed is essential for studying the watershed hydrologic characteristics. Using digital terrain model and geographic information system, one can rapidly obtain some physiographic parameters such as watersheds areas, stream networks, stream orders, and stream lengths. In recent years, this technique has been widely adopted for watershed
hydrologic studies. However, some parameters still require the analyst to manually examine maps and attributes tables in order to obtain the data, for instance, drainage density, mean elevation, median elevation, circularity ratio, bifurcation ratio, streams lengths ratio, stream areas ratio, and stream frequency. The process is often very time consuming, such that makes it difficult for hydrologic researches. The objective of this study was to develop a GIS software with an aim to automatically extract various watershed physiographic parameters using digital terrain model, in order to efficiently and effectively provide necessary parameters for watersheds hydrologic modeling analysis. The Cho-Ko-Shi watershed was selected as the study site. The results indicate that using digital terrain model and GIS to automatically extract watershed physiographic parameters is a feasible approach. The stream numbers, stream lengths, and
watersheds areas obtained in the study all agree with the Horton’s laws very well, with R2 ranging
between 0.96 and 0.99. In addition, this study implemented an approach that can automatically search for outlets of watersheds using stream network, and delineate multi-scale watersheds based on stream orders. The results may fill the requirements of watershed hydrologic analysis at various scales.
Keywords: digital terrain model (DTM),
geographic information system (GIS), physiographic parameters. 一、前言 集水區內之水文現象與地文因子有密 切之關係,因此,對於集水區地文特性之 瞭解,為研究集水區水文特性不可或缺之 程序。集水區之河川網路可以由地形圖量 測而得之,各項集水區地文參數如:流域 面積、坡度、坡向、形狀、河川長度等, 亦可藉由人工測繪而取得。但由於人工測 繪曠日費時,且常涉入個人之主觀意識, 由不同人員量測難以獲得一致之結果,因 此僅適合於較小區域之研究(Band,1993; 鄭祈全,1993;賴晃宇等,1997)。此外, 人工測繪受限於所使用圖面資料之比例 尺、品質,常難以獲得精確之成果,若欲 結合其他圖形資料如:土地利用圖、土壤 圖等,則因比例尺、精度不同,而更加困 難。因此,如何提昇產生集水區水文分析 所需之資料的效率與資料品質,乃成為集 水區水文研究之重要課題。 二、研究目的 由於集水區之水文研究常涉及大量資 料分析,且資料來源、精度、比例尺不一, 若以人工分析不僅需耗費大量時間與人 力,且往往資料品質因人為錯誤或主觀成 則需處理大量圖資,資料品質更難控制, 且整合分析亦更形困難,因此使研究難以 進行。 本研究之目的為利用數值地形模型, 以 ArcInfo 地理資訊系統軟體發展一能自動 分析集水區地文參數之軟體,期能迅速、 有效的獲取集水區水文模擬分析所需之參 數,以有效地解決前述之問題。 三、文獻探討
數值地形模型(Digital Terrain Model, DTM)或稱之為數值高程模型(Digital Elevation Model, DEM),乃以數值形式描述 地表起伏情形的數位式資料,其優點為便 於電腦處理與分析,可以由之迅速推導出 許多有用資訊,例如:坡度、坡向、地表 水流徑、流域面積等,且其分析方法不受 資料尺度大小之影響(Jenson and Domingue 1988;Jenson,1992;Band,1993)。近年 來由於電腦科技進展迅速,高效能且廉價 之電腦日益普及,利用數值地形模型為材 料,應用地理資訊系統(Geographic
Information System, GIS)配合各種空間分析 模式,以粹取河川網路、劃分集水區及取 得其他集水區地文因子,已被廣泛應用於 集水區之水文研究及自然資源經營規劃上 (O’Callaghan and Mark,1984;Jenson and Domingue,1988;Tarboton et al.,1991; Jenson,1992;Moore et al.,1992;Band, 1993;鄭祈全,1993;賴晃宇等,1997; 鄭祈全等,2000)。 集水區水文模式模擬,乃是利用數學 模式以模擬分析各種水文現象,可使吾人 充分瞭解集水區之水文反應,對於防止洪 氾與水資源規劃上均甚重要。水文模式參 數為進行水文模擬分析所必須,然而水文 參數之取得不易,常使其應用受到限制 (Bedient and Huber , 1992 ;鄭祈全等, 1996)。在實際應用上,河川網路與集水區
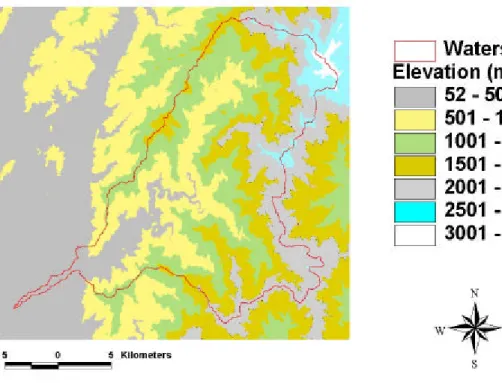
3 河川的長度、河川級序(stream order)、流域 面積(basin area)、流域之周長(perimeter)等 資訊,成為探討集水區水文特性之重要因 子,可提供集水區水文模擬分析所需之參 數(李光敦、江申,1997;賴晃宇等,1997; 詹仕堅、孫志鴻,2000)。然而,其他有關 流 域 之 地 文 因 子 如 : 排 水 密 度 (drainage density)、平均高程(mean elevation)、中值高 程(median elevation)、圓比值(circularity ratio) 等,以及河川分岔比(bifurcation ratio)、河 川長度比(ratio of stream lengths)、河川面積 比(ratio of stream areas)、河川頻率(stream frequency)等有關河川網路特性之參數,則 仍需以人工方式檢視圖形與屬性資料方能 求得,輒需耗費相當之時間,且易發生人 為之錯誤,頗不利於水文研究。因此本研 究以濁口溪集水區為試區,利用數值地形 模型,以 ArcInfo 地理資訊系統軟體發展一 能自動分析前述集水區地文參數之軟體, 期能迅速、有效的獲取集水區水文模擬分 析所需之參數。 四、研究方法 (一) 研究試區概述 本研究以濁口溪集水區為試區,主要 林型為暖溫帶天然闊葉林,有少部分的 針、闊葉混淆林,以及針葉林,除一部份 為林業試驗所六龜試驗林地之外,其餘皆 為隸屬林務局屏東林區荖濃溪事業區之國 有林地。集水區水系流經高雄縣桃源鄉與 茂林鄉後注入荖濃溪,海拔分布由與荖濃 溪匯集處之 150 公尺至東北角稜線卑南主 山的 3,295 公尺,全區面積約 38,000 公頃。 本區內設有出雲山自然保留區,及涵蓋雙 鬼湖自然保護區之一部份,兩處保護區合 計面積約 14,000 公頃,其目的為保育本區 內之稀有動、植物與生態體系。 (二) 研究材料及設備 1. 數值地形模型 本研究利用數值地形模型自動粹取河 川網路與集水區地文參數,Fig. 1 為所使用 之數值地形模型,由農林航空測量所提 供,每一像元點之解析力為 40m x 40m。原 始資料大小為 796 列 x 829 行,經前期處理 後擷取涵蓋研究試區之資料。 2. 地形圖 使用 1:25,000 經建版之地形圖,以及 由地形圖數化而得之河流線圖層,用於檢 核由數值地形模型粹取出之河川網路的正 確性。 3. 設備 本研究所採用的設備在硬體方面主要 為個人電腦,作業系統為Microsoft Windows 2000;軟體部份為 Environmental Systems Research Institute (ESRI)所發展之地理資訊 系統軟體 ArcGIS 8.1、ArcView 3.2,以及利 用 ArcInfo 之 AML (Arc Macro Language)巨 集語言自行研發之軟體。 (三)、研究方法 許多研究已證實,利用數值地形模型 粹取河川網路與區劃集水區為一可行且有 效之方法,近年來已被廣泛應用於水文研 究上(Jenson,1992;Moore et al.,1992)。 本研究之主要目的為發展一能利用數值地 形模型自動化粹取集水區地文參數之軟 體,Fig. 2 所示為軟體之執行流程。茲就過 程中較重要之步驟,詳細說明如下: 1. 河川網路粹取 河 川 網 路 的 粹 取 與 累 積 流 量 (flow accumulation)門檻值(threshold value)之設定 有密切的關係,因其關係到所粹取的河川 網 路 與 集 水 區 是 否 符 合 地 面 實 況 (Tarboton et al.,1991;鄭祈全等,1997; 李光敦、江申,1997)。Tarboton et al. (1991) 以 Horton(1945)提出之河川級序地形法則 為基礎,發展出尋找最適累積流量門檻值 之方法,並以分布於美國各地之 21 個集水 區進行研究,國內亦有學者進行相關研究 (鄭祈全,1993;陳信雄等,1997;詹仕堅、 孫志鴻,2000)。本研究參考地形圖上之河 流線,以累積流量等於 400 個網格點時作 為粹取河川網路之門檻值,於計算數值地 形模型各網格點之累積流量後,以 ArcInfo 之 GRID 模組的 CON 指令粹取河川網路, 並 以 STREAMORDER 指 令 依 照
Strahler(1957)所提之河川級序分類法定義 河川級序,然後以 STREAMLINK 指令賦予 每一條河川不同之編碼。為便於分析河川 網路之連結性,復以 STREAMLINE 指令將 網格式的河川網路轉換為向量式。取得河 川網路後可分別統計不同級序河川之支數 與長度,由於低級序河川直接匯入較高級 序之河川將產生虛擬節點(pseudo node),因 此需去除此類多餘之節點方能獲得二級河 以上之河川的正確支數,本研究採用詹進 發等(1999)發展之演算法進一步分析河川 網路,以取得不同級序之河川支數。 2. 集水區之劃分 集水區之劃分可藉由人工點選出水口 (outlet) 後 , 配 合 集 水 區 流 向 圖 以 WATERSHED 指令粹取而得。然而人工點 選出水口甚為耗時,尤其若研究區域面積 較大或河川網路複雜時,更不易實施。本 研究以鄭祈全等(2000)發展之方法自動搜 尋集水區之出水口,並依河川級序劃分集 水區,集水區內之各子集水區均自動賦予 不同之編碼,以區分集水區之級序,例如: 30005 代表第 5 個三級河集水區。本方法之 另一優點為可依照不同分析尺度之需求, 選定集水區劃分之標準,例如:實際負責 集水區治理之權責單位,可選擇以一級河 流域為最小劃分單元,而職司水資源經營 規劃之主管單位,因需考慮較大範圍之流 域,則可選擇以二或三級河流域為最小劃 分單元,如此可減少資料儲存空間與處理 分析所需之時間,且亦符合實際上規劃分 析之需要。若選擇以二級河以上之流域為 最小劃分單元,則各單元內之子集水區將 自動合併,頗適合不同尺度之經營規劃分 析。 3. 集水區地文參數分析 粹取河川網路與集水區後,本研究進 一步分析不同河川級序之河流支數、集水 區流域特性,並依據 Horton 之地形法則 (Horton,1945;Leopold et al.,1995;Chow et al.,1988;王如意、易任,1988)分析河 川網路之特性,各項地文參數之計算方式 如下: (2) 河川長度比(ratio of stream lengths):Rl = Lw / Lw-1
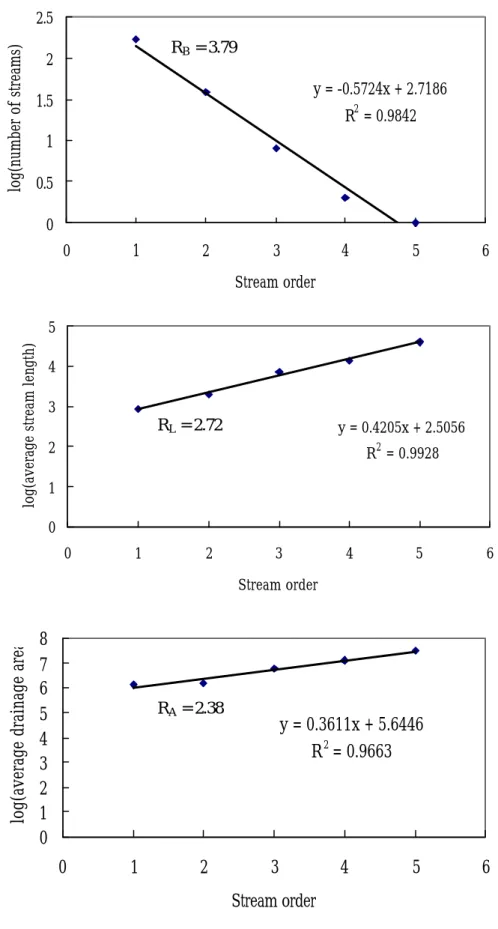
(3) 河川面積比(ratio of stream areas): Ra = Aw / Aw-1 (4) 排水密度(drainage density):D = L / A (5) 河川頻率(stream frequency):F = N / A (6) 流域之圓比值(circularity ratio):M = 4πA / P2 (7) 平均高程(mean elevation):流域內 所有網格點之平均高程 (8) 中值高程(median elevation):流域 中之某一高程值,在此高程以上之 流域面積與此高程以下之流域面 積相等 上式中 Nw為 w 級河之河川支數,Lw 為 w 級河之平均長度,Aw為 w 級河之平均 流域面積,L 為流域中全部河川之總長度, A 為流域之面積,N 為流域中之全部河川 總數,P 為流域之周界長度。各項地文參數 之計算均由本研究所研發之軟體自動完 成,並儲存於相對應之集水區屬性資料表 欄位中。 五、結果與討論 (一) 河川網路粹取 Fig. 3 為累積流量門檻值等於 400 時所 粹取出之河川網路,依照 Strahler 河川級序 區分法分析前述河川網路,所得之結果可 知依據本研究所使用之數值地形模型粹取 而得之最大河川級序為五級河。累積流量 門檻值之選定,對於河川網路之粹取有極 大之影響,不同門檻值將獲得不同之河川 網路,因此其河川長度、河流支數亦不同, 由之推算 Horton 比值,勢將獲得不同之結 果(Chen et al. 1997)。惟此方法不受數值地 形模型空間解析力大小之影響,一旦決定 門檻值,即可迅速獲取河川網路。 由 Fig. 3 可發現有為數甚多之低級序 河川直接匯入高級序河川,例如:一級河
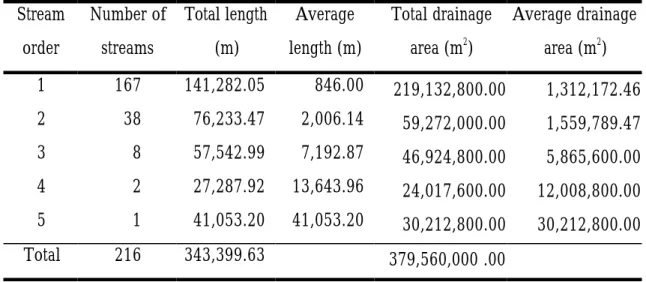
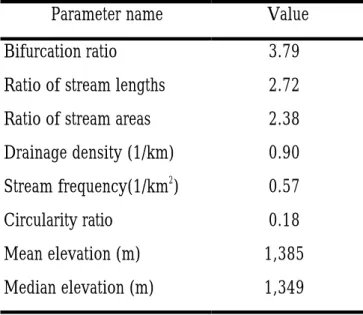
5 三、四、五級河,此種情形將使高級序河 川產生虛擬節點,計算河川支數時,需先 去除此類節點,方能獲得正確之數目。 (二) 集水區之劃分 由數值地形模型粹取而得之河川網路 為五級河,本研究即以五種不同河川級序 為標準劃定集水區,Fig. 4 中(a)、(b)、(c)、 (d)、(e)分別為以一、二、三、四、五級河 流域為最小單元劃定集水區之結果。由 Fig. 4 可知以一級河流域為最小劃分單元,將產 生許多小集水區,而以五級河流域為劃分 單元將僅只劃分出 1 個集水區。此外,以 三級河流域為最小劃分單元,共產生 8 個 三級河集水區、5 個四級河集水區及 2 個五 級河集水區;若以四級河流域為最小劃分 單元,則產生 2 個四級河集水區及 1 個五 級河集水區。進一步檢視 Fig. 4 之(c)、(d)、 (e),可發現(e)之集水區乃由(d)中之 40001、40002、50001 三個集水區所組成, 而(d)中之三個集水區則分別為(c)中之數個 子集水區所組成,例如:(d)中 40001 集水 區即由(c)中之 30001、30002、30003、 30004、30005、40001、40002、40003、40004 等共 9 個子集水區所組成。將集水區與河 川網路套疊如 Fig. 4(f),顯示各子集水區均 環繞一段完整之河川支流,而其出水口即 為低級序河川匯入較高級序河川之處。 集水區之經營管理需考慮不同經營尺 度之需求,利用本研究之集水區劃分方法 可視需要選擇適當之河流級序作為劃分標 準,便能迅速劃分出完整之集水區單元, 且不同尺度之集水區單元可相互套疊,有 助於資料之整合分析。由於集水區之出水 口係依據河川網路自動粹取而得,而河川 網路之形狀與累積流量門檻值密切相關, 因此集水區之周界亦受累積流量門檻值之 影響,不同門檻值將產生不同之結果。 (三) 集水區地文參數分析 本研究以詹進發等(1999)提出之演算 法分析河川網路,因此可迅速獲得不同級 序河川之正確數目,並可由之直接推算河 川分岔比、河川長度比、河川頻率等數值。 此外,河川面積比、排水密度、流域之圓 比值等,可利用河川長度、集水區面積、 集水區周界長度推算之,平均高程與中值 高程則可藉由套疊數值地形模型與集水區 界而求得。Table 1 所示為分別統計此河川 網路之不同級序河川支數、河川總長度、 河川平均長度、集水區總面積與集水區平 均面積之結果。由 Table 1 得知河川支數隨 河川級序之增加而遞減,河川平均長度與 集水區平均面積則隨河川級序之增加而遞 增,此頗符合自然界觀察所得之現象。 依據 Horton 地形法則,河川級序與取 對數後之河川支數、河川長度、集水區面 積呈線性關係,Fig. 5 顯示由數值地形模型 所粹取而得之河川網路與集水區面積,均 與 Horton 地形法則甚為吻合,其相關判定 係數(R2 )介於 0.96 與 0.99 之間。Table 2 為 以整個濁口溪流域為一完整地形單元時, 計算各項地文參數所得之結果。 六、結論 利用數值地形模型粹取集水區地文參 數,確實為一可行之方法,可迅速提供集 水區水文模擬分析所須之參數。本研究旨 在發展自動粹取集水區地文參數之技術, 其結論如下: (一) 河川網路粹取 由本研究所使用之數值地形模型粹取 而得之河川網路可知其中最大河川為五級 河,由於低級序河川直接匯入高級序河川 將使高級序河川產生虛擬節點,此種情形 在高級序河川之中、下游更為常見,計算 河川支數時,需先去除此類節點,方能獲 得正確之數目。 (二) 集水區劃分 以電腦自動分析集水區出水口,可提 昇資料分析作業之效率與分析結果之一致
性與正確性,對於集水區水文模擬分析至 為重要。本研究所採用之以不同河川級序 定義集水區劃分標準之方法,則可供不同 尺度集水區水文分析之參考,不僅可減少 資料儲存所需空間,且不同尺度之集水區 單元可相互套疊,資料易於整合,亦可增 進資料處理分析之效率。 (三) 集水區地文參數分析 藉由電腦自動分析河川支數,既可增 進效率,更可避免人為判釋而發生之謬 誤,若用於大面積集水區之河川網路分 析,更可顯出其優點。本研究所發展出之 方法可由數值地形模型自動粹取河川網路 與多尺度集水區,並迅速獲取河川分岔 比、河川長度比、河川面積比、河川頻率、 排水密度等多項集水區地文參數,對於集 水區水文模擬分析助益甚大。本研究中由 數值地形模型所獲得之濁口溪流域河川支 數、河川長度、集水區面積等地文參數, 均與 Horton 地形法則極為吻合,其相關判 定係數(R2 )介於 0.96 與 0.99 之間。 (四) 累積流量門檻值 累積流量門檻值之選定將影響河川網 路之粹取,由於集水區之出水口係以河川 網路自動分析而得,故集水區之劃分亦受 累積流量門檻值之影響。因此,選擇適當 之門檻值為自動粹取集水區地文參數之重 要步驟,尤須謹慎為之。 七、參考文獻 [1] 王如意、易任 1996 應用水文學(上 冊) 茂昌圖書公司發行 525pp. [2] 李光敦、江申 1997 面積門檻值對 集水區地文參數與水文模擬之影響 中華水土保持學報 28(1):21-32。 [3] 陳信雄、廖學誠、詹進發 1997 網 格大小及水流方向對福山集水區地形 指 標 之 影 響 臺大實驗林研究報告 11(2):1-13。 [4] 陳信雄、廖學誠、詹進發、黃正良 研究報告 11(3): 41-52。 [5] 詹進發、賴晃宇、陳永寬 1999 以 Chain-Node Topology 為基礎之演算法 自動分析河川支數之研究 臺大實驗 林研究報告 13(1):37-49。 [6] 詹仕堅、孫志鴻 2000 網格式數值 高程模型擷取河系集流閾值之探討 國立台灣大學地理環境資源學系地理 學報 28:27-45。 [7] 鄭祈全 1993 數值地型資料應用於 集 水 區 區 劃 和 河 川網路分析之研究 林 業 試 驗 所 研 究 報 告 季 刊 8(4): 331-343。 [8] 鄭祈全、詹進發、賴晃宇 1998 應 用數值地形模型與地理資訊系統粹取 多尺度生態單元之研究 第十七屆測 量 學 術 及 應 用 研 討 會 論 文 集 944-952 頁。 [9] 賴晃宇、鄭祈全、陳永寬 1997 數 值地形模型應用於地理資訊系統之建 立 台 大 實 驗 林 研 究 報 告 11(2):15-54。 [10] 賴進貴 1994 稜線及谷系自動粹取 的可行性分析和評估 行政院國家科 學 委 員 會 專 題 研 究 計 劃 成 果 報 告 NSC82-0202-M-002-156T。
[11] Band, L.E. 1993. Extraction of Channel Networks and Topographic Parameters from Digital Elevation Data. In K. Beven and M. J. Kirkby (eds.) Channel Network Hydrology. John Wiley & Sons, Chichester, England. pp. 13-42.
[12] Bedient, P.B., and W.C. Huber. 1992 . Hydrology and floodplain analysis. 2nd
ed. Reading (MASS): Addison-Wesley. pp. 311-368.
[13] Carter, J. R. 1988. Digital Representations of Topographic Surfaces. Photogrammetric Engineering and Remote Sensing. 54(11):1577-1580.
[14] Chow, V.T,, D.R. Maidment, and L.W. Mays. 1988. Applied Hydrology. New York: McGraw-Hill. pp. 166-170. [15] Heipke, C. 1995. State-of-the-Art of
7
Photogrammetric Engineering and Remote Sensing. 61(1):49-56.
[16] Horton, R.E. 1945. Erosional development of streams and their drainage basins: hydrophysical approach to quantitative morphology. Bulletin of the Geological Society of America, 56:275-370.
[17] Jenson, S.K. and J.O. Domingue 1988. Extracting Topographic Structure from Digital Elevation Data for Geographic Information System Analysis. Photogrammetric Engineering and Remote Sensing. 54(11):1593-1600.
[18] Leopold, L.B., M.G. Wolman, J.P. Miller. 1995. Fluvial processes in geomorphology. New York: Dover Publications. pp. 131-150.
[19] Mark, D.M. 1988. Network Models in Geomorphology. In M. G. Anderson (ed.) Modelling Geomorphological Systems. John Wiley & Sons, Chichester, England. pp. 73-97.
[20] Moore, I.D., R.B. Grayson, A.R. Ladson. 1992. Digital terrain modelling: a review of hydrological, geomorphological, and biological applications. In: Beven KJ, Moore ID, editors. Terrain analysis and distributed modelling in hydrology. Chichester (England): John Wiley and Sons. pp. 7-34.
[21] O’Callaghan, J.F. and D.M Mark 1984. The Extraction of Drainage Networks from Digital Elevation Data. Computer Vision, Graphics and Image Processing. 28:323-344.
[22] Strahler, A.N. 1957. Quantitative analysis of watershed geomorphology. Transactions, American Geophysical Union. 38:913-920.
[23] Tarboton, D.G., R.L. Bras and I. Rodriguez-Iturbe 1991. On the Extraction of Channel Networks from Digitial Elevation Data. Hydrological Processes. 5:81-100.
9
Fig. 2 Workflow of automatic extraction of watershed physiographic parameters usin g digital terrain model.
Determine flow direction for
each grid cell
Fill sinks in the DTM grid
Calculate flow accumulation
for each grid cell
Choose proper threshold value
and extract stream network
Vectorize stream network grid
data and build topology
Select stream order and
automatically locate
watershed outlets based on
the given order
Delineate watersheds and
assign a unique number to
each watershed
Calculate physiographic
parameters for watersheds
Produce coverages for
watersheds and populate the
attribute tables
Digital Terrain Model
11
(a)Watersheds of order 1 and above. (b) Watersheds of order 2 and above.
(c)Watersheds of order 3 and above. (d) Watersheds of order 4 and above.
(e)Watershed of order 5. (f) Streams of order 3 and above overlaid with watersheds.
Fig. 5 Horton’s ratios of stream numbers, stream lengths, and stream areas derived from DTM of the Cho-Ko-Shi watershed.
y = 0.3611x + 5.6446 R2 = 0.9663 0 1 2 3 4 5 6 7 8 0 1 2 3 4 5 6 Stream order
log(average drainage area)
y = -0.5724x + 2.7186 R2 = 0.9842 0 0.5 1 1.5 2 2.5 0 1 2 3 4 5 6 Stream order log(number of streams) y = 0.4205x + 2.5056 R2 = 0.9928 0 1 2 3 4 5 0 1 2 3 4 5 6 Stream order
log(average stream length)
RB = 3.79
RL = 2.72
13
Table 1. Statistics of the stream network.
Stream order Number of streams Total length (m) Average length (m) Total drainage area (m2 ) Average drainage area (m2 ) 1 167 141,282.05 846.00 219,132,800.00 1,312,172.46 2 38 76,233.47 2,006.14 59,272,000.00 1,559,789.47 3 8 57,542.99 7,192.87 46,924,800.00 5,865,600.00 4 2 27,287.92 13,643.96 24,017,600.00 12,008,800.00 5 1 41,053.20 41,053.20 30,212,800.00 30,212,800.00 Total 216 343,399.63 379,560,000 .00
Table 2. Physiographic parameters of the Cho-Ko-Shi watershed.
Parameter name Value Bifurcation ratio 3.79 Ratio of stream lengths 2.72 Ratio of stream areas 2.38 Drainage density (1/km) 0.90 Stream frequency(1/km2 ) 0.57 Circularity ratio 0.18 Mean elevation (m) 1,385 Median elevation (m) 1,349
15 計畫成果自評 集水區水文模擬分析結果能否與實際觀測數據吻合,與模擬時所用參數之正確與否 息息相關。由於水文模擬分析所需資料除了野外調查資料之外,有部分資料需從既有圖 籍資料予以數值化以供使用,以人工分析圖籍資料並轉換成數值資料不僅需耗費大量人 力與時間,更因人為錯誤難以避免,或分析成果易受個人主觀影響,致使資料品質不盡 理想,進而影響模擬分析結果之可靠性。因此,如何提昇產生集水區水文分析所需之資 料的效率與資料品質,乃成為集水區水文研究之重要課題。 本研究利用數值地形模型與地理資訊系統粹取集水區地文參數,可迅速提供集水區 水文模擬分析所須之參數,大幅增進萃取水文分析所需資料之效率;此外,藉由電腦自 動分析河川支數,更可避免人為判釋而發生之謬誤,若用於大面積集水區之河川網路分 析,更可顯出其優點,確實為一可行之方法。本研究所發展出之方法可由數值地形模型 自動粹取河川網路與多尺度集水區,並迅速獲取河川分岔比、河川長度比、河川面積比、 河川頻率、排水密度等多項集水區地文參數,對於集水區水文模擬分析助益甚大。 累積流量門檻值之選定將影響河川網路之粹取,由於集水區之出水口係以河川網路 自動分析而得,故集水區之劃分亦受累積流量門檻值之影響。因此,選擇適當之門檻值 為自動粹取集水區地文參數之重要步驟,如何決定適當之門檻值乃一值得研究之課題。 尤其近年來航測、遙測技術發展迅速,全球衛星定位系統大幅增進資料蒐集之效率,高 解析力之數值影像與數值地形資料之應用將日益廣泛。若在此方面之研究能有所突破, 將來應能提昇水文模擬分析之準確性。
紐西蘭 2002 西太平洋地球物理學研討會出國報告書
出國人:詹進發 服務機關:國立政治大學地政學系 出國地點:紐西蘭威靈頓 出國期間:2002/7/6-2002/7/13 報告日期:2002/7/9摘要
美國地球物理學聯合會(American Geophysical Union)每兩年舉辦一次西太平洋地球物 理學研討會(Western Pacific Geophysics Meeting),今年首度在紐西蘭舉行,會議地點位於 紐西蘭北島南端大城威靈頓(Wellington)。本次會議自 2002 年 7 月 9 日起至 7 月 12 日止, 研討會主題為地球物理科學相關之研究,來自世界各國之與會學者進行近百場研討會, 總計發表約九百篇研究報告,為一高水準之國際學術交流機會,成果相當豐碩。
緣起
美國地球物理學聯合會 AGU (American Geophysical Union)為一國際性的科學協會,擁 有逾 39,000 名來自 117 個國家的會員,其中非美國籍之會員超過 30%。AGU 成立於 1919 年,其宗旨為致力於推廣地球科學相關領域之研究,及透過科學的討論、出版品散播研 究之成果。AGU 之研究領域包含四個主要項目,即:大氣與海洋科學(Atmospheric and Ocean Sciences)、固體地球科學(Solid Earth Sciences)、水文科學(Hydrologic Sciences)、太空 科學(Space Sciences)。
AGU 每年均籌劃多項大型國際研討會,結合來自全世界之科學家共同研討地球科學 之相關研究議題,促成科學界之合作交流與知識之傳播。西太平洋地球物理學研討會 (Western Pacific Geophysics Meeting, WPGM)每兩年舉辦一次,本次會議在紐西蘭威靈頓會 議中心(Wellington Convention Center, Wellington, New Zealand)舉行,自 2002 年 7 月 9 日起 至 7 月 12 日止,為期共四天。主辦單位包括:AGU, Australian Institute of Physics, Geological Society of New Zealand, Institute of Geological and Nuclear Sciences, International Lithosphere Program, Meteorological Society of New Zealand, National Institute for Water and Atmospheric Research, New Zealand Geophysical Society, New Zealand Hydrological Society, New Zealand Marine Sciences Society, Royal Society of New Zealand, Victoria University of Wellington.
藉由參加研討會,可以了解地球科學相關研究領域之發展現況與未來研究方向,並 與來自世界各地之科學家進行學術交流,獲取相關技術應用之資訊,有助於提昇國內相
17
會議主題
本次會議主題分五大類:大氣科學(Atmospheric Sciences)、水文學(Hydrology)、海洋 科學(Ocean Sciences)、固體地球(Solid Earth)、太空物理學與行星科學(Space Physics and Planetary Sciences)。會議歷時共四天,每天各項主題均分數個場次同時進行研討會,在 近百場研討會中,總計發表約九百篇研究報告,主要討論內容如下:
一 、 大 氣 科 學
1. SOLAS: Surface Ocean – Lower Atmosphere Studies2. Trends and Variability in Southern Hemisphere Midlatitude Ozone 3. Paleoceanography and Climate Change
4. The Madden-Julian Oscillation
二 、 水 文 學
聖嬰與反聖嬰現象對於氣候有很大的影響,異常氣候則對於水資源有很大的影響, 例如近年來的氣候異常所造成的乾旱、水患,均對於農業生產、生態環境、經濟活動、 水資源造成重大衝擊。京都議定書的簽署,亦對於經濟活動和生態系統有很大的影響。 由於二氧化碳為主要的溫室氣體,如何評估二氧化碳的排放量,對於世界各國均為重要 議題。本項議題主要在探討異常氣候、二氧化碳排放的評估方法,以及提供科際合作的 機會。三 、 海 洋 科 學
全球溫暖化的結果,使得海水面上升,也使暴風雨造成的大浪衝擊更加嚴重。此外, 另一較不為人所知的海岸災害,乃南太平洋的海嘯。本議題主要為討論海水面的變化與 海嘯在太平洋地區的衝擊,以及相關之技術與資料用於評估海水面上升速率與氣候變化 所造成的差異。關於海嘯的研究,則探討過去數百年由於海底地層滑動所引起的海嘯之 影響。四 、 固 體 地 球
1. Deep Crustal Structure and Seismicity of Convergent Plate Margins 2. Magmatic Record of Tectonic Evolution: Antarctica and Beyond 3. Volcanoes in a Tectonic Context
5. Magmatic and Geothermal Processes in a Tectonic Context
6. Geochemical and Melt Inclusion Studies of Andesitic and Basaltic Magma Genesis and Evolution in the Western Pacific and Other Areas
7. New and Developing Geochronometers and Their Future Role in Measuring Landscape Evolution: Integrating Cosmogenic Nuclide, Apatite Thermochronology, and Luminescence Techniques
8. Volcanology Posters
9. The Auckland Volcanic Field: Records From Recent Drilling
10. Geodetic and Seismic Networks for Earthquake Hazards, Sea Level Change, and Vertical Reference Systems
11. Seismogenesis: The Earthquake Generation Process
12. Plate Boundary Fault Mechanics and the Interaction of Stress, Strain and Fluid Pressure Regimes
13. Modeling of Deformation and Faulting
14. Tectonism, Magmatism, and Kinematics of the Southwestern Pacific Between New Zealand and New Guinea: Late Cretaceous to Early Neogene
15. Distributed Versus Localized Deformation Along Major Active and Recent Transcurrent Faults
16. Tectonic Deformation of Continental Asia: Observational Results and Models
五 、 太 空 物 理 學 與 行 星 科 學
本議題主要在討論太空氣候的衝擊與預測,以及評估發展太空氣候預測與研究磁氣 圈-電離層(magnetosphere-ionosphere)之太空氣候過程的能力。此外,亦包括紐西蘭在雷 達(radar)方面之研究,與太陽系外之行星的研究。心得
一、 本次參與 AGU 舉辦之 WPGM 研討會,對於主辦單位籌劃大型國際會議之能力印 象深刻,舉凡討論議題之擬定、徵稿與註冊程序、議程安排、會議地點佈置與軟硬 體設施、會議資訊網站之架設、野外考察活動安排、大會服務與資訊提供,均井然 有序,對於未來我國舉辦類似研討會,有許多值得學習之處。 二、 此次會議主題涵蓋範圍甚廣,包括地球之物理環境、生態環境、大氣、海洋,乃至 於太空氣候與太陽系外之行星的研究。與會學者專家來自世界各國,雖有不同的文19 特質。參與研討會,看到許多學者熱心的貢獻研究心得,其對於科學研究的執著, 以及樂於與他人分享研究心得的無私精神,著實令人感佩。 三、 許多研究報告顯示遙感探測、地理資訊系統、全球衛星定位系統、先進的測量技術、 電腦科技等均廣泛的應用於各類研究,對於基礎資料之獲取的效率、資料品質、作 業時間與費用的節省皆有很大的效益。可見相關技術之發展與應用均日趨成熟,未 來國內之相關研究亦可借助先進國家之經驗,提昇國內之研究水準。 四、 許多議題牽涉不同之研究領域與特殊技術,因此需不同專才彼此合作,才能獲得良 好之研究成果。實際上科際整合已經是許多大型研究計畫不可避免之趨勢,在研討 會中也處處可見不同專才合作,甚至於跨國合作之例子。如何整合人才與資源,讓 所有研究成員與可用資源均發揮最大的功效,乃是我國未來在許多研究上應該努力 學習的方向。 附件:議程及相關文件
35
Outline
n
Extracting hydrologic information using
Digital Elevation Model
n
Stream network analysis
n
Watershed characteristics analysis
n
Extraction of multi-scale watershed
physiographic parameters
37
Hardware & Software
n
Operating system:Microsoft Windows
NT/2000
n
GIS software:ESRI ArcInfo 8.1,
ArcView 3.1
n
Scripts written in ARC Macro Language
n
Personal computer
39
Horton’s stream laws
n
Law of Stream Numbers
R
b
= N
w
/ N
w+1
n
Law of Stream Lengths
R
l
= L
w
/ L
w-1
n
Law of Stream Areas
41
The Chain-node topology
of stream networks
1 3 7 8 9 11 4 2 1 , 1 2 , 1 3 , 2 5 , 2 4 , 1 10 , 3 6 5 6 , 1 7 , 1 8 , 2 1 11 Node ID 10 , 3 Chain Internal Sequence Number Stream Order 10 9 , 1The arc attribute table (AAT)
of an ArcInfo coverage
COVER# 1 2 3 4 5 6 7 8 9 10 LENGTH -RPOLY# 0 0 0 0 0 0 0 0 0 0 LPOLY# 0 0 0 0 0 0 0 0 0 0 TNODE# 4 4 7 7 9 6 6 9 9 11 FNODE# 1 2 4 8 7 3 5 6 10 943
The Chain-node topology of
single-order stream coverages
1st order stream netwrok coverage 2nd order stream netwrok coverage
3rd order stream netwrok coverage
3 4 1 1 , 2 3 , 2 2 2 , 2 1 2 1 , 3 1 11 Node ID 2 , 1 Chain Internal Sequence Number Stream Order 1 3 8 2 1 , 1 2 , 1 5 , 1 5 3 , 1 4 , 1 10 6 , 1 4 6 7 9
The arc attribute table (AAT) of
single-order stream coverages
1st order stream network coverage
FNODE# TNODE# LPOLY# RPOLY# LENGTH COVER# COVER-ID
1 4 0 0 -1) 1 1 2 4 0 0 - 2 1 3 6 0 0 - 3 1 5 6 0 0 - 4 1 8 7 0 0 - 5 1 10 9 0 0 - 6 1
2nd order stream network coverage
FNODE# TNODE# LPOLY# RPOLY# LENGTH COVER# COVER-ID
1 3 0 0 - 1 2
2 4 0 0 - 2 2
3 4 0 0 - 3 2
3rd order stream network coverage
FNODE# TNODE# LPOLY# RPOLY# LENGTH COVER# COVER-ID
45
Algorithm for determining the number of
streams in a stream network
// Algorithm for determining the number of streams in a stream network FOR each stream order DO
{
NumberOfStreams := 0 // initialize the counter to 0 FOR each stream chain DO
{
Get the FROM-NODE of this chain
IF the FROM-NODE is NOT a TO-NODE of another stream chain NumberOfStreams := NumberOfStreams + 1
// increment the counter }
Print the NumberOfStreams // number of streams is determined }
Watershed characteristics
analysis
n
Drainage density:D = L / A
n
Stream frequency:F = N / A
n
Circularity ratio:M = 4πA / P
2
n
Mean elevation
47
The workflow of multi-scale
watersheds delineation
Digital Terrain Model Determine flow direction Calculate flow accumulation Choose proper threshold value Derive stream networks Select streams of specified stream orders
Automatically determine stream orders and outlets Delineate watersheds using outlets found in
the previous step Produce coverages of
watersheds for the specified orders
49
Simple statistics of the
stream networks
Stream
order
Number of
streams
Total
Length (m)
Average
Length (m)
1
132
117502.55
890.17
2
26
53871.72
2071.99
3
5
36692.22
7338.45
4
1
33014.58
33014.58
Total
164
241081.09
1470.01
51
Watersheds of
second-order and above
1 0 1 2 Kilometers N E W S
Order
2
3
4
(b)
Watersheds of third-order
and above
30004
40002
30001
30005
30002
40001
30003
40003
1 0 1 2 Kilometers N E W SOrder
3
4
(c)
53
Fourth-order watershed
40001 1 0 1 2 Kilometers N E W SOrder
4
(d)
55
Statistics of stream
networks and watersheds
Stream
order
Number of
streams
Total
length(m)
Average
Length(m)
Number of
Watershed
Total Area
(m
2)
Average Area
(m
2)
1
92
77897.88
846.72
97
122168000
1259463.92
2
18
29567.23
1642.62
53
21833600
411954.72
3
4
35646.54
8911.64
52
30124800
579323.08
4
1
33014.58
33014.58
25
26788800
1071552.00
Total
115
176126.24
1531.53
227
200915200
885088.99
Various physiographic parameters of
the 4
th
-order watershed
Parameter name
Value
Bifurcation ratio
4.54
Ratio of stream lengths
3.69
Ratio of stream areas
1.19
Drainage density (1/km)
0.88
Stream frequency(1/km
2)
0.57
Circularity ratio
0.33
Mean elevation (m)
1084
Median elevation (m)
1042
57
Ratio of stream numbers
y = -0.5724x + 2.7186 R2 = 0.9842 0 0.5 1 1.5 2 2.5 0 1 2 3 4 5 6 Stream order log(number of streams)
Ratio of stream lengths
y = 0.4205x + 2.5056 R2 = 0.9928 0 1 2 3 4 5 0 1 2 3 4 5 6 Stream order59