如何在新興市場建立綠能產品的品牌權益---以電動腳踏車在越南市場行銷為例
72
0
0
全文
(2) 謝誌. 時間過得真快,兩年 EMBA 的課程一轉眼就結束了。感謝高雄大學的 老師們不辭辛勞到越南開班授課,讓我與外子離開學校 30 年後,能有機會 可以再重拾書本與大家一起分享學習的樂趣。非常謝謝 EMBA 中心 陳一 民主任於行政與教學雙重繁忙中能撥空擔任我與外子的指導教授。也非常 謝謝 黃英忠校長能排除萬難,在越南 EMBA 班虧損連連的狀況下,仍給 予越南台商同等學習的機會。 經過無數夜晚的挑燈夜戰終於完成此論文,過程中非常感謝. 陳主任. 給我的指正與教導,也謝謝碩士班的學弟給予問卷資料整理的協助。在此 也要感謝論文的口試教授給予的指正,整個過程讓我獲益良多。讓此論文 的可讀是更加流暢,非常謝謝指導與教誨。 外子與我一起就讀 EMBA 在職專班;30 年前我們也是一起就讀台北工 專在職專班認識;30 年後有幸也一起就讀高雄大學在職專班;學習的過程 無數的樂趣及成長,認識很多學有專精的朋友,真的感恩上天的安排。 再一次謝謝所有的師長與同學,有機會與大家認識與學習,是我這一 生最大的福分。 張琇梅 敬誌於 高雄大學 2012.06.
(3) 中文摘要 本研究的主要目的是將企業社會責任的奉獻導入至 B2C 之品牌權益架構。 並探討開發中國家的消費者對環保認同的強度和企業善盡社會責任的形象,對建 立品牌權益及消費者的購買意圖是否有正面的影響。首先本研究了解品牌權益之 決定因素:(1)知覺品質;(2)品牌忠誠度;(3)品牌知名度/聯想;(4)企業社會責任 (CSR)。CSR 通常被視為建立企業形象及品牌權益的來源之一,藉由 CSR 提升品 牌的形象且轉化為消費者對購買意願的正向評估。本研究應用 STP 及 4P 的分 析手法來制定產品的行銷策略及品牌權益的建立,且以越南南部消費者做問卷調 查。研究發現品牌忠誠度對品牌權益,品牌權益對品牌偏好,品牌偏好對購買意 圖,這三者關聯度是顯著的;但是,知覺品質對品牌權益,品牌聯想與知名度對 品牌權益,企業社會責任對品牌權益,這三者關聯度卻不顯著。所以;建立品牌 的忠誠度、發展通路的行銷策略,可為個案公司帶來正向的行銷利益。本研究呈 現顯著相關之假說與先前學者的研究結果相互呼應,且為新興國家的企業對該地 區品牌權益的建立提供一個具有價值的思考方向。 關鍵詞:企業社會責任(CSR)、節能產品、新興市場、品牌權益. I.
(4) How to Establish the Brand Equity on Green Product in Emerging Markets --A Case of Marketing an Electrical Bicycle in Vietnam. Adviser:Dr. Yi-Min Chen Institute of Department of Asia-Pacific Industrial and Business Management National University of Kaohsiung Student:Hsiu- Mei Chang Institute of Executive Master of Business Adminstration National University of Kaohsiung. ABSTRACT. The purposes of this study are to identify the types of Corporate Social Responsibility (CSR) activity and test the effect on the relative business to consumer (B2C) brand equity on brand loyalty and perceived quality. Also invested the strength of environment concerned on Green Product in Emerging country, when corporate values on social responsibility will be the positive effect a determination in frame of consumer mind. First, this study understand the determinants of brand equity is a key theoretical and empirical issue in the fields of marketing and business in B2C market which has emphasized determinants at six primary levels of analysis: (1) perceived quality; (2) brand loyalty; (3) brand awareness with associations (4) Corporate Social Responsibility (CSR). CSR be considering the one of important key element to create the Brand Equity.. The positive brand equity will be encouraged the brand. preference then to purchase intention from various competitive brands to case II.
(5) company. This study following the STP and 4Ps analysis on marketing mix elements to research the best practice on marketing strategy and brand equity. The questionnaire was limited in south of Vietnam. Our research found the brand loyalty positively influence with brand equity; brand equity will impact the brand preference then encouraged to purchase intention. However, perceived quality, brand awareness/association and CSR were negative relative on brand equity with Green Product. Thus, to create a brand equity in Vietnam and developing the dealer distribution intensity will bring the positively influence the market benefit in case company. Finally, the analysis reconciles some results with those of previous studies, implications of these findings for brand managers are offered. In the meantime, also provide another valuable managing thinking on those companies who’s located in emerging markets.. Keywords:Corporate Social Responsibility (CSR); Green Product; Emerging country Brand Equity. III.
(6) Table of Contents 中文摘要........................................................................................................................ I ABSTRACT ................................................................................................................. II Table of Contents ...................................................................................................... IV List of Figures ............................................................................................................ VI List of Tables ............................................................................................................ VII Chapter One: Introduction ......................................................................................... 1 1.1 Research background....................................................................................................... 1 1.2 Research motivation and purposes .................................................................................. 3 1.3 Research process ............................................................................................................. 7. Chapter Two: Literature review ................................................................................ 9 2.1 Perceived quality ........................................................................................................... 11 2.2 Brand loyalty ................................................................................................................. 12 2.3 Brand awareness with associations ............................................................................... 13 2.4 CSR on Environmental Responsibility .......................................................................... 13 2.5 Brand Preference ........................................................................................................... 16 2.6 Purchase intention ......................................................................................................... 18. Chapter Three:Research method .......................................................................... 20 3.1 Research framework ...................................................................................................... 20 3.2 Survey procedures and sample ...................................................................................... 21 3.3 Methodology ................................................................................................................. 25. Chapter Four:Empirical Result ............................................................................. 26 4.1. Demographics ............................................................................................................... 26 4.2 Measurement Model ...................................................................................................... 27 IV.
(7) 4.3 Structure ........................................................................................................................ 29 4.4 Discussion ..................................................................................................................... 32. Chapter Five: Conclusion.......................................................................................... 37 5.1 Conclusion ..................................................................................................................... 37 5.2 Suggestion ..................................................................................................................... 38 5.3 Limitations..................................................................................................................... 40. Reference .................................................................................................................... 41 Appendix ..................................................................................................................... 49. V.
(8) List of Figures Figure 1 Motorcycle industry in Vietnam market from 2001-2011……......................5 Figure 2 The flow chart……………………………………………………………….8 Figure 3 Population growing on past 10 years in Vietnam………………………..…17 Figure 4 Population by age and sex in Vietnam……………………………………...17 Figure 5 The hypothesized model……………………………………………………20 Figure 6 The path coefficient ....................................................................................... 30 Figure 7 The population by ASEAN plus 3 countries and TPP members ................... 34 Figure 8 Vietnam becomes a FTA party in ASEAN and TPP ...................................... 35. VI.
(9) List of Tables Table 1 Real GDP, Consumer Prices, Currency sourced by IMF report…...…..…….10 Table 2 The measurement of preceived quality………………………………………21 Table 3 The measurement of Brand loyalty………………………………………….22 Table 4 The measurement of Brand awareness with association…………………….22 Table 5 The measurement of Brand equity…………………………………………..23 Table 6 The measurement of Corporate social responsible………………………..…23 Table 7 Reliability and validity………………………………………………............24 Table 8 Demographics of sample ………………………….………………………...26 Table 9 Composite reliability…………………………………………………...…....28 Table 10 Discriminant validity………….……………………………..………….….29 Table 11 Results of hypothesis testing…….……………...…………………….……31. VII.
(10) Chapter One: Introduction. 1.1 Research background More than half of the world's population lives in Cities. It’s around 3.5 billion on March., 2012. The global economy got so bad and difficult to survive in those developing countries, continuously more people moves in the cities. The Gasoline motorcycle becomes the major and convenience transportation tool in emerging countries, it’s also a root caused on air pollution problem on those cities. The Government in emerging countries put more effort and incentive programs on Economy growth on past time, however, the global warming caused the natural disaster also bring their attention, their lost more than 2-3 years Gross Domestic Product (GDP) growing rate when suffering things happened. Such as Thailand flooding problems happened on 2011, the impact were still suffering on their economy and Foreign Direct Investment (FDI) on 2012. The Electrical bicycle is a Green Products and become more popular to use in European countries and Japan. If the products could sell well in Emerging countries, the benefit will be reduced gas usage and air pollution, it’s helping to reduce Green House Gas ( GHG) emissions. This paper wants to research a success business model for “How to Establish the Brand Equity on Green Product in Emerging Markets.” People might not consider that’s an important activity to establish a brand in emerging country as Vietnam, because so many copycats listing on the markets, they might not value and respect the proprietary name and Patent. The GDP in Vietnam was 6.7% in 2010, and it is forecast to grow by 6% on 2012. It’s hard to believe that Vietnamese is 1.
(11) willing to spend US$ 6,000 –US$ 7,500 to buy the Honda or Piaggio brand imported 125 c.c. motorcycle, that’s around 30 months of their average wages. In another world, Vietnamese values the exteriors appearance and other people respectability by their wear and their bike! It’s a significant influence by French culture still in evidence today. Brand equity has been a prevalent topic in business practice since the early 1990s. The research focused on explaining brand equity has emphasized determinants at four primary levels of analysis: (1) brand awareness; (2) brand loyalty; (3) perceived quality; and (4) brand associations (Aaker 1991; Keller 1993; Aaker 1996; Yoo, Donthu et al. 2000; Yoo and Donthu 2001). For instance, Yoo et al. (2000) found that advertising contributes to strong brand loyalty and enhances brand loyalty, thereby leading to higher brand equity. However, despite an extensive literature on brand awareness, brand loyalty, perceived quality, and brand associations, most of previous studies have been made on customer-based brand equity. In other words, a systematic examination based on a conceptual framework for understanding each effect on brand equity for business-to-consumer (B2C) brands is lacking especially competing with brand. Aaker (1991) contended that to get the markets is more important than to get the factories, and the only way to enforce the markets is to own one or more competitive brands. In addition, this study following recent research views brand loyalty and perceived quality as a desire outcome of B2C brand equity which possibly is moderated by cooperate social responsibility . Although very few researchers have recently focused on CSR impacted on B2C brand equity. In fact, several dimensions in customer-based brand equity can be directly applied and transferable to industrial brand equity (Michell, King et al. 2001; van Riel, Pahud de Mortanges et al. 2005; Lai, Chiu et al. 2010). Therefore, this study 2.
(12) following previous literature on customer-based brand equity investigates the sources of B2C brand equity with the Corporate Social Responsibility in the Electrical Bicycle markets.. 1.2 Research motivation and purposes We knew the GHG emissions caused by air pollution. The potential climatic changes impacted nature disasters happened in all over the World. There is a Clean Development Mechanism (CDM) program under United Nations Framework Convention on Climate Change (UNFCCC) on the Kyoto Protocol in item 12. The emissions- reduction projects in developing countries could gain the Credit. Kyoto Protocol will be out on 2012, therefor, UNFCCC members signed a new Durban Climatic agreement in Durban, South Africa on Dec. 11th., 2011 , to continuous the GHG emission control after 2012.. There is a sanction of the law to be following. after 2015. They also set up a US$ 100 billion Green Climatic funds spending every year, to help the developing countries run the CDM programs. It’s great news that China, India and USA signed the Durban Climatic agreement on the Dec. 2011. They are the top 3 countries caused the GHG emission problems. The case company wants to investigate a success business matrix and Brand equity on Electrical Bicycle (EB) in Vietnam market. Vietnam Government encouraged the EB products to replacement the motorcycle volume in their market. There is a law to allow a senior high school kids ride an Electrical Bicycle (EB) to school, instead of riding a gasoline motorcycle. Vietnam Government did not offer a subsidy to EB products as the most developed countries have their incentive policy. The manufacturing could registered their production volume and count the emission-reduction on CDM projects under the UNFCCC. Once got an approval and a certification no., then those earn credits by sold out the EB volume could be tradable 3.
(13) and saleable in the future. For example; Mr. Chang who’s a president of Trend Micro Co. went to the North of Vietnam in 2006, set up a company called InnovGreen Co., already planted more than 24,700 acres land of trees till today. The tress could be counted the CO2/e and selling their carbon right to another counties or companies. The estimated value as below; 2.47 aces (=one hectares) on 20 years forestation land will gain12.6 tons fixing carbon per year. Mr. Chang could gain 126,000 tons fixing carbon right every year on those 24,700 acres after 2026. Plus bring a lot of positive images on Trend Micro’s Brand Equity, those value will be unlimited to count. Many OEM factories, companies and brand are facing a lot challenge in the competitive environment. Raw material, Labor, energy and manufacturing cost are all increased on past 3 years. Customers want to have a cost reduction every year, or change to buy from another sources or brands. To build their brand is more and more important which want to maintain their competitive advantage. Aaker (1991) contended that to get the markets is more important than to get the factories and the only way to enforce the markets is to own one or more competitive brands. How about the brand of Electrical Bicycle industry in emerging country as Vietnam? The European Commission decided to cease imposing anti-dumping tariffs on Vietnamese bicycles beginning on July 2010. While many other countries continue to be subject to tariffs.( http://www.dtinews.vn/en/news/018/3979/ministry-warns-bicycle-makers.htm l) "If the quantity of Vietnamese bicycles exported to the EU increases suddenly, it is likely that the EU will again impose an anti-dumping tariff on Vietnamese bicycles," said Vu Ba Phu, deputy head of the authority. So, it’s not only a traditional simple two wheels bicycle, the case company wants 4.
(14) to involve the EB products could gain a dividing product line in emerging market, and plans to bring the future extensional their market to EU. . There are 30 bicycle production enterprises and around 2 million capacities per year in Vietnam. It’s less 100,000 units of EB product manufacturing today. However, the motorcycle manufacturing are less than 15 brands company in Vietnam, Such as Honda、Yamaha、Suzuki、VMEP、Piaggio plus another small local brands manufacturing. The top 6 companies already covered 90% of market share. As can be seeing from Figure 1, the total motorcycle volume is more than 33 million in Vietnam on 2011. ( Source: General Statistics Office of Vietnam). Motorcycle Quantity/10,000 3,340 2,330 2,435. 836. 1. 1,027 1,138. 2. 3. 1,338. 4. 1,609. 5. 2,044 1,862 1,955. 6. 7. 8. Figure 1 Motorcycle Quantities from 2001-2011 in Vietnam. 5. 9. 10. 11.
(15) The motivation and benefit from consumer concerned with electric bicycles including as below; 1. Health Benefit from cycling 2. Practicality benefit from energy saving 3. Economic and environment benefit from reduce the GHG emission 4. Safety concerned due to the speed limited 5. Hope for the present and future product in the world Most bicycle manufacturing put their effort on Europe and Japanese market. The vast majority of all bikes sold worldwide (82 percent) are manufactured in two countries: An estimated 124 million bicycles were manufactured worldwide in 2007. • China (71.8 percent or 89.0 million units) • India (10.0 percent or 12.4 million units) According to Bicycle Retailer & Industry News (9/1/08), approximately 20.8 million electric bikes were sold worldwide in 2007, 20 million of which were sold in China. Only 120,000 eBikes were sold in the United States in 2007, although that total is expected to hit 170,000 in 2008 and 220,000 in 2009. http://www.interbiketimes.com/pdf/Bicycle_Industry_Facts_Sheet--Fall2008--Fin al.pdf Compared with motorcycle growing volume, it’s a lot of business opportunity on EB product in Vietnam. The Case company has designed the EB products and focus their target market on 11 years to 19 years old school kids, through the current North、 South and Middle of Vietnam agents to sell their electric bicycle. Vietnam Government has a laws limited for below senior high school kids ride a motorcycle to their school. This request brings a targeting and positioning on case company on their EB products. 6.
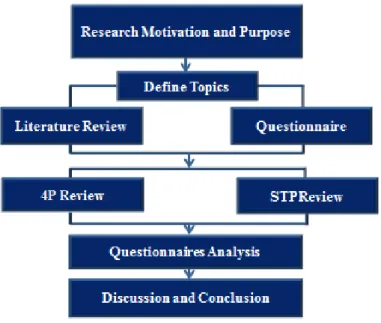
(16) The products photos as below;. 1.3 Research process Little attention has been given to the point of Social Network systems in 21 century, cyberspace、Google and eBay will bring some different thinking on Brand Equity. This paper will use STP and 4Ps analysis on marketing strategy in Emerging country today, there was a positive systems influence bring some impacted on Brand 7.
(17) Equity. The next section provides the conceptual model of how buyer-based equity of a B2C service brand might be influenced by perceived quality, brand awareness with associations, and brand preference and purchase intention effects, and develops related hypotheses. Then, will present our research design, sample, and method. The results of empirical part of this study are then presented, followed by the conclusions and implications. The flow chart is depicted in Figure 2.. Figure 2 The flow chart. 8.
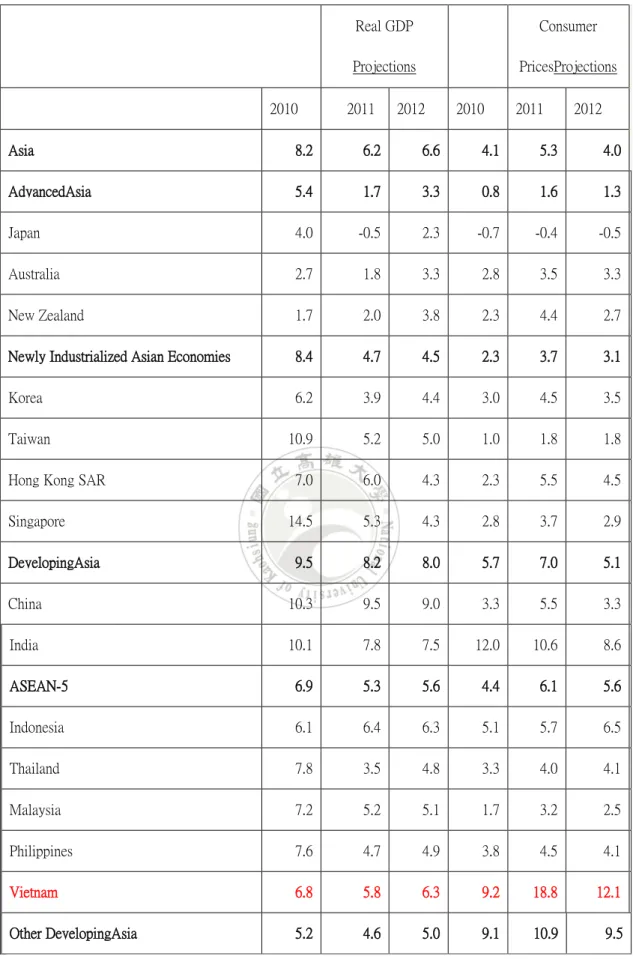
(18) Chapter Two: Literature review In 1817, Baron von Drais invented a walking machine that would help him to get a round of Royal gardens faster.. The next appearance of a two-wheeled riding. machine was in 1865. Both bicycles were made by wood. The first metal machine was made in 1870. The manufacturing of bicycle is not a high technical product since 1817 till today. The General Statistics Office of Vietnam did not have a control records on Electrical Bicycle. The Most of Electrical motor was imported from China now. It’s a lot of potential business opportunity in Vietnam. Economy growing rate got very well and the political is also stable for FDI.. The GDP rate will be growing and. inflation rate will be under control and drop to 12.1% in 2012 by IMF estimated. See detail as Table 1. Selected Asian Economies: Real GDP, Consumer Prices, Currency (Annual percent change unless noted otherwise) by IMF report.. The Asian countries of GDP kept growing on past three years. China, India, Indonesia and Vietnam are on the top four countries. Vietnam becomes a shining star in emerging country, and also got a trade balance and out of the trade deficit on 2012. The trade deficit was suffering in Vietnam since 1990 till the first quarter of 2012. The FDI moved their manufacturing and suppliers base from China to Southeast Asian countries due to the labor rate increased in China. Original, the first priority choice should be in Thailand, however, the Thailand was fighting the flooding problems on 2011. So, the FDI change their location in Vietnam.. 9.
(19) 2010. Real GDP. Consumer. Projections. PricesProjections. 2011. 2012. 2010. 2011. 2012. Asia. 8.2. 6.2. 6.6. 4.1. 5.3. 4.0. AdvancedAsia. 5.4. 1.7. 3.3. 0.8. 1.6. 1.3. Japan. 4.0. -0.5. 2.3. -0.7. -0.4. -0.5. Australia. 2.7. 1.8. 3.3. 2.8. 3.5. 3.3. New Zealand. 1.7. 2.0. 3.8. 2.3. 4.4. 2.7. Newly Industrialized Asian Economies. 8.4. 4.7. 4.5. 2.3. 3.7. 3.1. Korea. 6.2. 3.9. 4.4. 3.0. 4.5. 3.5. Taiwan. 10.9. 5.2. 5.0. 1.0. 1.8. 1.8. 7.0. 6.0. 4.3. 2.3. 5.5. 4.5. 14.5. 5.3. 4.3. 2.8. 3.7. 2.9. 9.5. 8.2. 8.0. 5.7. 7.0. 5.1. China. 10.3. 9.5. 9.0. 3.3. 5.5. 3.3. India. 10.1. 7.8. 7.5. 12.0. 10.6. 8.6. ASEAN-5. 6.9. 5.3. 5.6. 4.4. 6.1. 5.6. Indonesia. 6.1. 6.4. 6.3. 5.1. 5.7. 6.5. Thailand. 7.8. 3.5. 4.8. 3.3. 4.0. 4.1. Malaysia. 7.2. 5.2. 5.1. 1.7. 3.2. 2.5. Philippines. 7.6. 4.7. 4.9. 3.8. 4.5. 4.1. Vietnam. 6.8. 5.8. 6.3. 9.2. 18.8. 12.1. Other DevelopingAsia. 5.2. 4.6. 5.0. 9.1. 10.9. 9.5. Hong Kong SAR Singapore DevelopingAsia. Table 1 Real GDP, Consumer Prices, Currency 10.
(20) Marketing strategies that are successful require market analysis, e.g., competitors, consumers, and internal analysis, e.g., marketing mix, which leads to a competitive advantage, e.g., relationship building, loyalty programs. Thus, the objective of marketing strategy is to deliver value to customers as well we build a long-term and mutually profitability relationship with customers (Dick & Basu, 1994). Specific to marketing strategies are based on Segmenting, Targeting and positioning (Keller 1998). Brand equity is a set of brand assets and liabilities linked to a brand, its name and symbol that add to or subtract from the value provided by a product or service to a firm and to that firm’s customers (Aaker 1991). In other words, customer-based brand equity is generated when the customer is aware of the brand, perceives the overall quality or superiority of a brand relative to alternative products, and associates some favorable, strong, and unique attributes with the brand’s image (Aaker 1991). However, this paper will be focused the research in the field of marketing strategies on Electrical bicycle and also established the brand equity in emerging countries as Vietnam.. 2.1 Perceived quality The importance of perceived quality as a source of customer-based brand equity is well established in B2C market (Aaker 1991). The perceived brand quality is including the product quality and service quality. The product quality is very easy to identify by drawing specification, designed by consumer point of view and more valuable in comparative comfort to buy from another competitive product. Service quality including personal contact and support services, together with the product’s physical quality, increasingly form the basis for competitive advantage (Alvarez and Galera 2001), and are critical to purchasing decisions and branding (Hakansson and Group 11.
(21) 1982; Grönroos 1984; Rauyruen and Miller 2007). Therefore, we hypothesize positive relationships between perceived quality with brand equity.. Hypothesis 1: Perceived quality positively influence brand equity in the B2C product.. 2.2 Brand loyalty Brand loyalty is defined as “a deeply held commitment to rebuy or re-patronize a preferred product or service consistently in the future, despite situational influences and marketing efforts having the potential to cause switching behavior” (Olive, 1999). On recently research paper found that there are positive relationships between perceived quality and brand loyalty, between brand awareness and perceived quality, between advertising attitudes and brand awareness, and between distribution intensity with brand awareness in both Thailand and Vietnamese markets. However, the relationship between brand awareness and brand loyalty was found only in the Vietnam market, and the relationship between advertising attitudes and perceived quality was only found in the Thai market. Finally, no relationship between distribution intensity and perceived quality was found in either market (Tho D. Nguyen, Nigel J. Barrett, Kenneth E. Miller, (2011) "Brand loyalty in emerging markets", Marketing Intelligence & Planning, Vol. 29 Iss: 3, pp.222 – 232). Thus, we still hypothesize positive relation between Brand Loyalty with Brand Equity. Hypothesis 2: brand loyalty positively influence Brand equity in the B2C product.. 12.
(22) 2.3 Brand awareness with associations Brand awareness measured the degree to which the buyer recognized or recalled that the brand was a member of a certain product category and brand association measured the degree to which anything of significance was linked to memory of a brand (Aaker, 1996), and two of those constructs are critical determinant of customer-based brand equity in B2C market. However, in this study, as also found by Washburn and Plank (2002) and Yoo and Donth (2000, 2001), measurement items for brand association and brand awareness were heavily loaded on one single factor which called “brand awareness with associations” that was viewed as an antecedent of brand equity. The buyers want to trade to the providers which with the high brand awareness with associations that also means the provider with the high brand equity. In other words, brand awareness with associations has strong impact on the B2C brand equity (Kim & Hyun, 2010). Thus, we hypothesize positive relationship between brand awareness with associations and B2C brand equity. Hypothesis 3: Brand awareness with associations positively influence brand equity in the B2C context.. 2.4 CSR on Environmental Responsibility The goal of CSR is to embrace responsibility for the company's actions and encourage a positive impact through its activities on the environment, consumers, employees, communities, stakeholders and all other members of the public sphere who may also be considered as stakeholders. (From Wikipedia, the free encyclopedia) 13.
(23) “Consumers increasingly expect companies to make a broader contribution to society. The business benefits of doing are not evident. Prior studies conclude that consumer’s purchase decisions are positively influenced by socially responsible initiatives. According to the research carried by Cone Inc., in 2009, 79% of consumers would switch to a brand associated with a good cause”. Kaur, and Agrawal (2011) “ In the findings, it showed that the commitment to CSR activity is highly appreciated which means that there is a brand future of CSR in the company.” (Vassileva, 2001). By doing CSR activities, a firm can improve its Brand equity. (David, 1996) Vietnam became a Trans-Pacific Partnership (TPP) member on 2010, Taiwan government put an activity plan to join the TPP group on 2022 (10 years target plan.). In November 14., 2010 , the leaders of the nine Trans-Pacific Partnership countries-Australia, Brunei Darussalam, Chile, Malaysia, New Zealand, Peru, Singapore, Japan, Vietnam and the United States- announced the achievement of the broad outlines of an ambition, 21st-century Trans-Pacific Partnership (TPP) agreement that will enhance trade and investment among the TPP partner countries, economic growth and development, and support the creation and retention of jobs. President Obama along with the other eight TPP leaders agreed to seek to finalize an agreement in the coming year. (www.ustr.gov/tpp). 14.
(24) TPP Leaders at the APEC Summit in Japan, 2010, photo credit to Gobierno de Chile. The main content on TPP members will be achieved the same as Free Trade Agreement (FTA) union countries as North American Free Trade Agreement (NAFTA) or European Union (EU). China, Korea and Japan also signed another agreement to start the FTA negotiation from 2012. Vietnam Government was positively to join the international organization, they signed and ratified on UNFCCC in 1994, then signed Kyoto Protocol in 1997 and ratified in Sep. 25th., 2002, then joined the TPP on 2010. It’s great benefit to be a part of TPP members countries that means Vietnam companies and products could export those TPP members with limited import tax. Of course, those importers are located in well developed countries, must be required the products got a certification on environment concerned process or certificated by the third party as SGS Auditor. It might not request today, but case company believe the manufacturing doing the programs on CSR will be positively influence on Brand equity in the future.. 15.
(25) Thus, we hypothesize positive relation if the manufacturing put some effort to education the emerging countries through the social networked systems on CSR on environmental responsibility will bring the positive result on Brand Equity. Hypothesis 4: CSR activities will positively influence Brand equity in the B2C product.. 2.5 Brand Preference In Vietnam market, different market and group of people has their owned brand preference. Such as; Honda motorcycle got 50% of market share, because their strong brand equity influenced consumer brand preference. With regard to segmentation, targeting, positioning (STP), for instance, point out the marketers judge segments on the basis of appropriateness and ease of implementation. The total population was 88 million till 2011 by The World Bank’s information. (Source: www.tradingeconomise.com l The World Bank). The young generation between 11 years old to 19 years old kids on targeting market population was around 8.5 million. As can be seeing from Figure 3 and Figure 4. (Sourced by:http://www.google.com.vn/search?q.) So, the market size was around US$ 540 million per year, the value was calculated product life out of warranty by 5 years.. 16.
(26) . . Figure 3 Population growing on past 10 years in Vietnam. Figure 4 Population by age and sex in Vietnam. 17.
(27) The case of electrical Bicycle product will be focused the market between 11 years to 19 years kids. Vietnam Government had a laws for limited the junior and senior high school kids to ride a motorcycle to their school, but they allowed to have an electrical bike to school. Because the EB products got a speed limited, it’s not too dangerous on those kids riding. Plus the environment concerned, the motorcycle rider needed to pay the extra Clean Air fee since 2011, the motorcycle manufacturing dropped their sales volume almost 35%-40% at the end of 2011. We set up the targeting on the EB products on young generation, to create a competitive advantage on brand equity then influenced a brand preference in market share. Hypothesis 5: Brand equity is positively relative with brand preference.. 2.6 Purchase intention Consumers use price as an important extrinsic cue and indicator of product quality or benefits. Consumer in Vietnam is willing to spend US$ 7,000 to US$ 7,600 to buy 125 c.c. imported motorcycle from Japan, the same grade bike was made by Japanese manufacturing in Vietnam just cost less US$ 2,000. That means the brand preference will influence the Vietnamese people to pay more money to buy same quality product. Nike has a main supplier in Vietnam to export their orders to worldwide. Nike suppliers still need to buy the raw material from local Vietnam. Although the same material plus the same process, Vietnamese still wants to pay more to get the Nike logo’s shoes. That’s a purchase intention by reliability and trust with and without the Nike logo got some different on consumer mind. Distribution is intensive when products are placed in a large number of stores to cover the market. Consumer will be more satisfied, however, when a product is 18.
(28) available in a great number of stores because they will be offered the product where and when they want it ( Oliver, 1999; Smith 2001). The Dealer distribution intensity will help consumer feel more convenience and satisfy to buy the products from more family brand name. Case company already run their Aluminum wheels owned brand name in Vietnam for 10 years. Through their current dealer could gain the brand preference to purchase intention. Thus, we hypothesize positive relation of brand preference with purchase intention. Hypothesis 6: Brand preference is related positively to purchase intention.. 19.
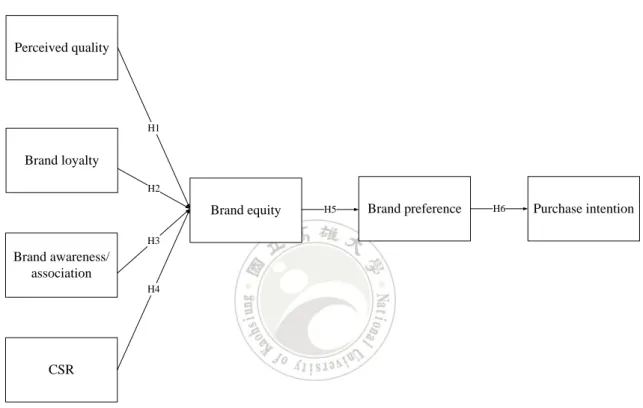
(29) Chapter Three:Research method 3.1 Research framework Our six hypotheses are summarized in Figure3. In the following section we shall confront this model with the empirical data.. Perceived quality. H1. Brand loyalty H2. Brand equity. H5. Brand preference. H3. Brand awareness/ association H4. CSR. Figure 5 The hypothesized model. 20. H6. Purchase intention.
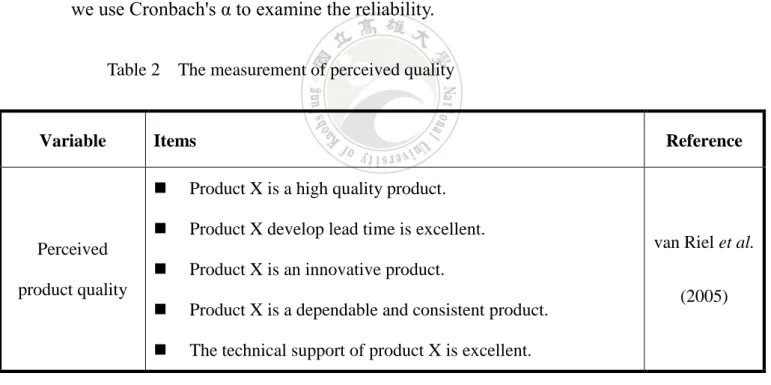
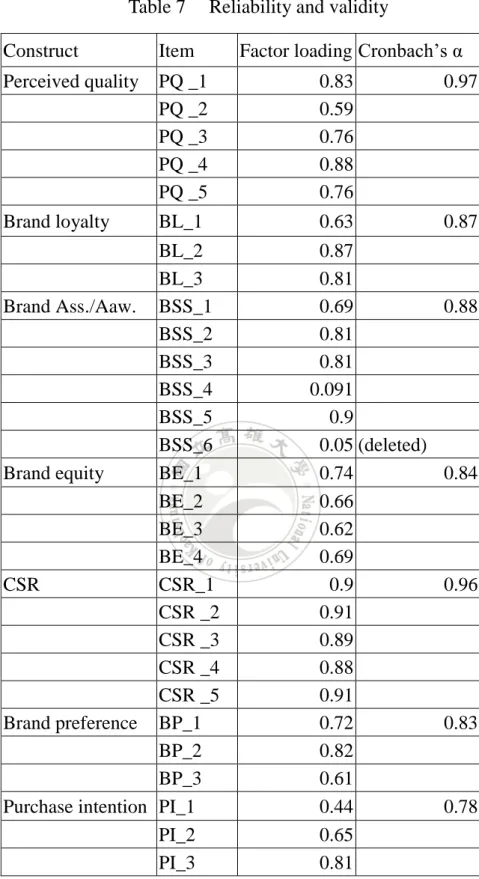
(30) 3.2 Survey procedures and sample As the empirical study of this paper is using data collection, we will use the same way to demonstrate our model. This study collected a total of 40 questionnaires in south of Vietnam. It’s 50% from the bourgeois and 50% from the blue workers. We dedicated on Electrical Bicycle product and asked total 44 questions from the survey forms. A part of the questionnaire content follows. scholars’ subjects. As for the other part, we will based ourselves on theoretical concepts and try to revise them. After discussing with experts and scholars, we can ensure the questionnaire’s reliability and validity. The concept of factor loading value should top 0.4 to make sure components are the same. In the end we use Cronbach's α to examine the reliability. Table 2. Variable. The measurement of perceived quality. Items. Reference. . Product X is a high quality product.. . Product X develop lead time is excellent.. . Product X is an innovative product.. . Product X is a dependable and consistent product.. . The technical support of product X is excellent.. Perceived product quality. 21. van Riel et al. (2005).
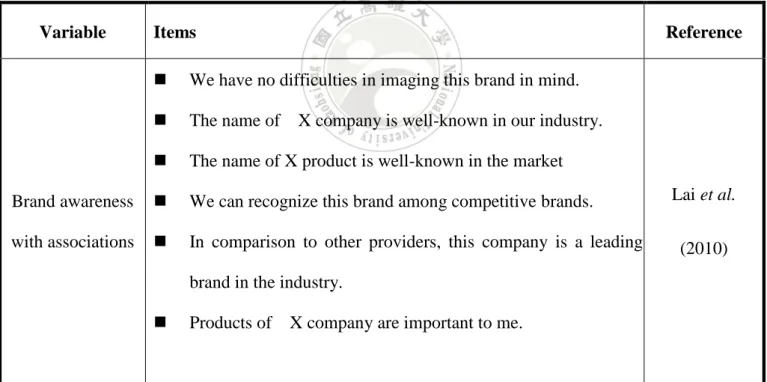
(31) Table 3. Variable. The measurement of brand loyalty. Items. Reference. . If asked, we would recommend Company X.. . We intend to use Product X again in the Future.. . We intend to do business again with Company X in the. van Riel et al.. Brand loyalty (2005). future.. Table 4. Variable. The measurement of brand awareness with associations. Items. Reference. . We have no difficulties in imaging this brand in mind.. . The name of. . The name of X product is well-known in the market. Brand awareness. . We can recognize this brand among competitive brands.. with associations. . In comparison to other providers, this company is a leading. X company is well-known in our industry.. brand in the industry. . Products of. X company are important to me.. 22. Lai et al. (2010).
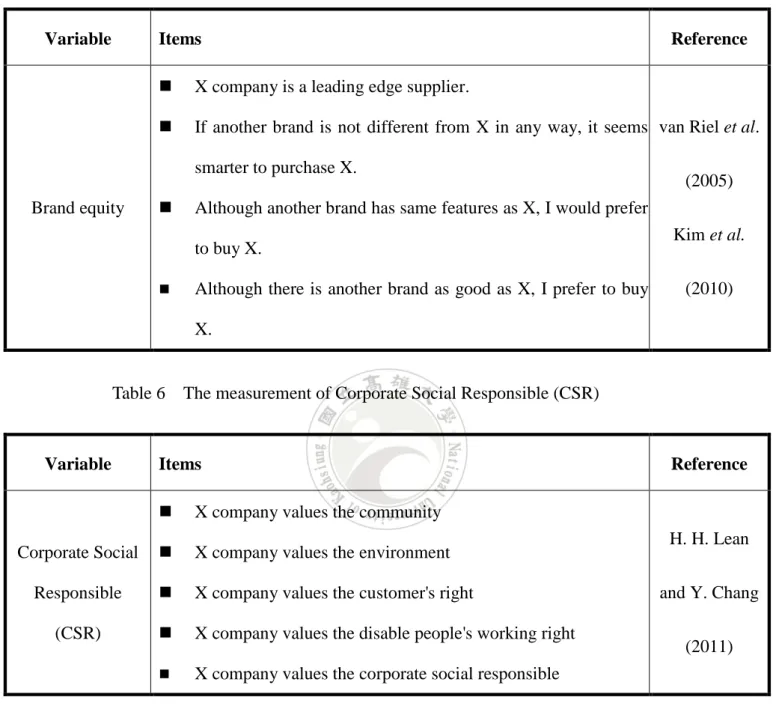
(32) Table 5. Variable. The measurement of brand awareness with associations. Items. Reference. . X company is a leading edge supplier.. . If another brand is not different from X in any way, it seems van Riel et al. smarter to purchase X.. Brand equity. . (2005). Although another brand has same features as X, I would prefer Kim et al.. to buy X. . Although there is another brand as good as X, I prefer to buy. (2010). X.. Table 6. Variable. The measurement of Corporate Social Responsible (CSR). Items. Reference. . X company values the community. Corporate Social. . X company values the environment. Responsible. . X company values the customer's right. (CSR). . X company values the disable people's working right. . X company values the corporate social responsible. 23. H. H. Lean and Y. Chang (2011).
(33) Table 7. Reliability and validity Factor loading Cronbach’s α. Construct. Item. Perceived quality. PQ _1 PQ _2 PQ _3 PQ _4 PQ _5. 0.83 0.59 0.76 0.88 0.76. 0.97. Brand loyalty. BL_1. 0.63. 0.87. BL_2 BL_3 Brand Ass./Aaw. BSS_1 BSS_2 BSS_3 BSS_4 BSS_5 BSS_6 Brand equity BE_1 BE_2 BE_3 BE_4 CSR CSR_1 CSR _2 CSR _3 CSR _4 CSR _5 Brand preference BP_1 BP_2 BP_3 Purchase intention PI_1 PI_2 PI_3. 0.87 0.81 0.69 0.81 0.81 0.091 0.9 0.05 (deleted) 0.74 0.66 0.62 0.69 0.9 0.91 0.89 0.88 0.91 0.72 0.82 0.61 0.44 0.65 0.81. 24. 0.88. 0.84. 0.96. 0.83. 0.78.
(34) 3.3 Methodology This research used partial least square (PLS) to analyze our data. PLS employs a component-based approach for estimation purposes and can handle formative factors, unlike LISREL. PLS places minimal restrictions on measurement scales, sample size, and residual distributions. PLS was thus chosen to accommodate the presence of formative factors and the large number of constructs. PLS has been widely used in social science and marketing in the field of study. PLS can through Bootstrap to expand original sample to obtain more trustworthy result of analysis. PLS also avoids multicollinearity problem to reduce study errors.. 25.
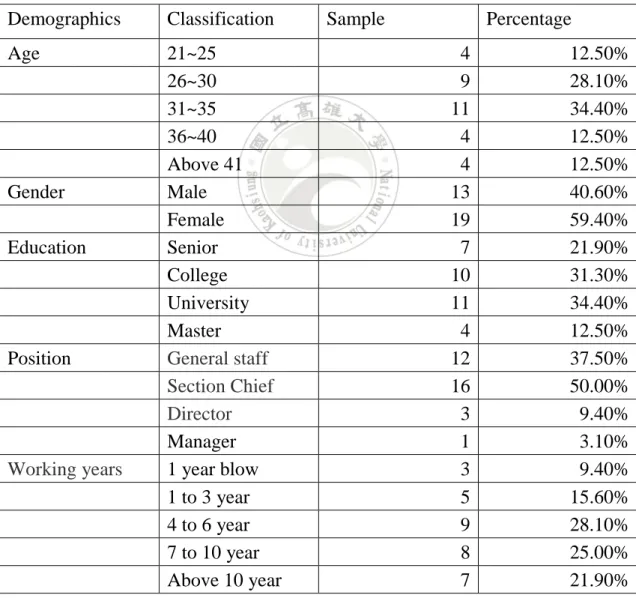
(35) Chapter Four:Empirical Result 4.1. Demographics Demographics of the sample are provided in Table 4-1. Most of respondents are female (59.4%). The main age level is above 26 (59.5%),The main education level is college (38.1%) and university (32.8%). Other detail demographics analysis are shown in Table 8. Table 8 Demographics of sample. Demographics. Classification. Age. 21~25 26~30 31~35 36~40 Above 41 Male Female Senior College University Master General staff Section Chief Director Manager 1 year blow 1 to 3 year 4 to 6 year 7 to 10 year Above 10 year. Gender Education. Position. Working years. Sample. Percentage 4 9 11 4 4 13 19 7 10 11 4 12 16 3 1 3 5 9 8 7. 26. 12.50% 28.10% 34.40% 12.50% 12.50% 40.60% 59.40% 21.90% 31.30% 34.40% 12.50% 37.50% 50.00% 9.40% 3.10% 9.40% 15.60% 28.10% 25.00% 21.90%.
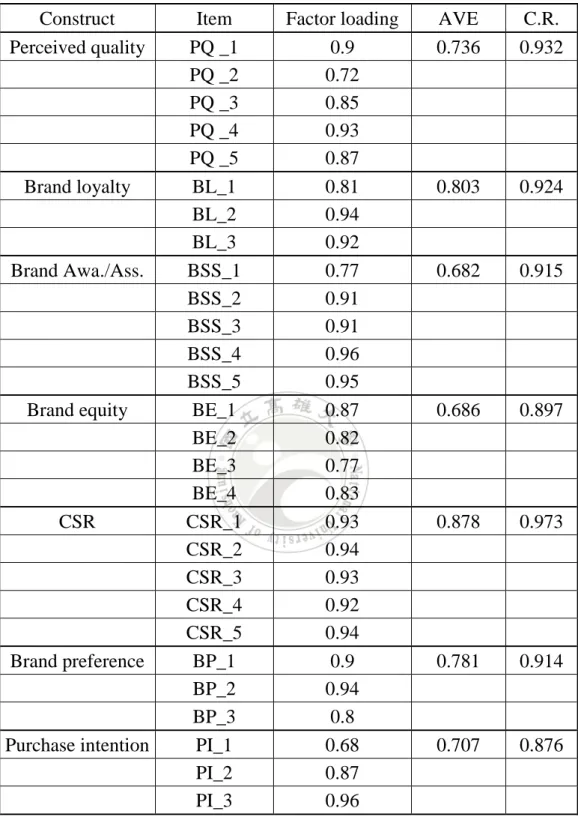
(36) 4.2 Measurement Model Measurement model is an analysis to ensure indicators of each construct actually measure what they are supposed to, by testing validity and reliability of each construct. This article used convergent and discriminant validity to test validity. The convergent validity was assessed by examining construct loading and average variance extracted (AVE). The threshold of AVE has to be higher than 0.5 (Fornell & Larcker, 1981), which indicates good convergent validity. The result of AVE and discriminant validity was examined by comparing the share variance among indicators of each construct with the variance shred between constructs. The criteria of discriminant validity is when square root of AVE for each construct is higher than the squared correlations with other constructs (Fornell & Larcker, 1981). For the reliability of model, this study conducted the test for composite reliability (CR). A high CR value means that the construct is reliable. According to Fornell and Larcker (1981), the standard of CR value has to be higher than 0.6. The result of validity and reliability are shown in Table 4-2 and 4-3, and all values are above the standard values.. 27.
(37) Table 9 Composite reliability and average variable extraction. Construct Perceived quality. Brand loyalty. Brand Awa./Ass.. Brand equity. CSR. Brand preference. Purchase intention. Item PQ _1 PQ _2 PQ _3 PQ _4 PQ _5 BL_1 BL_2 BL_3 BSS_1 BSS_2 BSS_3 BSS_4 BSS_5 BE_1 BE_2 BE_3 BE_4 CSR_1 CSR_2 CSR_3 CSR_4 CSR_5 BP_1 BP_2 BP_3 PI_1 PI_2 PI_3. Factor loading 0.9 0.72 0.85 0.93 0.87 0.81 0.94 0.92 0.77 0.91 0.91 0.96 0.95 0.87 0.82 0.77 0.83 0.93 0.94 0.93 0.92 0.94 0.9 0.94 0.8 0.68 0.87 0.96. 28. AVE 0.736. C.R. 0.932. 0.803. 0.924. 0.682. 0.915. 0.686. 0.897. 0.878. 0.973. 0.781. 0.914. 0.707. 0.876.
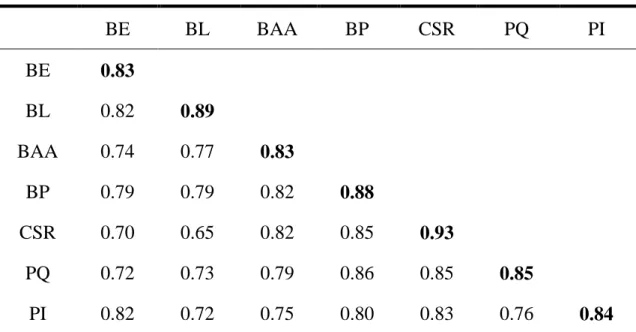
(38) Table 10 Discriminant validity. BE. BL. BAA. BP. CSR. PQ. BE. 0.83. BL. 0.82. 0.89. BAA. 0.74. 0.77. 0.83. BP. 0.79. 0.79. 0.82. 0.88. CSR. 0.70. 0.65. 0.82. 0.85. 0.93. PQ. 0.72. 0.73. 0.79. 0.86. 0.85. 0.85. PI. 0.82. 0.72. 0.75. 0.80. 0.83. 0.76. PI. 0.84. Note:Perceived quality (PQ), Brand loyalty (BL), Brand awareness/association (BAA), Brand equity (BE), Brand preference (BP), Purchase intention (PI), Corporate social responsibility (CSR). Diagonal in boldface values are the roots of AVE value.. 4.3 Structure Structure model is an analysis which used the squared multiple correlation (R2 ) of dependent variable to explanatory power of the model. The standard path coefficient is representing the variable efficient result. High value means high efficient power. This study path coefficient, T-value and R square, are shown in Figure 4. Structure model analyze and result are in Table 9. The study result shows that perceived quality (γ=0.026, t=0.108), brand. 29.
(39) awareness/association (γ=0.005, t=0.190) and CSR (γ=0.246, t=1.125) don’t affect significantly brand equity. Second, brand loyalty has a positive effect on brand equity (γ=0.603, t=2.582): hypothesis 2 is supported. Third, brand equity positively affects brand preference (γ=0.796 t=12.203) hypothesis 5 is supported. Finally brand preference has also a positive effect on purchase intention. ( γ =0.800, t=15.807) 。 The R2. of brand equity is ( R2 = 0.732 ), brand. preference is (R2 = 0.633) and purchase intention is (R2 = 0.640) Thus, this study provides the evidence of good model fit for our sample.. Note:. Significant Insignificant Figure 6 The path coefficient 30.
(40) Table 11 Result of hypothesis testing. Path model. Hypothesis. Path. T-value. Conclusion. coefficient Perceived quality → Brand. H1. 0.026. 0.108. Insignificant. H2. 0.603. 2.582. significant. H3. 0.005. 0.190. Insignificant. CSR → Brand equity. H4. 0.246. 1.125. Insignificant. Brand equity → Brand. H5. 0.796. 12.203. significant. H6. 0.800. 15.807. significant. equity Brand loyalty → Brand equity Brand awareness/association → Brand equity. preference Brand preference → Purchase intention Note: T value > 1.96 (p < 0.05)* T value > 2.576 (p < 0.01)** T value > 3.291 (p < 0.001)***. 31.
(41) 4.4 Discussion The present study of branding in Electric Bicycle industry contributes our understanding of perceived quality, brands loyalty, brand awareness /association and CSR with brand equity on B2C market settings. First, hypotheses H stated the perceived quality would be related to industrial 1. buyer-based brand equity. Results of hypotheses testing didn’t confirm the existence of a significant relationship between perceived product quality and brand equity. This insignificant relationship implies perceived product quality is not the important factor to build the brand equity in customers’ minds especially in electric bicycle industry in Vietnam market. This is a new finding in the literature. One possible explanation for this finding is that although Taiwanese EB companies might provide the equal perceived quality products to their dealer, buyers usually do not return these products and service to their seller to ask for the assistance of services. Second, the results of hypothesis H testing showed that brand equity explained a 2. significant in brand loyalty in the Vietnam Electric Bicycle industry. The possible explanation for this finding is that it is difficult to switch EB product providers for loyal industrial buyers because of technical support preference and long-term maintenance required where as they could not make choices. Due to the Electric Bicycle requires after service on electrical battery change and motor maintenance in Vietnam. The innovative products and after service programs, high tech response by GPS designed networked and efficient make loyal customers satisfied even with paying high price to earn the performance. To stay ahead of the competition, a holistic branding approach is required that covers everything from the development and 32.
(42) design to the implementation of marketing programs, processes, and activities that are intersecting and interdependent (Kotler and Pfoertsch 2007). Third, the results of hypotheses H , the testing didn’t confirm the existence of a 3. significant relationship between Brand awareness with associations and Brand equity. This insignificant relationship implies Brand awareness with associations with Brand equity also show that while the relationship between equity was insignificantly positive as well as between brand preference and purchase intention. These insignificant relationships confirmed the existence of the determinants of brand equity dimension on brand awareness with associations in the case of Electric Bicycle industry in Vietnam. That means the consumer in Vietnam would not take their relative or association opinions, the race psychology in Vietnamese are very self-opinionated and self-righteous. This is a new finding in the literature. One possible explanation for this finding is the population very young in Vietnam, they are follow their direct feeling and very few to take others opinions. Fourth, the results of hypothesis H testing shows that brand equity explained an 4. insignificant in Corporate Social responsibility on environment concerned product with brand equity in the Vietnam EB industry. The possible explanation for this finding is a less education and understanding the impact on global warming knowledge in the most emerging countries. The government on those emerging countries put more effort on economy growing and less attention on their environment and pollution problems. However, Vietnam is a member of ASEAN plus three countries and TPP, those developed countries would request Vietnam follow the international standard on air pollution and reduce the GHG emission. Vietnam government will change their policy to put more serious to request the manufacturing 33.
(43) follow the same as developed countries standard, the CSR will be positively influence in the future. See the hung population as figure 7 and marketing opportunity in Vietnam on their position in ASEAN plus three countries and TPP members maps as Figure 8 as below; (FTA: Free Trade Agreement; TPP: Trans-Pacific Partnership) Country. Population. FTA Region. Brunei Darussalam Cambodia. 401,890 14,805,358. Indonesia. 237,424,363. Laos. 6,500,000. ASEAN plus 3 & TPP ASEAN plus 3 ASEAN plus 3 ASEAN plus 3. Malaysia. 28,334,135. ASEAN plus 3 & TPP. Myanmar. 60,280,000. ASEAN plus 3. Philippines. 92,000,000. ASEAN plus 3. Singapore. 5,183,700. ASEAN plus 3 & TPP. Thailand. 66,247,974. ASEAN plus 3. Vietnam. 91,519,289. ASEAN plus 3 & TPP. China. 1,370,536,875. Korea. 48,875,000. ASEAN plus 3 ASEAN plus 3 & TPP. Japan. 127,380,000. ASEAN plus 3 & TPP. USA. 307,000,000. TPP. Chile. 17,248,450. New Zealand Peru. 4,177,000 29,496,000. Total. TPP TPP TPP. 2,507,410,034. wikipedia.org/wiki. 1.. Figure 7. The Population by ASEAN plus 3 countries and TPP members. 34.
(44) Figure 8 Vietnam becomes a Free Trade Agreement party in ASEAN and TPP. Fifth, the results of hypothesis H testing shows that brand equity explained a 5. significant in brand preference in the Vietnam Electric Bicycle industry. Vietnam was Colonialize by France for 100 years since Sep. 1858. It’s a lot of influence on French life style till today. Vietnamese values the brands、outgoing、sociable and always dressy well …same as French . This is explained our finding that’s brand equity with brand preference is positively relative in consumer mind in Vietnam. It’s also explained why Vietnamese were willing to pay US$ 7,500 to buy 125 C.C. Honda and Piaggio motorcycle bikes on past 3-4 years. willing to pay more to get the good brand name products it is difficult to switch EB product providers for loyal industrial buyers because of technical support preference and long-term maintenance required where as they could not make choices. Due to the Electric Bicycle requires after service on electrical battery change and motor maintenance in Vietnam. Case company provided 35.
(45) the innovative products and after service programs, including the GPS networked designed to get the nearest agent location for any emergency programs and technical support on their Electric Bicycle. To make loyal customers satisfied even with paying high price to earn the performance. Finally, the results of hypothesis H testing shows that brand preference 6. explained a significant relative with purchase intention in the Vietnam Electric Bicycle industry. Vietnamese purchasing behavior as case company past 11 years experienced, the key elements as following, first of all the manufacturers should pay attention on marketing strategy in order to strengthen their products level. Second, Vietnamese consumers take products quality and perceived value into their account before making the buying decision. Therefore, producers should improve brand equity and country image of the products in order to maintain the level of perceived quality and value which attribute to the consumer's purchase intention. Although, we did not find the positively relative on perceived quality with brand equity on our research data, however, it’s difficult to have a long term run on any kind of business staying in the market.. 36.
(46) Chapter Five: Conclusion. 5.1 Conclusion In conclusion from our finding, the case company must invest in advertising, dealer distribution intensity through dealer stores with good images, and reduce frequent use of price promotion. As for price and product, consumer in Vietnam is willing to pay premium price on high brand equity. The previous studies by (Aaker 1991) “building a strong brand, is a successful strategy for different a product from competing brand. Segmentation-Targeting-Positioning related positively to perceived quality with brand equity. The product focus on 11-19 years old young market in Vietnam, the perceived quality with good brand equity got more attention to their priority choice to buy the product. They want to be a proud person and stand up with their friends and colleagues when they owned a good brand name product. The CSR was not bringing a positively relative on brand loyalty with the brand equity. It’s out of our expectation on CSR and environment concerned were not relative on their priority choice to purchasing a product. However, consumer in Vietnam will learn the change from worldwide information very quickly after some time. When they saw the eco-friending product advertising everywhere, they will come to request the same on case company product too.. 37.
(47) 5.2 Suggestion For future research direction suggest as 3 phases as below; First, Vietnam is bordered on the north by China and to the west by Laos and Cambodia. To the east is the South China Sea (called "Eastern Sea" by the Vietnamese). The country's shape and size is often compared to a bamboo pole with loads at the end (north and south). In the central part of the country Vietnam is only 40 kilometers (25 miles) across. The total land area of Vietnam is 329,569 square Km. (127,247 square miles), making it slightly larger than New Mexico. It has a long coast of 3,444 kilometers (2,140 miles). Its 2 major cities are the capital Hanoi in the north and Ho Chi Minh City (formerly Saigon) in the south. The education and networked systems were not cover and popular in country side. It’s still need to put an effort on education and on line training programs on those potential consumers. When people in Vietnam got better understanding the GHG emission problems caused the climate change and nature disaster, they shall and will be willing to buy a product with those valuable on CSR companies in Vietnam. This research did not found a positively relative on CSR with brand equity, we believe the consumer did not get the enough information to understand those impact. The green product might cost a little more expense plus a little inconvenience on their current behaviors. For a long-term point of view, they will know the people health, safety concerned will be improved, the medical care will be reduced the expenses, then people will change their concept to accept green product in their life. Second, another advantage of manufacturing in Vietnam, through the FTA relationship with the TPP members and ASEAN plus three countries, the Vietnamese 38.
(48) companies and FDI have access to those countries. The market size will be more than 2.5 billion population. We believe that needs to be carefully on the marketing strategy and have a long- term plans to invest on CSR activities and environment products developing in Vietnam. From the total population comes with the huge business opportunities in ASEAN plus three countries and TPP members. Vietnam becomes more attractive because of they will be access to another big market by Free Trade Agreement (FTA) very soon. The manufacturing could not avoid to following the CSR and GHG emissions request by their consumer. This finding could provide the continuous to study in the future. Below has enclosed the ASEAN plus three countries and the TPP member population for reference. Third, due to the Government in those emerging countries did not have enough money to improve their public influence structure. The transportation cost a lot of time and expenses to create a new Brand equity in Vietnam today. However, through the relationship and selling to their social network might less than our prospective cost. The brand equity on B2 C market facing another big challenge from YouTube、 MySpace、Linkedin…etc. Those social networked success to bring another concept between the inter-influence on a Brand relative to their Consumer. Manufacturing needs to be very carefully to follow their voices and provided a channel to share their experiences to their social networked. No matter is good or bad image will be linked and delivery to their social networked immediately. The social networked power impacted the dedicated brand, if they did not satisfy one or two consumer’s demand, through the networked systems, just a second by figure touch on their electrical devices, more than hundred thousand people get to know one side story by user only. This is another interested topic to search in the future.. 39.
(49) 5.3 Limitations Although a large number of studies have been made on perceived quality, brand loyalty, product price, Segmentation-Targeting-Positioning, advertising speeding, dealer distribution intensity elated positively with Brand equity. This study is also found the same positively relative on the above elements in the emerging country as Vietnam. However, there are some limitations on our study as below. First, it focused exclusively on a single industrial product as Electrical Bicycle market in Vietnam. Future testing may expand the subject of study to different industries (e.g. motorcycle and car industry) to fully understand the determinants of branding with perceived quality, brand loyalty and CSR activities image with brand equity. Secondly, our study put the effort to collect the questionnaire in the south of Vietnam and did not investigate another area of Vietnam. Future research might need to put their mix of market strategy on 4 Ps and STP analysis including a large sampling from different regions in Vietnam, to provide more reliable and valuable finding in emerging country. Finally, the education and information limited in Vietnam, some consumer was not able to fully understand the green product, electrical bicycle, GHG emission and CSR meaning for. Plus we used the perceptual frame work, not actual measures of marketing activity. It’s really difficult to touch what’s their thinking on the product. The future study could collect data when consumer purchased the product then fill the questionnaire, that result will be closer on what’s their consideration.. 40.
(50) Reference Aaker, D. A. (1991). "Guarding the power of a brand name." New York Times 4(1): 126-135. Aaker, D. A. (1996). "Measuring brand equity across products and markets." California Management Review 38: 102-120. Alan Pomering, Lester W. Johnson. Corporate Communications. Bradford: 2009. Vol. 14, Iss.4; p.420 Alvarez, P. and C. Galera (2001). "Industrial marketing applications of quantum measurement techniques." Industrial Marketing Management 30(1): 13-22. ASEAN plus three countries and TPP member population. checked each countries population from http://www.wikipedia.org/wiki Auh, S. and B. Menguc (2005). "Balancing exploration and exploitation: The moderating role of competitive intensity." Journal of Business Research 58(12): 1652-1661. Baldauf, A., K. S. Cravens, et al. (2009). "The Impact of Product-Country Image and Marketing Efforts on Retailer-Perceived Brand Equity: An Empirical Analysis." Journal of Retailing 85(4): 437-452. Barnett, W. P. (1997). "The Dynamics of Competitive Intensity." Administrative Science Quarterly 42(1). Bendixen, M., K. A. Bukasa, et al. (2004). "Brand equity in the business-to-business market." Industrial Marketing Management 33(5): 371-380. Bennett, R. and S. Rundle-Thiele (2002). "A comparison of attitudinal loyalty measurement approaches." The Journal of Brand Management 9(3): 193-209. Beverland, M. (2005). "Creating value for channel partners: the Cervena case." 41.
(51) Journal of Business & Industrial Marketing 20(3): 127-135. Beverland, M., J. Napoli, et al. (2007). "Industrial global brand leadership: A capabilities view." Industrial Marketing Management 36(8): 1082-1093. Boulding, W., E. Lee, et al. (1994). "Mastering the mix: Do advertising, promotion, and sales force activities lead to differentiation?" Journal of Marketing Research 31(2): 159-172. Caspar, M., A. Hecker, et al. (2002). Markenrelevanz in der Unternehmensfuhrung: Messung, Erklarung und empirische Befunde fur B2B-Markte, Marketing Centrum. Chaudhuri, A. and M. B. Holbrook (2001). "The chain of effects from brand trust and brand affect to brand performance: the role of brand loyalty." The Journal of Marketing 65(2): 81-93. Chay, R. and G. Tellis (1991). "Role of communication and service in building and maintaining brand equity." Managing Brand Equity: 26-27. Chen, M., K. Su, et al. (2007). "Competitive tension: The awareness-motivation-capability perspective." Academy of Management Journal 50(1): 101. Chin, W. W., B. L. Marcolin, et al. (2003). "A partial least squares latent variable modeling approach for measuring interaction effects: Results from a Monte Carlo simulation study and an electronic-mail emotion/adoption study." Information Systems Research 14(2): 189-217. Cretu, A. E. and R. J. Brodie (2007). "The influence of brand image and company reputation where manufacturers market to small firms: A customer value perspective." Industrial Marketing Management 36(2): 230-240 David, A.A. (1996). Measuring Brand Equity across Products & Markets. Califorlina Management review, 38(3), 0-102 Davis, D. F., S. L. Golicic, et al. (2008). "Branding a B2B service: Does a brand differentiate a logistics service provider?" Industrial Marketing Management 37(2): 42.
(52) 218-227. Dess, G. G. and D. W. Beard (1984). "Dimensions of organizational task environments." Administrative Science Quarterly 29(1): 52-73. Dick, A. S. and K. Basu (1994). "Customer loyalty: toward an integrated conceptual framework." Journal of the Academy of Marketing Science 22(2): 99. Dobni, D. and G. M. Zinkhan (1990). "In search of brand image: A foundation analysis." Advances in consumer research 17(1): 110-119. Dorsch, M. J., S. J. Grove, et al. (2000). "Consumer intentions to use a service category." Journal of Services Marketing 14(2): 92-117. Ehrenberg, A. and G. Goodhardt (2000). "New brands: Near-instant loyalty." Journal of Marketing Management 16(6): 607-617. Fornell, C. and D. F. Larcker (1981). "Evaluating structural equation models with unobservable variables and measurement error." Journal of marketing research 18(1): 39-50. Ganesh, J., M. J. Arnold, et al. (2000). "Understanding the customer base of service providers: an examination of the differences between switchers and stayers." Journal of Marketing 64(3): 65-87. Gordon, G. L., R. J. Calantone, et al. (1993). "Brand equity in the business-to-business sector: An exploratory study." Journal of Product & Brand Management 2(3): 4-16. Grönroos, C. (1984). "A service quality model and its marketing implications." European journal of marketing 18(4): 36-44. Hakansson, H. and I. M. P. P. Group (1982). International marketing and purchasing of industrial goods: An interaction approach, Wiley Chichester. Hambrick, D. C. (1983). "Some tests of the effectiveness and functional attributes of Miles and Snow's strategic types." Academy of Management Journal 26(1): 5-26. 43.
(53) Harris, L. C. and C. Ezeh (2008). "Servicescape and loyalty intentions: an empirical investigation." European Journal of Marketing 42(3/4): 390-422. H. H. Lean and Y. Chang*(2011), "Corporate Social Responsibility and Stock Returns -Stochastic Dominance Approach", African Journal of Business Management, forthcoming【SSCI】 Hitt, M. A., R. E. Hoskisson, et al. (2007). Management of strategy: concepts and cases, Thomson/South-Western. Jacoby, J. and R. W. Chestnut (1978). Brand loyalty measurement and management, Wiley New York.. Jaworski, B. J. and A. K. Kohli (1993). "Market orientation: antecedents and consequences." The Journal of marketing 57(3): 53-70. Jaywant Singh, Maria del Mar Garcia de los Salmones Sanchez, Igancio Rodriguez del Bosque. Journal of Business Ethics. Dordrecht: Jul 2008. Vol. 80, Iss. 3; p. 597 Johnson, T. (1984). "The myth of declining brand loyalty." Journal of Advertising Research 24(1): 9-17. Kaur, Maneet, Agrawal, Sudhir (2011) "Corporate Social Responsibility-A tool to create a positive brand image" Vol. 18 Keller, K. L. (1993). "Conceptualizing, measuring, and managing customer-based brand equity." The Journal of Marketing 57(1): 1-22. Keller, K. L. (1998). Strategic brand management: building, measuring and managing, New Jersey: Pearson Prentice Hall. Kim, J. H. and Y. J. Hyun (2010). "A model to investigate the influence of marketing-mix efforts and corporate image on brand equity in the IT software sector." Industrial Marketing Management. 44.
(54) Kim, J. H. and Y. J. Hyun (2011). "A model to investigate the influence of marketing-mix efforts and corporate image on brand equity in the IT software sector." Industrial Marketing Management 40(3): 424-438. Kotler, P. and W. Pfoertsch (2007). "Being known or being one of many: the need for brand management for business-to-business (B2B) companies." Journal of Business & Industrial Marketing 22(6): 357-362. Lai, C. S., C. J. Chiu, et al. (2010). "The Effects of Corporate Social Responsibility on Brand Performance: The Mediating Effect of Industrial Brand Equity and Corporate Reputation." Journal of business ethics: 1-13. Lassar, W., B. Mittal, et al. (1995). "Measuring customer-based brand equity." Journal of Consumer Marketing 12(4): 11-19. Lee, J., S. Y. Park, et al. (2008). "The impact of the brand management system on brand performance in BB and BC environments." Industrial Marketing Management 37(7): 848-855. Lev, B. (2001). Intangibles: Management, measurement, and reporting, Brookings Inst Pr. Lev, B. (2004). "Sharpening the intangibles edge." Harvard business review: 109-118. Lindsay, M. (1990). "Establish brand equity through advertising." Marketing News 24(2): 16. Lohmoller, J. B. (1988). "The PLS program system: Latent variables path analysis with partial least squares estimation." Multivariate Behavioral Research 23(1): 125-127. Low, G. S. and C. W. Lamb Jr (2000). "The measurement and dimensionality of brand associations." Journal of Product & Brand Management 9(6): 350-370. Matsuno, K. and J. T. Mentzer (2000). "The effects of strategy type on the market orientation-performance relationship." Journal of Marketing 64(4): 1-16. 45.
(55) Maxwell, H. (1989). "Serious betting on strong brands." Journal of Advertising Research 29(5): 11-13. McEnally, M. R. and L. De Chernatony (1999). "The evolving nature of branding: Consumer and managerial considerations." Academy of Marketing Science Review 2(1): 1–16. McQuiston, D. H. (2004). "Successful branding of a commodity product: the case of RAEX LASER steel." Industrial Marketing Management 33(4): 345-354. Menguc, B., S. Auh, et al. (2007). "Transformational leadership and market orientation: Implications for the implementation of competitive strategies and business unit performance." Journal of Business Research 60(4): 314-321. Michell, P., J. King, et al. (2001). "Brand values related to industrial products." Industrial Marketing Management 30(5): 415-425. Miles, R. E., C. C. Snow, et al. (1978). "Organizational strategy, structure, and process." Academy of Management Review 3(3): 546-562. Mudambi, S. (2002). "Branding importance in business-to-business markets:: Three buyer clusters." Industrial Marketing Management 31(6): 525-533. Mudambi, S. M. D., P. Doyle, et al. (1997). "An exploration of branding in industrial markets." Industrial Marketing Management 26(5): 433-446. Oliver, R. L. (1999). "Whence consumer loyalty?" The Journal of Marketing 63: 33-44. Patterson, P. G., L. W. Johnson, et al. (1997). "Modeling the determinants of customer satisfaction for business-to-business professional services." Journal of the Academy of Marketing Science 25(1): 4-17. Raju, J. S., V. Srinivasan, et al. (1990). "The effects of brand loyalty on competitive price promotional strategies." Management Science 36(3): 276-304.. 46.
(56) Rauyruen, P. and K. E. Miller (2007). "Relationship quality as a predictor of B2B customer loyalty." Journal of Business Research 60(1): 21-31. Russell-Bennett, R., C. E. J. Hartel, et al. (2005). "Experience as a moderator of involvement and satisfaction on brand loyalty in a business-to-business setting." Industrial Marketing Management 34(1): 97-107. Russell-Bennett, R., J. R. McColl-Kennedy, et al. (2007). "Involvement, satisfaction, and brand loyalty in a small business services setting." Journal of Business Research 60(12): 1253-1260. Shen, C. H.* and Y. Chang (2011), "Corporate Social Responsibility, Financial Performance and Selection Bias-Evidence from TWSE-listed Banks of Taiwan", Chapter 28 at International Research Handbook for Banking and Governance, Barth, J. R., C. Lin. and C. Wihlborg (Eds.), Edward Elgar Publishing, forthcoming. Shimp, T. A. and A. S. Terence (1997). Advertising, promotion & supplemental aspects of integrated marketing communications, Dryden Press. Shortell, S. M. and E. J. Zajac (1990). "Perceptual and archival measures of Miles and Snow's strategic types: A comprehensive assessment of reliability and validity." The Academy of Management Journal 33(4): 817-832.. Smith, K. G., W. J. Ferrier, et al. (2001). "Competitive dynamics research: Critique and future directions." The Blackwell handbook of strategic management: 315-361. Steenkamp, J., V. R. Nijs, et al. (2002). "Competitive reactions and the cross-sales effects of advertising and promotion." ERIM Report Series Reference (ERS-2002-20-MKT). Steenkamp, J., V. R. Nijs, et al. (2005). "Competitive reactions to advertising and promotion attacks." Marketing Science 24(1): 35-54. Tho D. Nguyen, Nigel J. Barrett, Kenneth E. Miller, (2011) "Brand loyalty in emerging markets", Marketing Intelligence & Planning, Vol. 29 Iss: 3, pp.222 – 232 TPP Leaders at the APEC Summit in Japan, 2010, photo credit to Gobierno de Chile 47.
(57) (www.ustr.gov/tpp) Vassileva, B. (2001), CSR -Corporate Banding Relationship. University of Economics-Vama van Riel, A. C. R., C. Pahud de Mortanges, et al. (2005). "Marketing antecedents of industrial brand equity: An empirical investigation in specialty chemicals." Industrial Marketing Management 34(8): 841-847. Vu Ba Phu, deputy head of the authority. "If the quantity of Vietnamese bicycles exported to the EU increases suddenly, it is likely that the EU will again impose an anti-dumping tariff on Vietnamese bicycles," ( http://www.dtinews.vn/en/news/018/3979/ministry-warns-bicycle-makers.html) Washburn, J. H. and R. E. Plank (2002). "Measuring brand equity: an evaluation of a consumer-based brand equity scale." Journal of Marketing 47. Webster, F. E. and K. L. Keller (2004). "A roadmap for branding in industrial markets." The Journal of Brand Management 11(5): 388-402. Yoo, B. and N. Donthu (2001). "Developing and validating a multidimensional consumer-based brand equity scale." Journal of Business Research 52(1): 1-14. Yoo, B., N. Donthu, et al. (2000). "An examination of selected marketing mix elements and brand equity." Journal of the Academy of Marketing Science 28(2): 195. Zahra Jeffrey, G. and A. Shaker (1995). "Contextual influences on the corporate entrepreneurship-performance relationship: A longitudinal analysis." Journal of Business Venturing 10(1): 43-58.. Vietnam - Location and size, Population, Fishing, Forestry, Manufacturing, Electricity, Mining http://www.nationsencyclopedia.com/economies/Asia-and-the-Pacific/Vietna m.html#ixzz1vHF6vlGL. 48.
數據
+7
相關文件
firefly fire(火光) + fly(蒼蠅) 螢火蟲 footnote foot(足) + note(註) 註腳 bicycle bi(兩個) + cycle(圓) 腳踏車 triangle tri(三個) + angle(角)
本文將就俄羅斯養豬 產業高達 業、肉豬市場 概況進行探討 況進行探討 , 並就台灣豬肉 產業高達 品拓展俄羅斯市場之優劣勢與可行作法 提出建議,以作
最新的權威性的美國市調公司─鮑爾市場研究公司 J.D.Power. 1)
書婷與芸樺分別在長度為55公里筆直自行車道的兩端相向而行,已知
原因: 技術進步,加上對可攜帶音樂設備的需求增加(黑膠唱片 > 錄音帶 > CD- ROM > 迷你光碟 > SD咭 >
1970 年代末期至 1995 年:許多農業生技公司開始投入研發以迄 1995 年第 一個產品上市。Monsanto 為此時期最早的投資者,且為第一個將農業生技產 品上市的公司,其他如 Syngenta 與
銷臺重點產品:銅及銅合金(58%)、銅礦 石及其精砂(15%)、蘇打、冷凍魚、蘋果
在這樣的趨勢下,除了既有電商發展成熟地區外,近年快速發展的東南亞,也將成為
