Psychiatrists' caseload volume, length of stay and mental healthcare
readmission rates: A three-year population-based study
Herng-Ching Lin
a,⁎
, Hsin-Chien Lee
ba
School of Health Care Administration, Taipei Medical University, 250 Wu-Hsing St., Taipei 110, Taiwan
bDepartment of Psychiatry, Taipei Medical University and Hospital, 252 Wu-Hsing St., Taipei 110, Taiwan
Received 28 March 2007; received in revised form 2 November 2007; accepted 9 November 2007
Abstract
This study aimed to compare psychiatrists' in-patient caseload volume with length of stay (LOS) and 30-day readmission rates in Taiwan. We hypothesized that high-volume psychiatrists would be associated with shorter LOS and lower 30-day readmission rates. The sample of 66,959 patients hospitalized for the first time for mental disorders was taken from Taiwan's 2001–2003 National Health Insurance Research Database and categorized into four patient groups according to attending psychiatrists' caseload volume. A total of 21,669 (32.4%) of the patients sampled were readmitted within a 30-day period, with the mean LOS being 24.0 (± 19.5) days. As caseload volume increased, there was a corresponding increase in the adjusted odds ratio for 30-day readmission rates. The regression analysis reveals adjusted LOS for patients treated by psychiatrists with medium caseload volumes was 1.22 days shorter than that for patients treated by low caseload volume psychiatrists. The adjusted LOS for patients seeing high caseload volume psychiatrists was 2.03 days shorter than for those seeing psychiatrists with low caseload volumes; and for the very-high-volume group, it was 7.59 days shorter. Although the findings confirm our hypothesis regarding LOS, they do not support our hypothesis regarding the relationship between psychiatrists' caseload volume and readmission rates.
© 2007 Elsevier Ireland Ltd. All rights reserved.
Keywords: Volume–outcome relationship; Readmission rates; Length of stay
1. Introduction
Since the late 1970s, numerous studies have attempted to investigate the association between physi-cian or hospital patient volume and outcomes of particular procedures or of particular medical condi-tions. An overwhelming majority of these studies have reported that treatment outcomes are better in hospitals where these procedures are performed in greater
numbers, or where the appropriate conditions prevail (Nguyen et al., 2004; Rasmussen et al., 2005; Shah et al., 2005; Harling et al., 2005).
Based upon the volume–outcome relationship, a body of research has emerged recommending feasible policies, such as regionalized or centralized programs, in an attempt to reduce preventable mortalities ( Birk-meyer et al., 1999; Epstein, 2002). However, most major discoveries relating to the volume–outcome relationship have tended to come in the fields of cancer, cardiovas-cular or peripheral vascardiovas-cular operations; virtually no studies have focused on healthcare provider case volumes and health outcomes for mental health patients.
Psychiatry Research 166 (2009) 15–23
www.elsevier.com/locate/psychres
⁎ Corresponding author. Tel.: +886 2 2776 1661x3613; fax: +886 2 2378 9788.
E-mail address:henry11111@tmu.edu.tw(H.-C. Lin).
0165-1781/$ - see front matter © 2007 Elsevier Ireland Ltd. All rights reserved. doi:10.1016/j.psychres.2007.11.011
To our knowledge, only one published study has attempted to explore the relationship between caseload volume and mental healthcare outcomes. Using 1999 data on 384 health maintenance organizations in the US, Druss et al.(2004) found that the performance of psychiatrists in the lowest quartile of in-patient and out-patient caseload volumes was poorer than that of their counterparts in other groups, in terms of plans for provider measures of outcomes for antidepressant treatment, as well as having adequate 7-day and 30-day follow-ups. However, that particular study focused only on plan level, rather than provider level, limiting clinicians and policymakers alike to provider-level strategies for optimizing patient outcomes for mental disorders.
To date, therefore, the volume–outcome relationship in mental healthcare remains under-investigated. As a result, this study sets out to compare 30-day readmission rates and length of stay (LOS) with psychiatrists' caseload volume for in-patient mental healthcare, using 3-year nationwide population-based data on Taiwan covering the period from 2001 to 2003.
The main reason for selecting psychiatrist volume, as opposed to hospital volume, in this study is that many of many of the prior studies have consistently reported not only that physician volume is a much more significant factor than hospital volume with regard to predicting patient outcomes, but also that hospital volume is only marginally related to patient outcomes (Hannan et al., 2003; Lien et al., 2007). In line with much of the existing medical and surgical literature, in this study we hypothesize that psychiatrists with high-volume practices will be associated with shorter LOS and lower 30-day readmission rates for mental health patients.
2. Research methods 2.1. Database
The patient sample was taken from the Taiwan 2001– 2003 National Health Insurance Research Database (NHIRD), which covers all in-patient claims for the island's population of over 23 million people. The NHIRD database includes a registry of contracted medical facilities, a registry of board-certified psy-chiatrists, a monthly claims summary for all in-patient claims, and details of all in-patient orders and ex-penditure on prescriptions dispensed at contracted phar-macies. Given its provision of ICD-9CM codes for the primary diagnosis, and up to four secondary diagnos-tic codes, the NHIRD is possibly the largest and most
comprehensive population-based data source currently available anywhere.
2.2. Study sample
All patients admitted to the psychiatric departments of hospitals in Taiwan between January 2001 and De-cember 2003 were selected from the dataset as our study sample. The dataset contained almost 8.5 million in-patient records coinciding with the period of this study, of which 224,014 involved admissions to hospital psy-chiatric departments for acute care for mental disorders. Our sample was limited to first-time hospitalizations between 2001 and 2003, with a principal diagnosis of mental disorder (n = 73,585). Those patients who died during their period of hospitalization (n = 45), those who were discharged against medical advice (n = 5195) and those who were transferred to other hospitals (n = 1422) were all excluded from the study sample. Ultimately, we were left with a sample of 66,959 eli-gible hospitalizations for mental disorders during the period of the study.
2.3. Hospital volume groups
Since unique psychiatrist identifiers are available against each claim within the NHIRD, we are able to calculate the total in-patient mental healthcare volume for each psychiatrist over the 3-year study period. Remaining consistent with the methodology adopted in the prior studies (Birkmeyer et al., 2002; Goodney et al., 2003), we take the total number of mental health hos-pitalizations by a given psychiatrist as the ‘psychiatrist volume’.
All psychiatrists are sorted by their total mental healthcare volume, in ascending order, with cutoff points subsequently being selected that would most closely sort the sample patients into four approximately equal groups. This sorting method is also consistent with the methodology used in many of the prior stud-ies (Birkmeyer et al., 2002; Goodney et al., 2003). The four quartiles are referred to in this study as ‘low-volume (≤328 hospitalizations)’, ‘medium-‘low-volume (329–530 hospitalizations)’, ‘high-volume (531–822 hospitalizations)’ and ‘very-high-volume (≥823 hospi-talizations)’ groups.
2.4. Statistical analysis
The unit of analysis in this study is ‘patient’; the outcome measures are the ‘30-day readmission rate’ and ‘LOS’; and ‘psychiatrist volume’ is measured at
the psychiatrist level. Since it is suggested, in HEDIS 2000, that 30 days provides an appropriate measure of mental healthcare quality– with regard to readmissions for mental disorders– we set out to determine, as a key dependent variable in our study, whether or not patients suffering from a schizophrenic disorder were readmitted within a 30-day period (Druss et al., 2002). The SAS statistical package (SAS System for Windows, Version 8.2) was used to undertake the analysis.
After adjusting for psychiatrist, hospital and patient characteristics, logistical regression analysis was per-formed in order to assess the independent association between ‘psychiatrist volume’ and ‘30-day readmis-sion’ rates by type of mental disorders. The types of mental disorders were grouped into ‘schizophrenia’ (ICD-9-CM code 295), ‘major depressive disorder’ (ICD-9-CM code 2962 ad 2963), ‘bipolar disorder’ (ICD-9-CM code 296 — excluding 2962 and 2963), and‘Other mental disorders’. Since prior studies have documented the inverse association between read-mission and LOS (Lin et al., 2006), the variable of “LOS” was controlled for in the analysis. A multiple regression analysis was also employed to assess the adjusted relationship between‘psychiatrist volume’ and ‘LOS’. Generalized estimated equation (GEE) analyses were additionally applied so as to account for any clustering effects amongst sample patients treated by any given psychiatrist; the term‘clustering effects’ re-fers to the likelihood of the similarity of patient out-comes by a given provider, as opposed to the similarity of patient outcomes between different psychiatrists.
This study also controls for psychiatrist, hospital and patient characteristics Psychiatrist characteristics com-prised of‘age (as a surrogate for practice experience)’ and‘gender’. Psychiatrist age was categorized into one of the three groups: ≤40, 41–50 and ≥51 years old. Hospital characteristics included ‘hospital ownership’, defined as ‘public’, ‘private not-for-profit’, or ‘private for-profit’; ‘geographical location’ refers to northern, central, southern or eastern Taiwan; and‘hospital level’ can be either a medical center with ≥500 beds, a regional hospital with 250–499 beds, or a district hospital with 20–249 beds. Hospital level also serves as a proxy for hospital size and technological clinical service capabilities. Patient characteristics controlled for in this study include ‘age’ (≤19, 20–44, 45–64 and ≥65) and ‘gender’.
Hospital teaching status is not included as a variable in this study since all medical centers and regional hospitals in Taiwan are teaching hospitals. A two-sided P value of less than, or equal to, 0.05 was considered to be significant.
3. Results
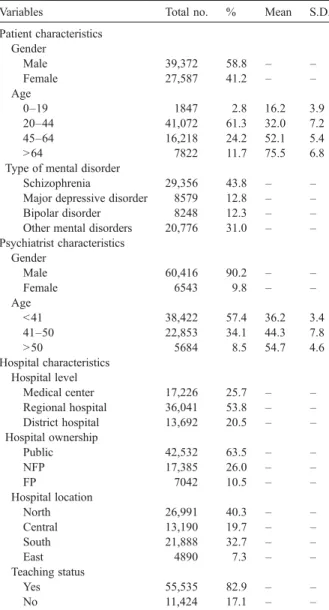
Table 1 presents descriptive analysis of the sam-pled patients, by patient, psychiatrist and hospital char-acteristics. Of the total of 66,959 first-time hospi-talizations for a mental disorder in Taiwan during the 2001–2003 period, 21,669 (32.4%) were readmitted within a 30-day period, with the mean LOS being 24.0 (±19.5) days. As for the type of mental disorder, 29,356 (43.8%) were hospitalized for schizophrenia, 8579 for a major depressive disorder, 8242 (12.3%) for bipolar disorder, and 20,776 (31.0%) in the category of‘Other mental disorders’, including diagnoses such as
obses-Table 1
Descriptive analysis of first-time hospitalizations for mental disorders in Taiwan, 2001–2003 ⁎
Variables Total no. % Mean S.D. Patient characteristics Gender Male 39,372 58.8 – – Female 27,587 41.2 – – Age 0–19 1847 2.8 16.2 3.9 20–44 41,072 61.3 32.0 7.2 45–64 16,218 24.2 52.1 5.4 N64 7822 11.7 75.5 6.8 Type of mental disorder
Schizophrenia 29,356 43.8 – – Major depressive disorder 8579 12.8 – – Bipolar disorder 8248 12.3 – – Other mental disorders 20,776 31.0 – – Psychiatrist characteristics Gender Male 60,416 90.2 – – Female 6543 9.8 – – Age b41 38,422 57.4 36.2 3.4 41–50 22,853 34.1 44.3 7.8 N50 5684 8.5 54.7 4.6 Hospital characteristics Hospital level Medical center 17,226 25.7 – – Regional hospital 36,041 53.8 – – District hospital 13,692 20.5 – – Hospital ownership Public 42,532 63.5 – – NFP 17,385 26.0 – – FP 7042 10.5 – – Hospital location North 26,991 40.3 – – Central 13,190 19.7 – – South 21,888 32.7 – – East 4890 7.3 – – Teaching status Yes 55,535 82.9 – – No 11,424 17.1 – – Note: ⁎n = 66,959.
sive–compulsive disorder, neurotic depression, un-specified psychosis, and so on. The mean age of the sampled patients was 41.5 years, while the mean age of the attending psychiatrists was 40.6 years.
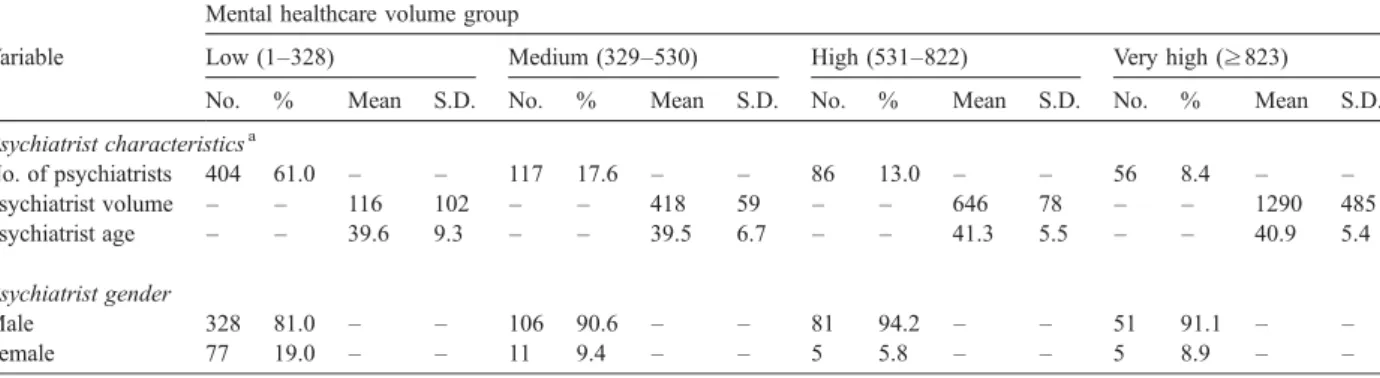
The psychiatrist characteristics are summarized in
Table 2, by psychiatrist caseload volume group. As the Table shows, between 2001 and 2003, patients suffering from mental disorders were admitted into hospitals by a total of 664 psychiatrists, with a mean volume of 331 (± 383) hospitalizations per psychiatrist for the three year period. Of these, 404 (61.0%) psychiatrists were in the low-volume group, with ≤328 hospitalizations; a further 117 (17.6%) psychiatrists were in the medium-volume group, with 329–530 hospitalizations; 86 (13.0%) were in the high-volume group, with 531– 822 hospitalizations; and 56 (8.4%) were in the very-high-volume group, with≥823 hospitalizations.
Table 3provides in detail the estimated crude odds ratio of the likelihood of re-hospitalization within 30 days, by psychiatrist caseload volume groups and by type of mental disorder. The 30-day readmission rate generally increased with increasing caseload volume (Pb0.001); patients treated by low-, medium-, high- and very-high-volume psychiatrists had 27.5%, 24.9%, 30.8%, 46.4% 30-day readmission rates, respectively.
Table 3 also shows that the 30-day readmission rate consistently increased with increasing caseload volume without regard to different types of mental disorders.
Details of the unadjusted relationship between LOS and psychiatrist volume groups according to the type of mental disorder are presented inTable 4. The mean LOS was 25.9 days for patients in the low-volume caseload group; 25.2 days for those in both the medium-volume and high-volume groups; and 19 days for patients in the very-high-volume psychiatrist caseload group. In addi-tion, the one-way ANOVA tests consistently
demon-strated a significant relationship between psychiatrist caseload groups and the LOS for patients hospitalized for mental disorders, regardless of type of mental dis-order (all Pb0.001).
Table 5 describes the adjusted odds ratio of read-mission within a 30-day period, by psychiatrist case-load volume group for different types of mental disorder. As the Table shows, with increasing psychiatrist case-load volume, there is, for the most part, a correspond-ing increase in the adjusted odds ratio of readmission within 30 days in total and separately for all types of mental disorders. For example, after adjusting for hos-pital, patient and psychiatrist characteristics, the odds of readmissions for those patients in the low-volume case-load group were 0.90 times those of the high-volume caseload group (a reciprocal of 1.11) and 0.50 times those of the very-high-volume psychiatrist caseload group (a reciprocal of 2.00) among all sampled patients without regard to type of illness. However, contrary to our expectations, our findings indicate decreasing odds of 30-day readmission for patients in the medium-volume psychiatrist caseload group. With the exception of the widening of the confidence intervals, when these results are adjusted for clustering effects by GEE, all of the significant relationships remain.
The results of the multiple regression analysis are presented inTable 6, which shows that, after adjusting for patient, psychiatrist and hospital characteristics, the LOS was 1.22 days shorter for patients treated by the medium caseload volume psychiatrist group as com-pared to patients attended by psychiatrists in the low-volume group. It was 2.03 days shorter for those treated by the high caseload volume psychiatrists and 7.59 days shorter for those treated by the very-high-caseload volume psychiatrist group (all Pb0.001), without re-gard to type of mental illness. Similarly, the relationship
Table 2
Psychiatrist and patient characteristics, by mental healthcare volume groups, 2001–2003 Mental healthcare volume group
Variable Low (1–328) Medium (329–530) High (531–822) Very high (≥823) No. % Mean S.D. No. % Mean S.D. No. % Mean S.D. No. % Mean S.D. Psychiatrist characteristicsa No. of psychiatrists 404 61.0 – – 117 17.6 – – 86 13.0 – – 56 8.4 – – Psychiatrist volume – – 116 102 – – 418 59 – – 646 78 – – 1290 485 Psychiatrist age – – 39.6 9.3 – – 39.5 6.7 – – 41.3 5.5 – – 40.9 5.4 Psychiatrist gender Male 328 81.0 – – 106 90.6 – – 81 94.2 – – 51 91.1 – – Female 77 19.0 – – 11 9.4 – – 5 5.8 – – 5 8.9 – –
between shorter LOS and increasing psychiatrist case-load volume was also observed across all types of mental disorders.
4. Discussion
Although, over the past two decades, a substantial number of surgical and medical healthcare studies have been carried out in an attempt to explain the relationship between LOS and provider volume, these studies have tended to yield inconsistent findings. Some have reported that an increase in provider volume under particular procedures, or under certain conditions, can lead to a reduction in LOS (Lavernia and Guzman, 1995; Jain et al., 2005), whilst others have reported no significant change (Taub et al., 2004; Lyman et al., 2005). One of the main reasons for such inconsistency could be that most of these studies have been heavily reliant upon regional or statewide samples, or
sub-populations of patients, and as such, have failed to de-liver unequivocal conclusions. In addition, these studies have all tended to focus on surgical procedures or medical conditions, which is clearly of little help to psychiatrists or mental healthcare policymakers, in terms of facilitating a good understanding of the relationship between LOS and physician volume in the field of mental healthcare.
The findings of our study are based on a study sample of 66,959 patients hospitalized in Taiwan for a mental disorder, between 2001 and 2003, using a nationwide population-based dataset. Our results show that, after adjusting for hospital, patient and psychiatrist character-istics, there is, for the most part, an association between psychiatrists with higher mental healthcare volume, and both shorter LOS, and higher 30-day readmission rates. As regards the relationship with LOS, the findings con-firm our hypothesis; however, as regards the relationship between psychiatrist volume and readmission rates, our hypothesis is rejected. After adjusting for other factors,
Table 3
Crude odds ratios for 30-day readmissions to hospital, by psychiatrist volume and type of mental disorder, 2001–2003
Psychiatrist volume 30-day readmission OR 95% CI P value Yes No Total no. % Total no. % Total Low 4619 27.5 12,194 72.5 1.00 – – Medium 4164 24.9 12,588 75.1 0.87 0.83–0.92 b0.001 High 5118 30.8 11,516 69.2 1.17 1.12–1.23 b0.001 Very high 7768 46.4 8992 53.7 2.28 2.18–2.39 b0.001 Schizophrenia Low 2901 36.9 4959 63.1 1.00 – – Medium 2552 32.7 5263 67.3 0.83 0.78–0.89 b0.001 High 2905 40.6 4251 59.4 1.17 1.09–1.25 b0.001 Very high 4093 62.7 2432 37.3 2.88 2.69–3.08 b0.001 Major depressive disorder
Low 359 16.3 1839 83.7 1.00 – – Medium 334 14.9 1914 85.1 0.89 0.76–1.05 0.175 High 458 17.7 2111 82.3 1.11 0.96–1.29 0.172 Very high 597 38.2 967 61.8 3.16 2.72–3.68 b0.001 Bipolar disorder Low 444 22.9 1495 77.1 1.00 – – Medium 366 20.3 1437 79.7 0.86 0.73–1.00 0.054 High 527 23.7 1693 76.3 1.05 0.91–1.21 0.523 Very high 1106 48.4 1180 61.6 3.16 2.76–3.61 b0.001 Other mental disorders
Low 915 19.0 3901 81.0 1.00 – – Medium 912 18.7 3974 81.3 0.98 0.88–1.08 0.675 High 1228 26.2 3461 73.8 1.51 1.37–1.67 b0.001 Very high 1972 30.9 4413 69.1 1.91 1.74–2.08 b0.001
Table 4
Unadjusted relationships between psychiatrist volume and length of stay, by one-way ANOVA test
Psychiatrist volume
Length of stay
Total no. Mean S.D. Median Totala Low 16,813 25.9 18.8 22.0 Medium 16,752 25.2 18.7 21.0 High 16,634 25.2 18.0 22.0 Very high 16,760 19.0 17.9 14.0 Schizophreniaa Low 7860 32.3 24.2 29.0 Medium 7815 30.4 19.5 28.0 High 7156 29.2 19.2 27.0 Very high 6525 23.7 20.9 21.0 Major depressive disordera
Low 2198 21.0 16.3 17.0 Medium 2248 20.5 16.3 17.0 High 2569 22.6 16.0 20.0 Very high 1564 16.3 11.6 14.0 Bipolar disordera Low 1939 26.1 20.3 22.0 Medium 1803 24.7 16.9 22.0 High 2220 25.3 16.5 23.0 Very high 2286 23.4 22.2 19.0 Other mental disordersa
Low 4816 20.5 18.7 15.0 Medium 4886 19.0 16.7 14.0 High 4689 20.3 16.4 16.0 Very high 6385 13.4 12.2 10.0
we find a steady decline in LOS with rising psychiatrist mental healthcare volume, with the LOS for patients treated by psychiatrists in the very-high-volume group being only 34% (7.59/22.32) of the LOS of those patients in the low-volume psychiatrist group.
Although the prior literature in this field has pro-posed two possible hypotheses for the volume–out-come relationship – the ‘practice makes perfect’ and ‘selective-referral’ hypotheses (Luft et al., 1979; Luft et al., 1987) – the actual mechanisms contributing to the negative relationship between LOS and psychia-trist mental healthcare volume found in this study re-main unclear.
Under the‘practice makes perfect’ hypothesis, the level of clinical performance achieved by high-volume providers is likely to be relatively higher than that of
low-volume providers, due to their greater levels of skill and experience. Therefore, we may expect high-volume psychiatrists to be able to reduce LOS, as a whole, by providing more efficient and proficient inter-ventions, ranging from psychopharmacology to psy-chotherapy. Further investigations will be necessary in order to identify the specific clinical approaches and techniques which are adopted by high-volume psychiatrists, and which lead to the shortening of the LOS for those patients hospitalized for mental dis-orders; the results of such studies could clearly help low-volume psychiatrists to improve the overall ef-ficiency of their patient healthcare delivery.
The second hypothesis, ‘selective-referral’, suggests that physicians, or indeed patients themselves, will refer to providers who are renowned for shorter LOS; and
Table 5
Adjusted odds ratios for 30-day readmissions to hospital, by psychiatrist volume, 2001–2003 Variable Total OR, 95% CI Type of mental disorder
Schizophrenia OR, 95% CI Major depressive disorder OR, 95% CI Bipolar disorder OR, 95% CI
Other mental disorders OR, 95% CI Psychiatrist volume ≤328 1.00 1.00 1.00 1.00 1.00 329–530 0.91 (0.86–0.96)c 0.90 (0.84–0.96)b 1.12 (0.94–1.33) 0.73 (0.62–0.87)c 1.10 (0.98–1.18) 531–822 1.11 (1.05–1.17)c 1.12 (1.05–1.21)c 1.05 (0.89–1.23) 1.01 (0.75–1.03) 1.38 (1.24–1.53)c ≥823 2.00 (1.89–2.10)c 2.60 (2.41–2.80)c 2.13 (1.78–2.54)c 2.73 (2.33–3.20)c 1.81 (1.63–2.01)c Psychiatrist age b41 1.08 (1.04–1.13)c 1.15 (1.09–1.22)c 1.01 (0.89–1.15) 1.09 (0.97–1.23) 1.14 (1.06–1.23)c 41–50 1.00 1.00 1.00 1.00 1.00 N50 1.09 (1.01–1.17)b 1.35 (1.23–1.49)c 0.65 (0.50–0.85)b 1.34 (1.09–1.63)c 0.77 (0.65–0.90)c Psychiatrist gender Male 0.95 (0.92–1.03) 0.93 (0.91–1.04) 1.00 (0.98–1.04) 0.97 (0.90–1.05) 1.02 (0.96–1.02) Female 1.00 1.00 1.00 1.00 1.00 Hospital level Medical center 0.24 (0.23–0.26)c 0.23 (0.21–0.25)c 0.42 (0.34–0.51)c 0.23 (0.19–0.28)c 0.23 (0.20–0.26)c Regional hospital 0.80 (0.76–0.84)c 0.77 (0.72–0.83)c 1.17 (0.96–1.41) 1.00 (0.85–1.18) 0.75 (0.68–0.84)c District hospital 1.00 1.00 1.00 1.00 1.00 Hospital ownership Public 1.86 (1.73–2.00)c 2.23 (1.04–2.45)c 1.42 (1.06–1.90)a 1.39 (1.10–1.77)b 1.53 (1.32–1.77)c Private for-profit 1.24 (1.15–1.34)c 1.52 (1.38–1.68)c 0.69 (0.50–0.95)a 1.20 (0.94–1.54) 0.99 (0.84–1.16) Private not-for-profit 1.00 1.00 1.00 1.00 1.00 Hospital location Northern 1.00 1.00 1.00 1.00 1.00 Central 0.53 (0.50–0.56)c 0.67 (0.63–0.72)c 0.27 (0.22–0.33)c 0.52 (0.45–0.61)c 0.40 (0.35–0.45)c Southern 0.57 (0.55–0.59)c 0.78 (0.73–0.83)c 0.61 (0.53–0.70)c 0.60 (0.53–0.69)c 0.39 (0.36–0.42)c Eastern 0.55 (0.51–0.59)c 0.88 (0.80–0.98)a 0.30 (0.21–0.43)c 0.21 (0.17–0.27)c 0.34 (0.29–0.40)c Patient gender Male 1.09 (1.05–1.13)c 1.07 (1.01–1.12)a 1.29 (1.14–1.45)c 1.14 (1.03–1.37)a 1.09 (1.01–1.18)a Female 1.00 1.00 1.00 1.00 1.00 Patient age 0–19 1.36 (1.21–1.52)c 0.80 (0.66–0.96)c 1.12 (0.72–1.75) 0.94 (0.69–1.27) 2.02 (1.71–2.37)c 20–44 1.00 1.00 1.00 1.00 1.00 45–64 1.10 (1.05–1.15)c 1.22 (1.16–1.30)c 0.81 (0.70–0.93)b 1.00 (0.89–1.12) 0.88 (0.81–0.97)b N64 1.04 (0.98–1.11) 0.94 (0.83–1.08) 0.89 (0.75–1.04) 0.71 (0.57–0.88)b 0.93 (0.85–1.02) Length of stay 1.00 (1.00–1.00)c 1.00 (1.00–1.00)c 1.00 (0.99–1.01) 1.01 (1.00–1.01)c 1.02 (1.02–1.02)c Note:aPb0.05;bPb0.01;cPb0.001; OR = odds ratio; CI = confidence interval.
who can thus admit more patients. However, this par-ticular hypothesis may be less plausible when it comes to attempting to explain the relationship between LOS and psychiatrist volume under the current healthcare environment in Taiwan. Chinese culture urges sick patients to stay in hospital as long as possible, in order to receive the best professional care available for the patient's own good. In addition, the Taiwan National Health Insurance scheme provides low co-payment for hospitalization, which, in turn, encourages patients to stay in hospital longer than necessary. There is, therefore, a greater likelihood of patients in Taiwan gravitating towards psychiatrists with longer LOS, or better patient outcomes.
Another possible explanation for the observed re-lationship between LOS and psychiatrist mental
health-care volume is the difference in patient characteristics between low-volume and high-volume providers, parti-cularly with regard to the‘severity of illness’; indeed, the study by Lyons et al. also concluded that the severity of a patient's symptoms was an important predictor of readmission (Lyons et al., 1997).
Although this study has controlled for the age and gender of patients, the administrative database adopt-ed for this study is extremely limitadopt-ed, in terms of its ability to account for differences in the severity of patients' mental disorders. Under this scenario, low-volume psychiatrists have a greater tendency to receive more severely-ill patients than high-volume psychia-trists, which ultimately results in a longer LOS. We therefore suggest the initiation of further survey re-search, in order to provide a better understanding of the
Table 6
Multiple regression analysis for adjusted relationship between length of stay and psychiatrist volume, 2001–2003 Variable Totalβ (S.E.) Type of mental disorder
Schizophrenia β (S.E.)
Major depressive disorder β (S.E.)
Bipolar disorder β (S.E.)
Other mental disorders β (S.E.) Psychiatrist volume ≤328 – – – – – 329–530 (no=0) −1.22 (0.20)c −2.40 (0.34)c −0.35 (0.47) −0.85 (0.60) −1.10 (0.32)c 531–822 (no=0) −2.03 (0.21)c −3.69 (0.35)c −0.38 (0.46) −2.03 (0.58)c −1.62 (0.33)c ≥823 (no=0) −7.59 (0.22)c −9.70 (0.37)c −6.90 (0.55)c −6.86 (0.63)c −7.04 (0.33)c Psychiatrist age b41 (no=0) −2.25 (0.16)c −3.43 (0.27)c −1.03 (0.37)b −1.38 (0.45)b −1.43 (0.24)c 41–50 – – – – – N50 (no=0) −0.22 (0.28) −0.30 (0.27) −0.49 (0.65) 1.02 (0.75) −0.96 (0.43)a Psychiatrist gender Male (no = 0) −1.12 (0.25)c −1.30 (0.22)c −1.02 (0.33) −1.05 (0.38) −1.11 (0.37) Female – – – – – Hospital level
Medical center (no = 0) −0.38 (0.25) 2.77 (0.43)c 2.75 (0.61)c −1.58 (0.70)a −4.35 (0.40)c Regional hospital (no = 0) −2.30 (0.22)c 0.06 (0.35) 0.63 (0.58) −3.40 (0.65)c −4.87 (0.35)c
District hospital – – – – –
Hospital ownership
Public (no = 0) 1.39 (0.29)c −0.34 (0.46) 5.10 (0.80)c 4.53 (0.93)c 1.29 (0.46)b Private for-profit (no = 0) −2.01 (0.31)c −2.99 (0.49)c −0.11 (0.84) −0.04 (0.96) −2.04 (0.50)c
Private not-for-profit – – – – – Hospital location Northern – – – – – Central (no = 0) 4.02 (0.21)c 5.90 (0.34)c 1.98 (0.49)c 3.71 (0.57)c 0.69 (0.34)a Southern (no = 0) −0.19 (0.17) 0.88 (0.31)b −0.55 (0.39) −0.15 (0.52) −2.15 (0.26)c Eastern (no = 0) 4.62 (0.30)c 0.29 (0.51) 8.22 (0.83)c 11.78 (0.82)c 5.50 (0.45)c Patient gender Male (no = 0) 0.78 (0.15)c −0.76 (0.25)b 2.76 (0.34)c 1.08 (0.40)b 1.71 (0.24)c Female – – – – – Patient age 0–19 (no=0) 0.45 (0.44) −3.75 (0.88)c −0.48 (1.25) −2.95 (1.16)a 5.08 (0.55)c 20–44 – – – – – 45–64 (no=0) 0.27 (0.17) 0.06 (0.29) 1.81 (0.39)b −1.00 (0.46)a 1.71 (0.29)c N64 (no=0) 1.72 (0.24)c −1.39 (0.67)a 3.74 (0.47)c −2.03 (0.79)a 3.15 (0.28)c Constant 22.32 (0.42)c 34.09 (0.53)c 14.94 (0.90)c 25.49 (0.98)c 5.08 (0.55)c Note:β = parameter estimates; S.E. = standard erroraPb0.05;bPb0.01;cPb0.001.
distribution of patients hospitalized for mental dis-orders between low-volume and high-volume groups, specifically in terms of their‘severity of illness’.
This study finds that, in general, patients treated by high-volume psychiatrists have higher odds of being readmitted within a 30-day period. More specifically, the odds of patients treated by very-high-volume psychia-trists being readmitted with 30 days are twice those of patients treated by low-volume psychiatrists. This find-ing comes in light of the conclusions of an earlier study byMarcin and Romano (2004), which used data from 39 non-federal Californian hospitals, and which found that non-elderly adult trauma patients were more likely to be readmitted after being initially admitted to hospitals with a higher annual volume of trauma cases.
Greater technical proficiency borne of specialization and clinical experience is presumed to underlie the as-sociation between practice volume and outcome in oth-er fields of medicine. In psychiatric practice, howevoth-er, greater practice volume may be linked to larger case loads that may paradoxically degrade rather improve clinical care as psychiatrists have less time to assess and consider each individual case. However, we must urge caution before any attempt is made to derive policy decisions from the findings of this study; although the readmission rate is regarded as an appropriate indicator of in-patient healthcare outcomes for various medical conditions, it may not be quite so valid when applied to the field of mental healthcare. Indeed, as Lyons et al. (1997)reported, a readmission may not necessarily be an indicator of the poor outcome of a psychiatric hospital stay, and indeed, it may only represent a specific function of hospital admission policy, or a low hospitalization threshold. Furthermore, although this study has found that higher mental healthcare volume is associated with both a shorter LOS and a higher readmission rate, we cannot conclude that the reduction in LOS which is apparent amongst high-volume psychiatrists, was achieved at the expense of increased readmission rates. We suggest that a longitudinal follow-up study should be undertaken in order to investigate the relationship bet-ween LOS and readmission rates for both high-volume and low-volume providers.
A particular strength of this study is the use of a population-based dataset which allows us to trace all readmissions, even the readmission of patients to different psychiatrists. Nevertheless, we should make note of two limitations inherent within this study. First of all, the prior studies have reported that certain patient-specific factors, such as difficulties in self-care, severity of symptoms and residential instability, are important predictors of read-mission, and indeed, readmission rates may also reflect
the quality of home healthcare services, as well as local community services and support. Unfortunately, none of this information is available from the NHIRD.
Secondly, although the three-year cross-sectional data does provide a detailed picture of the relationship bet-ween physician volume and LOS and readmissions, in this study, we have been unable to precisely determine the actual causal relationships. The definitive determina-tion of the causal reladetermina-tionships existing between psy-chiatrist volume and LOS and readmission will only be possible under a longitudinal study design. Despite these limitations, this study has found that after adjusting for patient, psychiatrist and hospital characteristics, an inverse volume–outcome relationship does exist for psychiatrists in Taiwan, in terms of the LOS for mental healthcare, but not with regard to 30-day readmission rates. This finding can help policymakers in Taiwan, as well as in other countries, to increase the awareness of the issues surrounding the volume–outcome relationship in mental healthcare.
Since this is one of the first population-based stud-ies to explore the volume–outcome relationship in the field of mental healthcare, the results should be regarded as exploratory rather than definitive, and we suggest that further mental healthcare volume–outcome studies should be initiated in other regions or countries to con-firm the generalizability of our findings. Other countries may find our study results helpful when investigating this topic, since they should help to facilitate cross-country comparisons.
Acknowledgements
This study is based in part on data from the National Health Insurance Research Database provided by the Bureau of National Health Insurance, Department of Health, Taiwan and managed by the National Health Research Institutes. The interpretations and conclusions contained herein do not represent those of the Bureau of National Health Insurance, Department of Health, or the National Health Research Institutes.
References
Birkmeyer, J.D., Lucas, F.L., Wennberg, D.E., 1999. Potential benefits of regionalizing major surgery in Medicare patients. Effective Clinical Practice 2, 277–283.
Birkmeyer, J.D., Siewers, A.E., Finlayson, E.V., Stukel, T.A., Lucas, F.L., Batista, I., Welch, H.G., Wennberg, D.E., 2002. Hospital volume and surgical mortality in the United States. New England Journal of Medicine 346, 1128–1137.
Druss, B.G., Miller, C.L., Pincus, H.A., Shih, S., 2004. The volume– quality relationship of mental health care: does practice make perfect? American Journal of Psychiatry 161, 2282–2286.
Druss, B.G., Miller, C.L., Rosenheck, R.A., Shih, S.C., Bost, J.E., 2002. Mental health care quality under managed care in the United States: a view from the Health Employer Data and Information Set (HEDIS). American Journal of Psychiatry 159, 860–862. Epstein, A.M., 2002. Volume and outcome—it is time to move ahead.
New England Journal of Medicine 346, 1161–1164.
Goodney, P.P., Stukel, T.A., Lucas, F.L., Finlayson, E.V., Birkmeyer, J.D., 2003. Hospital volume, length of stay, and readmission rates in high-risk surgery. Annals of Surgery 238, 161–167. Hannan, E.L., Wu, C., Ryan, T.J., Bennett, E., Culliford, A.T., Gold,
J.P., Hartman, A., Isom, O.W., Jones, R.H., McNeil, B., Rose, E.A., Subramanian, V.A., 2003. Do hospitals and surgeons with higher coronary artery bypass graft surgery volumes still have lower risk-adjusted mortality rates? Circulation 108, 795–801.
Harling, H., Bülow, S., Møller, L.N., Jørgensen, T., Danish Colorectal Cancer Group, 2005. Hospital volume and outcome of rectal cancer surgery in Denmark 1994–99. Colorectal Disease 7, 90–95. Lien, Y.C., Huang, M.T., Lin, H.C., 2007. Association between surgeon and hospital volume and in-hospital fatalities after lung cancer resections: the experience of an Asian country. Annals of Thoracic Surgery 83, 1837–1843.
Jain, N.B., Pietrobon, R., Guller, U., Ahluwalia, A.S., Higgins, L.D., 2005. Influence of provider volume on length of stay, operating room time, and discharge status for rotator cuff repair. Journal of Shoulder and Elbow Surgery 14, 407–413.
Lavernia, C.J., Guzman, J.F., 1995. Relationship of surgical volume to short-term mortality, morbidity, and hospital charges in arthro-plasty. Journal of Arthroplasty 10, 133–140.
Lin, H.C., Tian, W.H., Chen, C.S., Liu, T.C., Tsai, S.Y., Lee, H.C., 2006. The association between readmission rates and length of stay for schizophrenia: a 3-year population-based study. Schizophrenia Research 83, 211–214.
Luft, H.S., Bunker, J.P., Enthoven, A.C., 1979. Should operations be regionalized? The empirical relation between surgical volume and mortality. New England Journal of Medicine 301, 1364–1369. Luft, H.S., Hunt, S.S., Maerki, S.C., 1987. The volume–outcome
relationship: practice-makes-perfect or selective-referral patterns? Health Services Research 22, 157–182.
Lyman, S., Jones, E.C., Bach, P.B., Peterson, M.G., Marx, R.G., 2005. The association between hospital volume and total shoulder ar-throplasty outcomes. Clinical Orthopaedics and Related Research 432, 132–137.
Lyons, J.S., O'Mahoney, M.T., Miller, S.I., Neme, J., Kabat, J., Miller, F., 1997. Predicting readmission to the psychiatric hospital in a managed care environment: implications for quality indicators. American Journal of Psychiatry 154, 337–340.
Marcin, J.P., Romano, P.S., 2004. Impact of between-hospital volume and within-hospital volume on mortality and readmission rates for trauma patients in California. Critical Care Medicine 32, 1477–1483. Nguyen, N.T., Paya, M., Stevens, C.M., Mavandadi, S., Zainabadi, K., Wilson, S.E., 2004. The relationship between hospital volume and outcome in bariatric surgery at academic medical centers. Annals of Surgery 240, 586–593.
Rasmussen, S., Zwisler, A.D., Abildstrom, S.Z., Madsen, J.K., Madsen, M., 2005. Hospital variation in mortality after first acute myocardial infarction in Denmark from 1995 to 2002: lower short-term and 1-year mortality in high-volume and specialized hospitals. Medical Care 43, 970–978.
Shah, S.N., Wainess, R.M., Karunakar, M.A., 2005. Hemiarthroplasty for femoral neck fracture in the elderly surgeon and hospital volume-related outcomes. Journal of Arthroplasty 20, 503–508. Taub, D.A., Miller, D.C., Cowan, J.A., Dimick, J.B., Montie, J.E.,
Wei, J.T., 2004. Impact of surgical volume on mortality and length of stay after nephrectomy. Urology 63, 862–867.