The Costs of Owning Employer Stocks:
Lessons from Taiwan
Yi-Tsung Lee Department of Accounting National Chengchi University
Taipei, Taiwan (886-2) 2939-3091 #81027
Yu-Jane Liu Department of Finance National Chengchi University
Taipei, Taiwan (886-2) 2939-3091 #81123
Ning Zhu
Graduate School of Management University of California, Davis
Davis, CA 95616 (530)752-3871 [email protected] 1
1
Lee and Liu are from National Chengchi University, Taiwan and Zhu is from University of California, Davis. Part of the work was finished when Liu was a Fulbright Scholar at University of California, Berkeley. The authors acknowledge the support from Ler-Ming Su, the director-general of the Data Center, Ministry of Finance, Taiwan, Sandell Research Grant on Retirement from Center for Retirement Research at Boston College, and comments from Brad Barber, Terrance Odean, Richard Roll, Avanidhar Subrahmanyam, and seminar participants at China International Finance Conference (2006), National Cheng-Chi University, and UC Davis. The authors are responsible for all remaining mistakes. The research reported herein was performed pursuant to a grant from the U.S. Social Security Administration funded as part of the Retirement Research Consortium. The opinions and conclusions expressed are solely those of the author(s) and do not represent the opinions or policy of the Social Security Administration or any agency of the Federal Government, or the Center for Retirement Research at Boston College.
The costs of owning employer stocks: Lessons from Taiwan
Using data on all employees at listed companies in Taiwan, where pension plans were rare, we find that the bias toward employer stocks is generic to individual investor decision-making, but not limited to retirement plans. 71 percent of sample employees invest in employer stocks and the employer stocks make up on average 47 percent of employee equity portfolios. The under-diversification resulting from the bias toward employer stocks is highly costly. Holding current portfolio risk constant, employees forego 4.89 percent per annum in raw returns by investing in employer stocks, which represents 39.74 percent of their average 1998 salary income. Our findings have important implications for social security reform and retirement account management. Keywords: employer stock, retirement, pension reform, investor behavior
The costs of owning employer stocks: Lessons from Taiwan
During the past decade, many countries started using investment-based personal retirement accounts (i.e. 401k plans in the U.S.) to supplement or replace the pay-as-you-go pension system (Feldstein 1998, Leone and Anrig 1999). To obtain higher returns and sustain longer life-expectancy, more countries consider allowing investors to hold equities or equity mutual funds, in addition to the traditional fixed-income securities, in their retirement accounts. For example, U.S. investors can hold individual stocks in their 401k plans and IRA accounts; some European countries (Austria, Czech Republic, Germany, and United Kingdom, Herbertsson and Orszag (1999) and Muller, Ryll and Wagener (1999)) started setting looser requirement for how individuals at small pension plans can invest directly in the stock market; Thailand and Malaysia in Asia also consider relaxing the regulations on whether investors can directly hold stocks in their retirement accounts (Asian Development Bank 1998). Popular press, at the same time, has been advocating the tempting returns generated by investing in common stocks with retirement funds (Hardy 1982, and Kehrer 1991), which may attract more individuals to the notion of equity investment for retirement.
If the trend to grant individuals greater autonomy in retirement investment were to spread around the globe, it is imperative for policymakers and plan-holders alike to understand that greater investor autonomy and direct stock investments, which are believed to generate higher returns for retirements on average, could result in higher risks and grave consequences (Benartzi and Thaler 2002).
One particular problem that emerges from the development of private retirement accounts in the U.S. is that participants invest heavily in the stocks of their employers. Such a bias was shown to cause severely under-diversified portfolios that will result in considerable welfare loss over a long investment horizon (Cohen 2005, Huberman and Jiang 2005). Anecdotal evidence from the late 1990s suggests that employees of once successful companies such as Enron and WorldCom lost almost all of their investments in employer stocks, both through brokerage accounts and retirement plans, within a
matter of months, alongside the downfall of the employers (Benartzi et al. 2004, Mitchell and Utkus 2005).
A few gaps need be bridged before existing evidence in the U.S. can be used to advise further pension system reforms around the globe. First, because most U.S. studies focus on retirement plans sponsored by employers (i.e. 401k plans), which are predisposed to encourage employees’ holding employer stocks for retaining corporate control (Bethel et al. 1998, Gordon and Pound 1990, and Rauh 2005), it remains unclear how individuals would invest in their ‘private social security account’, where there is little influence from the employers. Second, existing studies report considerably different results (please refer to Section 2 for a detailed discussion) regarding the magnitude of the problem, depending on the selected samples. This creates challenges for policymakers who look for a takeaway number when designing national-level reforms.
Finally, investors in most developing financial markets do not enjoy the developed mutual fund industry as in the U.S.. According to Khorana et al. (2005), mutual fund industry makes up less than 10 percent of domestic primary securities for 42 of the 56 the surveyed countries, most of which in the emerging markets. The lack of mutual funds conceivably makes investment choice for retirement more challenging and the cost of bias toward employer and under-diversification even higher. Therefore, additional studies on the bias toward employer stocks from markets with limited mutual fund presence will bring important lessons to many countries that face reforms in the pension system.
The current study attempts to fill the above gaps by investigating how the universe of employees at companies listed at the Taiwan Stock Exchange (TSE) treat employer stocks under little influence from institutional factors. Our data have the advantages of studying investors’ attitude toward employer stocks in an emerging market. Taiwanese market is unique in a sense that institutional influences, such as retirement plan design and employer matching, exerted little influence on individuals’ decisions.
Hence, we have the opportunity to investigate how investors treat employer stocks when they are under little influence from their employers.
The lack of alternative retirement plans during the sample period compels the sample individuals to plan their retirement by using at least part of their investment proceeds. We believe that our findings can therefore depict a picture similar to what individuals would do if they were to manage their private retirement or social security accounts, should the pension reform progresses in many countries. Taiwanese investors resemble most individual investors in other developing markets, who have little access to the mutual fund industry. In addition, lessons from Taiwan imply that certain behavioral patterns draw investors to their employer stocks, partly explaining the existing findings that investors in developed countries do not fully take advantage of the diversification offered by mutual funds. (Goetzmann and Kumar 2004, Goetzmann et al. 2004, and Zhu 2005).
The findings therefore highlight the importance of providing well-diversified investment opportunities in social security accounts, should such accounts be ‘privatized’. The development of the mutual fund industry and the financial market overall seems critical to the successful reform of the social security system. Our results hence offer important implications to global pension system reforms and urge policymakers around the world to reconsider relaxing ‘safety net’ requirement for retirement investment, given its possible costly consequences.
Another advantage of the data comes from the fact that we can observe portfolio choices for the entire universe of corporate employees from Taiwan. We can precisely estimate social cost not only at the market level, but also for respective investor segments. If the bias inflicts only some of the employees (i.e. corporate managers who are relatively well off), the problem of investing in employer stocks may not be as grave. However, if it is the rank and file employees, who need the investment most after retirement, that suffer more from the bias, policymakers on social security reform should be particularly alarmed.
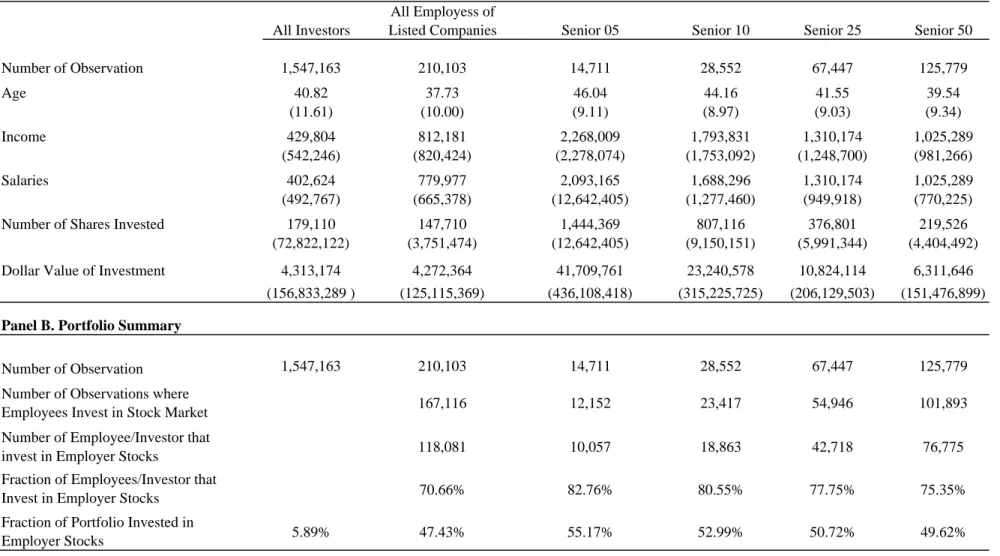
Our findings are easy to summarize. Employees at TSE-listed companies hold a strikingly large proportion of their equity portfolios in employers’ stocks. For all employees at the 442 companies that participate in Taiwan stock market, 71 percent held their own employer’s stocks at the end of 1998. The employer stock makes up an average of 47 percent of the value of the personal portfolios (the median is 42 percent). Although this pattern is particularly strong for senior managers (55 percent), the results are very robust across different segments of employees.
Investor characteristics are important in explaining cross-sectional differences in employees’ tendency to invest in employers. Employees who are older and have higher incomes invest more in employers. Different from the common belief that managers invest heavily in employer stocks, rank and file employees are more susceptible to the bias on the percentage basis. When controlling for other investor characteristics, we find that senior managers indeed invest about 3 percentages less of their portfolios in employer stocks than other employees do. Employees of companies with high book-to-market ratio, larger book-to-market capitalization, and employees at high-tech companies invest more in their employers. Past return and return volatilities also seem to matter to the bias.
Individuals suffer considerably from investing in employers. There is little evidence that individuals gain abnormal returns by investing in local and familiar stocks. Instead, under-diversification resulting from the employer bias exposes individual portfolios to excessive idiosyncratic risks. If employees were to replace the 47 percent of their holdings in employer stocks with the market portfolio, they could obtain a higher return of 4.89 percent per annum, holding constant the current risk level. The foregone investment return in 1998 represents a striking 39.74 of investors’ average annual salary in 1998. With the more conservative estimate for the median employee, the foregone return is still considerable at 11.54percent of the 1998 income. It seems that investors lose considerably not only from active trading (Barber et al. 2005 (a)), but also from holding the wrong portfolios. Over the 27-year horizon before average employee retires, portfolios free from employer bias can generate terminal value that is more than three
times as large as individuals’ observed choices. That is, the bias-free portfolio can sustain retirees three times as long as the observed portfolios, under the same spending pattern.
The rest of the study proceeds as follow: Section 2 reviews related literature; Section 3 describes background in Taiwan stock market and outlines the unique data on individual stock holdings and employment information; Section 4 presents empirical evidence that employees display strong bias toward employer stocks in Taiwan; Section 5 estimates the economic costs caused by the bias before we conclude in Section 6.
2. Related Literature
Scholars have dedicated considerable research to the reform of social security system and the defined contribution plans in the U.S. (Campbell and Feldstein 2001, Feldstein 1998, Feldstein and Siebert 2002). One problem that attracts much recent attention in the U.S. defined contribution plan investment (i.e. 401k plans) is the bias toward employer stocks. Employees hold a large proportion of their retirement plans in employer stocks and incur significant costs by doing so (Benartzi 2001, Cohen 2005, Huberman and Sengmueller 2004). Meulbroek (2003) estimates that employees sacrifice about 42 percent of their retirement account holdings in employer stock due to the higher level of idiosyncratic risks. The under-diversification in equity portfolio is particularly hazardous because individuals usually do not hold diversified portfolios across different asset classes (i.e. stocks, bonds, and real estate etc.)1
Most current studies focus on individuals’ bias toward employer stocks in retirement accounts (Agnew et al. 2001, Cogan and Mitchell 2003, Holden et al. 2000, Huberman et al. 2003, Ramaswamy 2002). Because corporations are motivated to promote employees’ share ownership as ways to defend hostile takeovers and retain
1
Wall Street Journal reports that half of IRA holders with Vanguard Group, a large mutual fund company and IRA custodian, put their entire accounts into stocks. (“Many Savers Failing to Diversify Net Eggs; Only Small Groups Found to be Making Trades, May Suffer ‘Choice Overload’”, Wall Street Journal (Eastern edition), November 28, 2005, Pg. C.9.)
corporate control (Bethel et al. 1998, Gordon and Pound 1990, and Rauh 2005), it seems natural that individuals’ bias toward employer stocks in retirement accounts may at least partly be induced by their companies. Agnew (2002), Benartzi (2001), Brown et al. (2005), Choi et al. (2005), and Huberman and Jiang (2005) all show that plan design, corporate matching policies, and plan default settings significantly influence employees’ attitude toward employer stocks. What remains unclear is, should the social security reform progress further, how individuals will treat employer stocks in their private social security account on which employers would play little roles. Research along this line will provide important policy implications for pension reform not only for the United States, but also for many other countries around the world that consider ‘privatizing’ social security.
If individuals frame retirement and other investment accounts separately, then the under-diversification in retirement accounts may go away if one considers the rest of individual portfolios. If instead, individuals exhibit similar bias towards employer stocks in other discretionary investment accounts (i.e. a private social security account) due to inherent behavioral biases (Barber, Odean and Zhu 2005, Kahneman 2003, and Kahneman and Tversky 1986), such as over-extrapolation (Benartzi 2001), inertia (Choi et al. 2002), and loyalty (Cohen 2005), the problem of investing in employer stocks looms even bigger. Many individuals will run into the hazard of holding severely concentrated retirement portfolios that could jeopardize their livelihood after retirement. Hence, studies on retirement investment where institutional factors play little role are much needed.
Depending on the selected samples, existing studies that examine the magnitude of the bias toward employer stocks generate mixed results. For example, the fraction of retirement plans invested in employer stocks ranges from 16 percent (Holden and VanDerhei 2003) to over 40 percent (Brown et al. 2005, Huberman and Sengmueller 2004) for a similar period of time (See Appendix A for a useful comparison of existing results and how the current study fits in). Although it is completely understandable to have such considerable differences because the bias towards employer stocks depends on
firm characteristics, employee characteristics and corporate policies (Choi et al. 2005, Cohen 2005), future studies and policymakers will have difficulty in drawing reliable conclusions nationwide and determining appropriate policies to curb the adverse impact of such decisions. A thorough investigation of the bias by employees at all TSE-listed companies from Taiwan can bridge this gap and yield a reliable estimate for the entire market.
3. Background in Taiwan and Employee Stock Holding Data
3.1. Taiwan stock market
The Taiwan stock market commands a total market capitalization of about $NT 10 trillion (about $US 313 billion) in the late 1990s, which ranked it as the 12th largest equity market in the world. The listed stock market includes both stocks listed at the Taiwan Stock Exchange (TSE) and over-the-counter (OTC) stocks, with TSE dominating the total market capitalization, during the sample period. Among 509 TSE-listed companies during 1998, we focus on the 442 of which complete firm-level information is available from Taiwan Economic Journal (TEJ).
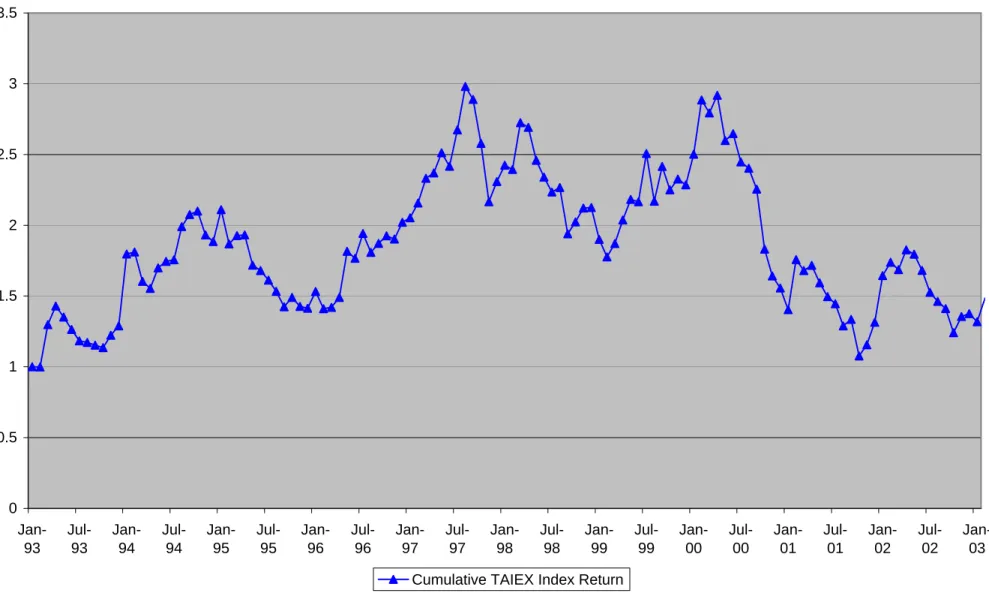
One apparent feature about Taiwan stock market is its high volatility. During the decade between 1993 and 2003, the average annual volatility is 32.3 percent, 72 percent greater than the volatility in the U.S. market during the same period. On the other hand, the average annual return is 10.5 percent, similar to that of U.S. market index. We plot the TAIEX (a value weighted index of all listed shares) movement during the decade in Figure 1. The high volatility underscores that sample selection has non-negligible impact on analyses on stock returns. Because we only have one year of data in 1998, we intentionally downplay employer bias’s impact on individual portfolio returns but focus primarily on the consequent under-diversification.
We obtain firm-level information, such as firm size, market value, CAPM beta (calculated by performing the CAPM regression between 1996 and 1998 for each firm), past return and return volatility from the Taiwan Economic Journal (TEJ) and summarize it in Panel A of Table 1.
(Insert Table 1 about here)
3.2. Investor position and employment information
We obtain tax-filing data from Data Center at the Ministry of Finance of Taiwan that collects detailed household information for tax filing purposes, after the end of each calendar year. The data is similar to the information that the Internal Revenue Service (IRS) collects in the United States for household tax filing. For each household, we have the following three types of files: (1) the Income File that records different types of income data including salary, cash dividends and stock dividends that household members receive, and income tax levied on the household; (2) the Household Member File that records the characteristics (Age, Gender, and Relation, etc.) of each household member; and (3) the Stock Shareholders File that records the dollar amount invested in companies at the time of filing (the deadline is December 31 of each year).
The data cover the entire investor universe. There are about 23 million populations in Taiwan as of 1998 and about 15 million filed taxes with taxable income. 6,676,100 individuals report income from salary, which identify them as employees of companies or organizations. 4,045,360 of such employees with income and salary above basic living standard are required to file for tax purposes and report their stock holdings. Among the 509 listed companies around in 1998, we focus on the 442 companies for which all required information is available. More than one third of total employees (1,547,163) invest in the 442 sample companies in our file. These listed companies
employ 210,103 people and the current study focuses on 167,116 of those who hold at least one listed company stock as revealed by stock shareholder data.
The foremost feature of the data is the information about an individual’s employer. To our best knowledge, investors’ employer information becomes available at the market level for the first time. We can obtain precise employer information about each individual from the Income File, which records each individual’s employer and how much salary the individual earns from the company. Once identifying the investor’s employer, we next match the employer information with individual portfolio holding data recorded in the Stock Shareholder File. Combining the employer information and stock holding data, we can calculate the fraction of individual portfolios that are invested in employer stocks, which reflect employees’ attitude toward employer stocks. Such data provide important additions to the transaction data featured in Barber et al. 2005(a) and 2005(b), in understanding of the behavior of Taiwanese investors. The closest data used in previous study are from Massa and Simonov (2005). However, they do not have data on the entire Swedish population, nor do they have precise employer information.
Several other distinct features of the data provide unique research opportunities. First, the data provide complete information for the entire Taiwanese population. Because investing in employer stocks can vary greatly depending on firm characteristics (such as firm size, plan design and firm past returns as in Benartzi 2001 and Choi et al. 2005), it is unreliable to draw conclusion on the social cost of investing in employer stocks based on evidence from any select group of companies. Complete data at the market level, therefore, enable us to accurately assess the social welfare cost resulting from the bias.
Our data are also unique in that employers play limited roles in investor decisions. Few options were granted for corporate executives or employees before 2002 and employee share ownership plans (ESOPs) (Kruse et al. 2005) were rare during the sample period. Another distinct feature of option granting in Taiwan is that, unlike the practice in the United States, there is no lock-up requirement and employees can liquidate their awarded shares immediately (Han 2003). Despite the fact that executives are
occasionally awarded with employer stocks, supplemental data on executive compensation indicates that employee bonus and employee stock purchase plan account for only an average 0.28 and 0.51 percent (the medians are both 0) of all outstanding shares for listed companies. Unlike in United States, there is no lock-up requirement for granted options in Taiwan during the sample period (Han 2003), so executives can sell their awarded shares at any time, making awarded shares no different from shares obtained through open-market purchase. We also verify the limited role of option-granting with employee’s income data. Even for the most senior executives, salary accounts for more than 92 percent of their total income. ($NT 2,093,165/ 2,268,009 in Table 2.) The rest is made up from incomes from rents, investment proceeds, intellectual property, and professional services. Stock options account for less than 1 percent of the total income.
Fight for corporate control was rare in Taiwan during the entire 1990s and only one attempted hostile took place during the decade (Qu 2003 and Guo 2005). Therefore, corporations have little incentive to encourage employees holding their shares in order to fend off potential hostile takeover. This also distinguishes Taiwan from U.S. or nearby Hong Kong, where employers encourage employees holding their stocks to retain better control of the companies (Rauh 2005).
(Insert Table 2 about here)
Unlike U.S. investors who obtain shares through different channels (brokerage accounts, retirement accounts, matching contributions from employers, option granting, ESOPs, etc.), Taiwanese investors obtain almost all of their shares from open-market transactions.2 Because there is no private pension plan practice in Taiwan, employers have less impact on households’ portfolio choice than their counterparts do in the U.S. This puts the current study in stark contrast with existing studies that focus on retirement
2
Similar to the practice in many other markets, companies tend to award shares to employees before initial public offerings (IPOs), which largely explain that employees at companies that went public in 1997 hold a much higher fraction (54 percent) of their portfolios in employer stocks, than those at companies that went public earlier (47 percent).
plans, where employer matching policy and retirement plan design induce employees to hold company stocks.
Finally, the data enable us to distinguish company managers from rank and file employees. Examining whether managers hold more/less employer stocks than rank and file employees can indicate whether managers are over-confident about employer prospect or more sophisticated and hold more diversified portfolios. Studying whether managers can profit from holding employer stocks will provide additional evidence on whether employment-generated-familiarity can generate out-performance and whether managers can profit from their private information about the employers. More importantly, such information helps policymakers understand which employees are most susceptible to the bias toward employers and design specific actions targeted at helping rank and file employees.
3.3. Taiwan pension system in 1998
The social security system in Taiwan deserves some further discussions. There was no universal social security plan in Taiwan during the sample period. National Health Insurance (NHI) and National Pension Program (NPP) reform took place in the late 1990s but was not put into effect until the turn of the century, and retirement benefits and insurance vary considerably among different social strata. Government employees, accounting for about 8 percent of population, are required to participate in retirement compensation plan that entitle them to a lump-sum old-age benefit of up to 34 months of salary by the Government Employee Insurance and an additional 53 months of salary or a monthly pension of 70 percent of pre-retirement basic salary offered by the Retirement Reserve Fund. Employees of companies made up about one third of the population in the 1990s and may receive up to a lump sum compensation of up to 50 months of salary. The remaining one half of the population is not covered by any public retirement insurance (Lin 2002). Companies are under no legal obligations to provide retirement plans to employees and few employers offer any other forms of private pension plans. Consequently, we believe that most households count on proceeds from stock market
investment as a major source of income after retirement and take such investment decisions seriously. In addition, stocks account for a much higher fraction (24 percent) of household assets, than deposits do (12 percent) in Taiwan (Directorate-General of Budget, Accounting and Statistics, Taiwan, http://www.dgbas.gov.tw/),
Like many other developing markets (Khorana et al. 2005), equity mutual funds were not well developed in Taiwan during the sample period (Lin 2004, Shu et al. 2002). The lack of a public retirement system and the immaturity of mutual fund industry imply that Taiwanese investors, especially those who have no other income sources after retirement, must plan to use part of their stock investments for retirement purpose (Lin 2002). Consequently, the situation is similar to what investors would do should they have to invest their private social security account, under little influence from the employers or the retirement plans. Our findings suggest that, reasons other than plan design and employer incentives, which were rare in Taiwan during the sample period, are probably responsible for why investors tilt their retirement investment toward employer stocks in a global context.
4. Bias toward Employer Stocks
4.1. Tendency to invest in employers’ stocks
We first present evidence that Taiwan investors tend to invest an abnormally large proportion of their portfolios in employer stocks. Panel B of Table 2 reports that more than 70 percent of the 167,116 listed company employees (who receive salaries from listed companies in the tax filing file) own shares of their employers3. Senior employees are much more likely to own company shares even when executive stock options were rare in 1998: 83 percent of senior management (whose salaries are above the top 5 percentile within each company) invest in employer stocks, as opposed to 65 percent for
3
If an investor were to randomly pick stocks, the probability of any investor owning his employers’ stocks is N/442 (where N is the number of stocks held in portfolios and 442 is the number of listed companies in Taiwan in 1998). Given that average investors hold 3 stocks in their portfolios, a potential benchmark to
employees with salaries below the median salary at respective employers. Comparison between employees who invest and do not invest in employer stocks in Appendix B reveals that employees who invest in employer stocks tend to be male, older, and wealthier.
Another informative measure is the average fraction of portfolios that individuals invest in the employer stocks. We calculate the following fraction for each investor:
Percent in Employer= Investment Total Employer in Investment − − − (1)
where Investment-in-Employer is the dollar value invested in the employer’s stocks and Total-Investment is the dollar value of all portfolio holdings.
Panel B of Table 2 reveals that TSE-listed company employees on average invest 47 percent of their portfolios in their employer’s stocks (median=42 percent). 46.74 percent of all public company employees invest more than one half of their portfolios in respective employers’ stocks and 27.22 percent of the employees invest their entire portfolios in employer stocks. Consistent with the above pattern, senior managers invest a higher fraction of their portfolio in employer stocks (55 percent) than rank and file employees (44 percent), despite that senior management hold much bigger portfolios (41 million compared to about 4 million Taiwan Dollar).
It is striking that individuals hold about one half of their portfolios in a single stock of their employers. Such severe under-diversification is apparently detrimental from a return-to-risk perspective. To make things even worse, the single stock that investors bet heavily on is that of the employers, from which they obtain a large fraction of their income (for detailed discussions, please refer to Benartzi et al. 2004, Meulbroek
compare against is 3/442, or less than 1 percent of listed-company employees are expected to hold employer shares.
2003). It is therefore expected that such an investment strategy will post considerable costs to the entire society,4 which we will assess in Section 5.
4.2. Investor characteristics and tendency to invest in employer stocks
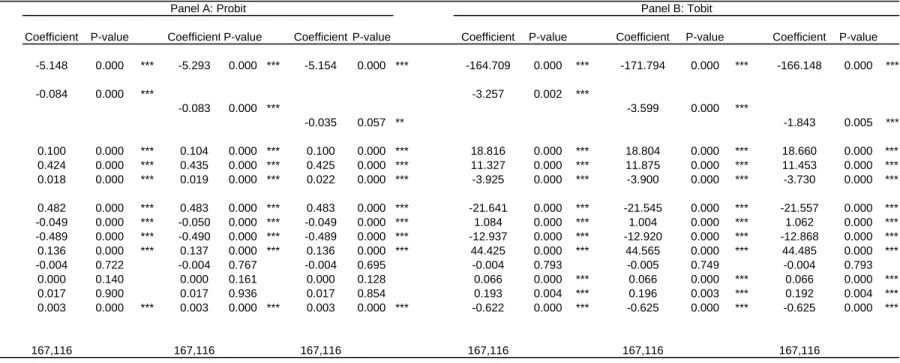
Individuals exhibit different levels of behavioral biases (Dhar and Zhu 2005) and some investors are more enthusiastic with employer stocks than others (Choi et al. 2002, Cohen 2005). We next investigate which individuals favor employer stocks more in a regression setting. First, we perform probit regression in Table 3 to understand which employees are more likely to invest in employers. The dependent variable is a binary dummy variable that equals to 1 if an employee invests in her employer’s stock and 0 if she does not. Because our final sample only includes employees of listed companies who invest in the stock market, all employees fall in one of the two categories.
Investor characteristics include dummy variables for managers, logarithm of investor age, logarithm of investor income, and a gender dummy variable. The dummy variables for managers are constructed as follows. We sort all employees of each listed company by their salaries and consider investors with top 5/10/25 percentile salaries as managers. The top 5 percentile employees are most likely to include senior corporate managers and the top 10 and 25 percentile represent mid-level management (we use these terms interchangeably in the rest of the paper). The remaining 75 percent can be considered as the rank and file employees of companies. The senior 5/10/25 dummy variable takes the value of 1 if an investor’s salary falls in the 5/10/25 percentile range and 0 otherwise. Investor age and income are observations in 1998 and the gender dummy variable takes value of 1 if an investor is male and 0 if she is female. The gender dummy is meant to control for difference in confidence and other behavioral biases between male and female employees (Barber and Odean 2001). We also control other firm level information that will be discussed in Section 4.3.
4
We also examine the fraction for employees of all employers, regardless of whether the employers are listed companies. Individuals invest an average of 24 percent of their portfolio in their employers’ stocks. The median value is 0. We believe this is a very conservative estimate because the whole sample includes
(Insert Table 3 about here)
Older employees and employees with higher taxable income are more likely to invest in employers. An investor who is 10 years older is 10 percent more likely to invest in employers and an investor with $NT 10,000 higher income is 168 percent more likely to invest in employer stocks and the results are highly significant.5 Managers are less likely to invest in the employers than rank and file employees when controlling for age and income. Senior managers are about 8 percent less likely to invest in the employers. The results may seem surprising because it is opposite to the summary statistics results in Table 2. This is entirely because we control for other investor characteristics in the regression setting. Because senior managers tend to be older and wealthier than other employees and older and wealthier investors are more likely to invest in employers, regression results depict an accurate picture of manager’s propensity to invest in employers. Such results are in start contrast with the findings from the U.S. (Malmendier and Tate 2005) that CEOs on average own 2.3 percent (median=0.12 percent) of their employer stocks, much higher than the rank-and-file employees. Male employees are slightly more likely to invest in employers.
We further perform two-sided tobit regression with the dependent variable as the percent of each portfolio invested in the employer stocks. The dependent variable is bounded by 0 and 1 to reflect that it is a measure of fraction. The tobit regression estimates investors’ tendency to invest in employer stocks and how much they decide to invest in employers at the same time. As expected, most of the variables come out in the same direction as the probit regression.
mostly private companies and organizations, where employees cannot purchase employer shares through open market transactions.
5
We calculate significance by using robust standard errors that account for clustering at employer level in all regression settings.
Consistent with Choi et al. (2005) on employees from three U.S. companies, managers invest a smaller fraction of their portfolios in employer stocks, controlling other variables. This finding highlights that rank and file employees are indeed more susceptible to the mistake of investing in employer stocks. We conjecture that this is partly because senior managers have much bigger portfolios that can be diversified through other holdings or because they are more likely to understand the diversification principle or utilize professional services to manage their portfolios. Consistent with the probit results, age and income are positively related to the fraction invested in employers. Despite that male employees are more likely to invest in employers, they invest about 4 percentage less in employers than female employees do, when controlling for their choices.
4.3. Firm Characteristics and Tendency to Invest in Employers
Previous studies find that employees at companies with certain characteristics allocate more towards their employers in the retirement plans. For example, Benartzi (2001) shows that investors favor employer stocks more if company stocks have performed well in the past few years, and Cohen (2005) finds that employees of larger companies invest significantly more in their employers’ stocks.
We include firm level characteristics such as company market capitalization, market to book ratio, CAPM market beta, high-tech dummy, and past return and volatilities. Market capitalization is calculated by multiplying the total number of outstanding shares and the share price at December 31, 1998. Beta is calculated by running CAPM regression between January 1, 1996, and December 31, 1998, for each firm. High Technology is a dummy variable that equals to 1 if a company is in computer-related and bio-technology industry and 0 otherwise. Past one- and two-year return and volatility are the company returns between January 1, 1998/1997, and December 31, 1998 and the standard deviation of the monthly returns.
Consistent with U.S. findings, there is some evidence that investors hold more employer stock if the employer stocks perform relatively better. 6 Interestingly, individuals’ response to employer stock return volatility depends heavily on the time-horizon. 7 They increase employer stock holding for stocks with high 1-year volatility and decrease holding for stocks with high 2-year volatility.8 Similar to Cohen (2005), employees hold relatively more if employers have high market capitalization or the employer stock enjoys higher valuations, controlling for past returns. High-tech company employees hold more in employers stocks, consistent with the notion that high-tech company employees favor the employers9, without the common practice of option granting in U.S. high-tech companies in the 1990s. One potential reason that employees at high-tech companies hold more of their employer stocks is that such employers are more likely to use company stocks in awarding bonuses to employees. According to Chen et al. (2005), electronic companies, a large fraction of the high-tech companies, award an average of 84 percent of their bonuses with company stocks, much higher than the rest of the companies, where company stocks make up an average of 33 percent of the bonuses. However, consistent with our findings in Table 2, the authors also find that that salary commands more than 90 percent of household income for listed company employees and bonuses account only for less than 5 percent of household total income. Therefore, we believe that the average size of the bonus is too small to drive our main results and suspect that over-confidence with the employer generated by the awarding of bonuses may induce employees to hold more of employer stocks.
6
We also perform an alternative specification in which we calculate the fraction invested in employer stocks based on the number of shares, instead of dollar value, and obtain very similar results. Such results indicate that our findings are not likely to be driven by a mechanical relationship due to price appreciation of the employer stocks.
7
It is worth noting that inference on past returns and volatility should both be taken with caution given that we only have one snapshot of household portfolio but not information on how households change their portfolio holdings.
8
This may be attributed to the high level of return volatility and the reversal of annual returns in the Taiwan stock market.
9
Given the positive correlation between the high-tech dummy and the beta of company stocks returns, we observe a somewhat surprising negative coefficient for the beta of company stock returns. When we perform a separate simple regression of the fraction invested in employer stocks and the beta of company stock returns, we find positive and significant coefficient, indicating that employees with ‘riskier’ companies invest more in employer stocks.
Our findings so far indicate that some inherent behavioral biases drive investors’ strong desire to invest in employers’ stocks. This implies that improvement in plan design alone cannot safeguard the security of future retirees. Legislators should reconsider how much autonomy individuals should have over their retirement and private social security accounts. In addition to the often-mentioned educational programs aimed at enhancing investor awareness of the bias and its cost, some constraints should be imposed on the minimum fraction of portfolios invested in stock market index funds or other asset classes such as treasury bonds, and the maximum fraction of portfolios invested in employer stocks. Corporate policies should discourage employees to hold employer stocks to help improve employees’ long-term welfare. Even if employees become aware of the costly bias and adjust their behavior with current contributions, their retirement accounts can remain sub-optimal because of inertia (please refer to Appendix B in Huberman and Sengmueller (2004) and Choi et al. (2002) for some more detailed discussion). Proactive programs such as Save-More-Tomorrow™ by Benartzi and Thaler (2004) should then be introduced to gradually achieve diversification in retirement accounts.
5. Costs of Investment in Employers’ Stocks
Huberman et al. (2003) report that employer stocks as an investible option increases households’ likelihood of participating in defined contribution pension plans. Similarly, we find that company stocks are effective in attracting employees to invest in the stock market. 79.5% of employees at listed companies participate in the stock market, much higher than the 23.2 percent for employees at private companies. However, it is puzzling as to why corporate employees forego the easily available diversification offered by the stock market and choose to invest in the riskier alternative of their own employers’ stocks.
One apparent reason why investors may favor employer stocks is that they may possess advantageous information about their employers. Existing studies are divided on whether familiarity generates value-relevant information. Ivkovich and Weisbenner
(2005) and Massa and Simonov (2005) claim that investors obtain abnormal return by investing in nearby stocks but Huberman (2001) and Zhu (2004) argue that familiarity is not necessarily driven by information. Seasholes and Zhu (2005) show that Ivkovich and Weisbenner’s results disappear when returns are measured with the correct calendar-time portfolio approach based on investor trades.
Because we only have a snapshot of investors’ portfolios for one year, attempts to draw conclusion on whether investing in employers generates abnormal returns will be hindered by not only the limited power of the test but also the correlation in contemporaneous stock returns. In particular, we perform cross-sectional regression of the one-, two-, and five-year forward returns of each listed company on the fraction of each company’s outstanding shares being held by all employees, senior managers, and middle managers, respectively10. The coefficients for employee ownership in all specifications are negative yet insignificant, hinting that the more employees invest in their employers, the lower the employer stock returns are. Hence, it does not seem that employees can forecast employer stock returns.
In addition, we divide all sample employees into quartiles by the fraction of their portfolio invested in employer stocks. We next form four portfolios by pooling the portfolio positions by employees belonging to each quartile. Contrary to the claim that familiarity generates higher returns, the equal-weighted 1-year forward portfolio raw return is indeed 8.69 percent lower (significant at the 1 percent level) for portfolios by individuals who invest most in employer stocks than those who invest least. It is important to note that such a result is probably specific to the sample period. The difference remains negative yet becomes insignificant when we evaluate the 2-year and 5-year horizon, confirming that sample selection heavily influences the results over the shorter horizon. Given the respective limitation of above tests, neither of the above results is sufficient to conclude that individuals suffer lower returns by tilting portfolio
10 For example, one regression is specified as: return(1)=a+ b* (shares owned by all employees) + ε, where
return(1) is the one-year forward return for a listed company and “shares owned by all employees” is the total number of the company’s shares owned by all of its employees divided by the total number of outstanding shares.
toward their employers. Notwithstanding, there is hardly any evidence that individuals gain higher return by investing in employers, either.
Hence, we make no claim on whether individuals gain abnormal returns by investing in employers. Instead, we assume that investing in employer stocks does not influence individuals’ portfolio return and focus exclusively on how employees suffer from the severe under-diversification resulting from the bias toward employers. We first summarize the one-year forward portfolio return and volatility and ask the question whether the portfolio choice can be improved by replacing the investment in employer stocks with randomly selected portfolios, such as a market index.
A simple comparison of the return and risk of the observed portfolio versus the bias-free portfolio by replacing company stocks with market index11 reveals that individuals could increase the returns and reduce the risk of their portfolios at the same time by investing less in employers. The average one-year forward monthly raw return is 1.64 percent for observed portfolio and 2.34 percent for the market portfolio.12 The hypothetical bias-free portfolios outperform individuals’ real portfolios by 20 basis points per month on the two-year horizon but lag the real portfolios by 9 basis points per month over the five-year horizon. Such findings are consistent with our earlier note that the return results are sensitive to sample selection and must be interpreted with caution.
In contrast, the hypothetical employer-bias-free portfolios are consistently less risky than the real portfolios. On the one-year horizon, the volatility of both the real and hypothetical portfolios is much higher (12.75 and 10.48 percent, respectively) than the market index volatility in 1998 (7.63 percent) and the ten-year average (9.33 percent) between 1993 and 2003. It is noteworthy that replacing employer stocks with market index reduces the portfolio risk by 17.8 percent. Over the two- and five-year horizon,
11
By doing so, we implicitly assume that individuals will randomly pick other stocks if they were not to invest in their employers stocks. In aggregate, that is very similar to investing in the market portfolio by aggregating employees from all listed companies. Although their sizes were modest, mutual funds that mimic market index returns were available as an alternative investment vehicle to the sample investors during 1998.
portfolios free from employer bias also enjoy much lower level of risks than the observed portfolios (11.47 percent vs. 14.09 percent and 12.59 percent vs. 15.85 percent, representing a 18.6 and 20.6 percent reduction in portfolio risks). Above summary statistics confirm that under-diversification resulting from employer bias consistently hurts individuals’ welfare.
(Insert Table 4 about here)
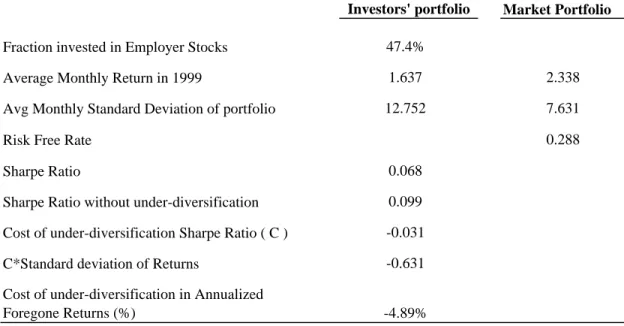
We next assess the economic significance of the losses caused by such under-diversification in Table 4. The essence of our estimation approach is to compare individual portfolios’ return-to-risk ratio (i.e. Sharpe ratio) with the hypothetical portfolio if individuals do not invest heavily in employers. By assuming no portfolio change between the tax-filing date and December 31, 1998, we first estimate each investor’s monthly portfolio return and volatility in 1999, one year after forming the portfolio at the tax-filing deadline. Because return results are sensitive to the sample period, we construct the hypothetical portfolio for each individual by holding the observed portfolio return constant and replace the observed portfolio volatility with the volatility of the hypothetical portfolio free from employer bias. 13 We next use the return and volatility information of the actual versus hypothetical portfolios in 1999 and calculate the Sharpe ratio for the observed versus the hypothetical portfolio to evaluate how return-to-risk ratio could be increased if individuals steer away from employer stocks.
The improvement is striking. The average Sharpe ratio increases from 0.068 to 0.099, an increase of almost 50 percent, if individuals were not to invest heavily in employer stocks. We next multiply the Sharpe ratio with the observed portfolio standard deviation and calculate how individual portfolio returns would change if individuals were to hold portfolios with current risk but do no tilt portfolios toward employers. The
12
The sizeable difference results from equal-weighting of very poor Sharpe ratios of individual portfolio, many of which are severely under-diversified.
13
We obtain very similar results when using 2 years and 5 years as hypothetical holding periods. Given that the turnover is high in the Taiwan stock market and particularly high for individual investors (See Barber et al. 2005(a) 2005(b)), we feel the one-year holding period assumption is more appropriate.
average employee can obtain a higher return 0.63 percentage point per month than the observed portfolio. The average annualized foregone return is 4.89 percent.14
There are several ways of putting the foregone return into perspective. We first calculate the ratio of the foregone return in dollar value to individual’ salary income in 1998 in Table 5. For each individual, we multiply the foregone return with the 1998 year-end portfolio value and divide it by the 1998 salary income. We windsorize 1% of extreme observations on both tails because of outliers. Foregone return on average represents 39.74 percent of investor’s last-year income. Such results have to be interpreted with caution because it is apparent that part of the result can be attributed to the fact that Taiwanese employees hold large portfolios relative to their incomes. At the same time, the magnitude of the portfolios exactly reflects that individuals probably plan to use at least part of their stock portfolios to support their retirement given the lack of other retirement plans in Taiwan. To avoid the influence from outliers, we also calculate the more conservative ratio of median portfolio value to median salary income in 1998. The ratio equals to 2.36. By multiplying 2.36 with the average foregone return of 4.89 percent, we find that the foregone return still represents a considerable 11.54 percent of investor’s 1998 salary income.
(Insert Table 5 about here)
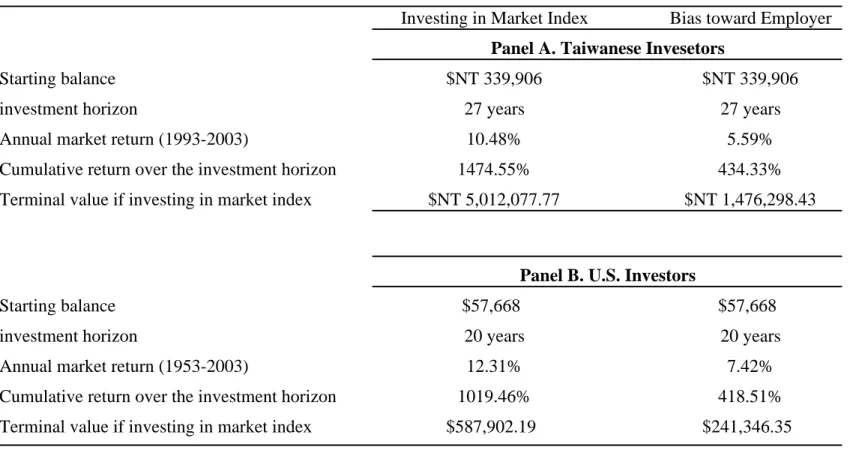
It is evident from the above illustration that the bias toward employer stocks causes individuals dearly over the 1-year horizon. It should not be surprising that such a strategy causes even greater losses compounded over longer horizons. Based on summary statistics in Table 2, average employees are 38-year old and have 27 years until retirement. We assume the portfolio value to be $NT 339,906, which is the median portfolio value for all Taiwanese employees. By assuming the expected future returns to be in line with the arithmetic average return during the decade around the sample year of 1998 (between 1993 and 2003), employees’ portfolios with the same level of risk, with or
14
Because returns compound differently for different portfolios, the average annualized foregone return (4.89 percent) does not equal to average foregone return compounded at annual basis (7.83 percent).
without employer bias will grow to $NT 1,476,298 and $NT 5,012,077, respectively. That is, investment without bias toward employers will generate more than three times as much wealth as individuals’ real portfolios, holding portfolio risks constant. Using the median annual income of $NT 429,804 for all investors, the terminal value of the investment strategy with and without employer bias can sustain the median investor for 6.87 and 23.32 years, at 50 percent of the 1998 income. Put differently, individuals’ observed strategy generates wealth that can barely support retirees for 10 years. In contrast, the bias-free strategy can keep retirees through their life-expectancy (77.8 years in 1998).
It also helps to put the foregone returns in the context of U.S. market. If U.S. employees were to exhibit similar bias toward their employers (the fraction invested in employers in Taiwan 47 percent is indeed similar to some of the estimates in United States for retirement plan accounts (Brown et al. 2005, Huberman and Sengmueller 2004), we can estimate in Panel B of Table 5 how much average U.S. employees would give up. According to Holden and VanDerhei (2003), average account balance for active 401(k) plan participants is $57,668. We assume that an individual invests through market index and obtains the historical average return of 12.3 per annum during the past 50 years. With an additional assumption of investment horizon for 20 years till retirement, the investor will receive $587,903 terminal value at retirement. Instead, if she keeps her portfolio risk constant and tilts their portfolios toward employers as the average Taiwanese investor does and gives up 4.89 percent per year, the terminal value will be $241,346, less than one half of the value if individuals were not to bias toward the employers. The above examples both demonstrate that the bias toward employer stocks can incur such high cost to employees that retirees’ livelihood after retirement will be jeopardized.
Needless to say, the above outcomes have drastically different implications on social stability and government responsibilities. Younger generations would have to bear greater burden if the older ones did not obtain enough from the retirement investments. It is likely that individuals may have other types of investments such as savings and real estate. Notwithstanding, if one were to assume that private retirement accounts make up
the majority of retirees’ income, as will happen under the regime of private social security account, our findings in Taiwan expose the hazard of giving individuals too much autonomy over their retirement accounts. It seems that employment with a listed company greatly increases someone’s chance of investing in employer stocks and holding under-diversified portfolios, and may cause catastrophic consequences.
6. Conclusions
We utilize a comprehensive data from Taiwan to show that employees of TSE-listed companies invest about one half of their portfolios in their employers’ stocks. The economic cost of doing so is considerable. Investors on average give up 4.89 percent of raw returns per annum by holding their employers’ shares, which equal to 39.74 percent of their 1998 salary income. Such allegiance to employer stocks cannot be attributed to executive option compensation, ESOPs, sponsoring policies by employers to own company stocks, plan designs, or private information. Instead, behavioral biases, such as availability and salience heuristics, inertia, over-confidence, and over-extrapolation are possible reasons behind the phenomenon.
Different from previous findings drawn from retirement accounts in the United States, our findings suggest that investing in employer stocks is generic to individual investor decision-making, but not limited to their decisions in the context of investing for retirement. The findings emphasize that although improving plan design and company sponsoring policy could alleviate the severe under-diversification in retirement plans to some extent, it is highly plausible that individuals will choose to invest sub-optimally in employer stocks even when companies do not actively encourage employees to hold their shares.
Our study underscores the potential pitfall that investors will get into after social security is ‘privatized’ and motivates policy changes that will safe-guard retirees’ security through social security reform. The findings are important for countries considering reforming their social security. Any attempt to ‘privatize’ social security
must be based on very careful consideration of individual behavioral biases and potential mistakes. Unnecessary risky investment can result in loss of security after retirement and impose consequential problems to financial markets and social stability. The lessons from Taiwan clearly stress the need to provide well-diversified alternatives for individuals to invest for their retirement, given their behavioral biases and failure to diversify in their autonomous accounts.
Future studies are needed in the following areas. First, further studies are required to understand why individuals have such strong attachment to employer stocks as reported in this study. Only after understanding the behavioral mechanism behind the loyalty phenomenon can scholars and policymakers determine the best way to help investors avoid the bias. Second, institutional differences in retirement arrangement around the world can provide valuable opportunities to compare and contrast the costs and benefits of competing systems and engender policy proposals that better ensure employees’ welfare. Finally, future research should come up with specific mechanisms that can limit employee’s enthusiasm for their employers’ stocks. It is worth emphasizing that employees hardly have any information advantage on their employers than other investors and investing in other vehicles such as mutual funds should be advocated.
References
Agnew, Julie, 2002, Inefficient Choices in 401(k) Plans: Evidence from Individual Level Data, working paper, College of William and Mary.
Agnew, Julie, Pietro Balduzzi, and Annika Sunden, 2001, Portfolio Choice, Trading, and Returns in Large 401(k) Plan, American Economic Review, 93(1), 193-215.
Asian Development Bank, 1998, Policy Options for Pension Reform in Asia: Challenges in Design and Implementation, Technical Assistance Reports.
Barber, Brad, Yi-Tsung Lee, Yu-Jane Liu, and Terrance Odean, 2005 (a), How Much is Lost to Trade?: Evidence from Taiwan, working paper, University of California, Davis.
Barber, Brad, Yi-Tsung Lee, Yu-Jane Liu, and Terrance Odean, 2005 (b), Do Individual Day Traders Make Money? Evidence from Taiwan, working paper, University of California, Davis.
Barber, Brad and Terrance Odean, 2001, Boys will be Boys: Gender, Overconfidence and Common Stock Investment, Quarterly Journal of Economics, 261-292.
Barber, Brad, Terrance Odean, and Ning Zhu, 2005, Does Individual Investor Herding Forecast Returns? Working paper, University of California, Davis.
Benartzi, Shlomo, 2001, Excessive Extrapolation and Allocations of 401(k) Accounts to Company Stocks, Journal of Finance, 56, 1747-64.
Benartzi, Shlomo and Richard H. Thaler, 2002, How Much Is Investor Autonomy Worth? Journal of Finance, 57(4), 1593-1616.
Benartzi, Shlomo and Richard H. Thaler, 2004, Save More Tomorrow: Using Behavioral Economics to Increase Employee Savings, Journal of Political Economy, 112(1), Part 2, S164-S187.
Benartzi, Shlomo, Richard H. Thaler, Stephen P. Utkus, and Cass R. Sunstein, 2004, Company Stock, Market Rationality, and Legal Reform, working paper, University of Chicago Law School.
Bethel, Jennifer E., Julia Porter Liebeskind, and Tim Opler, 1998, Block Share Purchases and Corporate Performance, Journal of Finance, 53(2), 605-634.
Brown, Jeffrey, Nellie Liang, and Scott Weisbenner, 2005, 401(k) Matching Contributions in Company Stock – Costs and Benefits for Firms and Workers, Journal of Public Economics, forthcoming.
Campbell, John and Martin Feldstein, 2001, Risk Aspects of Investment-based Social Security Reform, University of Chicago Press.
Chen, Chun-Ho, Chan-Jane Lin, and Tsai Yann-Ching, 2005, The Association between Employee Bonus and Subsequent Firm Performance: Evidence from Electronic Industry in Taiwan, working paper, National Taiwan University.
Choi, James, David Laibson, Brigitte Madrian, and Andrew Metrick, 2002, Defined Contribution Pensions: Plan Rules, Participant Decisions and the Path of Least Resistance, Tax Policy and the Economy, 16, MIT Press.
Choi, James, David Laibson, Brigitte Madrian, and Andrew Metrick, 2005, Employees' Investment Decisions About Company Stock, in Olivia S. Mitchell and Stephen P. Utkus (eds), Pension Design and Decision-Making Under Uncertainty, Oxford University Press, forthcoming. Cogan, John and Olivia Mitchell, 2003, Perspectives from the President’s Commission on Social Security Reform, Journal of Economic Perspective, 17, 149-172.
Cohen, Lauren, 2005, Loyalty Based Portfolio Choice, working paper, University of Chicago.
Dhar, Ravi and Ning Zhu, 2005, Up Close and Personal: An Individual Level Analysis of the Disposition Effect, Management Science, forthcoming.
Feldstein, Martin, 1998, Privatizing Social Security, University of Chicago Press.
Feldstein, Martin and Horst Siebert, 2002, Social Security Pension Reform in Europe, University of Chicago Press.
Goetzmann, William and Alok Kumar, 2004, Why Individual Investors Hold Under-Diversified Portfolios, working paper, Yale University.
Goetzmann, William, Massimo Massa, and Andrei Simonov, 2004, Portfolio Diversification and City Agglomeration, working paper, Yale University.
Gordon, Lilli A. and John Pound, 1990, ESOPs and Corporate Control, Journal of Financial Economics, 27, 525-555.
Guo, Yu-Fane, 2005, A Summary of the Regulations on Tender Offers, Securities and Futures Monthly, 23-7, 12-23.
Han, Tzu-Shian, 2003, The Economic Effects of Profit Sharing and Taiwan-style Employee Stock Owner ship Plans: Evidence from Taiwan’s High-tech Firms, Taiwan Management Journal, 3-1 (February), 1-22.
Hardy, Colburn D., 1982, ABCs of Investing Your Retirement Funds, 2nd Edition, Medical Economic Books, Oradell, NJ.
Herbertsson, Thor Tryggvi and Michael J. Orszag, 1999, Issues in European Pension Reforms, Supplementary Pensions, working paper, University of London.
Holden, Sarah and Jack VanDerhei, 2003, 401(k) Plan Asset Allocation, Account Balances and Loan Activity, Investment Company Institute.
Holden, Sarah, Jack VanDerhei, and Carol Quick, 2000, 401(k) Plan Asset Allocation, Account Balances, and Loan Activity in 1998, Investment Company Institute Perspective, 6(1).
Huberman, Gur, 2001, Familiarity Breeds Investment, Review of Financial Studies, 14(3), 659-680.
Huberman, Gur, Sheena Iyengar, and Wei Jiang, 2003, Defined Contribution Pension Plans: Determinants of Participation and Contribution Rates, working paper, Columbia University.
Huberman, Gur and Wei Jiang, 2005, Offering vs. Choice in 401(k) Plans, Equity Exposure and Number of Funds, Journal of Finance, forthcoming.
Huberman, Gur and Paul Sengmueller, 2004, Performance and Employer Stock in 401(k) Plans, Review of Finance, 8(3), 403-443.
Ivkovich, Zoran and Scott Weisbenner, 2005, Local Does as Local Is: Information Content of the Geography of Individual Investors’ Common Stock Investments, Journal of Finance, 60(1), 267-306.
Kahneman, Daniel, 2003, Maps of Bounded Rationality: Psychology for Behavioral Economics, American Economic Review, 93, 1449-1475.
Kahneman, Daniel and Amos Tversky, 1986, Rational Choice and the Framing of Decisions, Journal of Business, 59, 251-278.
Kehrer, Daniel, 1991, The Pension Plan Investor, Probus Publishing Company, Chicago, IL.
Khorana, Ajay, Henri Servaes, and Peter Tufano, 2005, Explaining the Size of the Mutual Fund Industry around the World, Journal of Financial Economics, 78(1), October, 145-185.
Kruse, Douglas, Richard Freeman, Joseph Blasi, Robert Buchele, and Adria Scharf, 2005, Motivating Employer-Owners in ESOP Firms: Human Resource Policies and Company Performance, NBER working paper 10177.
Leone, Richard C. and Greg Anrig (Eds), 1999, Social Security Reform: Beyond the Basics, The Century Foundation.
Lin, Chen-Wei, 2002, The Developing Economies, XL-3 (September), 327-358.
Lin, Qiu-Jin, 2004, The Past, Present, and Future of Taiwan Mutual Fund Industry, Wealth Management, 1 ( http://fw.fundwatch.com.tw/newfw/wm/catalog.jsp?allqtype=02)
Malmendier, Ulrike and Geoffrey Tate, 2005, CEO Overconfidence and Corporate Investment, Journal of Finance, forthcoming.
Massa, Massimo and Andrei Simonov, 2005, Hedging, Familiarity, and Portfolio Choice, Review of Financial Studies, forthcoming.
Meulbroek, Lisa, 2003, Company Stock in Pension Plans: How Costly Is It? working paper 02-058, Harvard Business School.
Mitchell, Olivia S. and Stephen P. Utkus, 2005, Company Stock and Retirement Plan Diversification, working paper, Wharton School, University of Pennsylvania.
Muller, Katharina, Andreas Ryll, and Hans-Jurgen Wagener (Eds), 1999, Transformation of Social Security: Pensions in Central-Eastern Europe, Physica-Verlag, Germany.
Qu, Qiu-Fang, 2003, On the Legality of Share Repurchase in the Even of Hostile Takeover, TSEC Monthly Review, No. 498, 33-59.
Ramaswamy, Krishna, 2002, Company Stock and DC Plan Diversification, working paper, University of Pennsylvania.
Rauh, Joshua, 2005, Own Company Stock in Defined Contribution Pension Plans: A Takeover Defense? Journal of Financial Economics, forthcoming.
Seasholes, Mark and Ning Zhu, 2005, Is There Information in the Local Portfolio Choices of Individuals, working paper, University of California, Davis.
Shu, P.-G., Y.-H. Yeh, and T. Yamada, 2002, The Behavior of Taiwan Mutual Fund Investors-Performance and Fund Flows, Pacific-Basin Finance Journal, 10(5), 583-600.
Zhu, Ning, 2004, The Local Bias of Individual Investors, working paper, University of California, Davis.
Zhu, Ning, 2005, Cost of Time and Household Choice between Direct and Delegated Investments, working paper, University of California, Davis.
Number of Plans
Number of companies
Number of
participants Value of Assets
Time Period
Average percent invested
in employer stock Data Source
Benartzi (2001) 154 N/A 2.57 million $102 billion 1993 23/24* 11-K filings
Brown, Liang and Weisbenner (2005) N/A 1,377 13.17 million $1,377 billion 1991-2000 17 to 45.5 ** 11-K filings
Choi et al. (2005) N/A 3 94,191 $8.4 billion 1993-2000 17.7 Hewitt & Associates
Cohen (2005) N/A 263 N/A $142 billion 1997-2000 17.3 to 20.6*** 11-K filings
Holden and VanDerhei (2003) 46,310 N/A 15,509,185 $619 billion 2002 16******
Employee Benefit Research Institute (EBRI) and Investment Company Institute (ICI)
Huberman and Sengmueller (2004) 335 239 N/A N/A 1994-1998 35-40(1993-1998)
Mitchell and Utkus (2005) 300,592**** N/A 11 million 1,541 billion***** 1993-1998 15.5-17.4 U.S. Department of Labor
U.S. retirement plans (estimate from Mitchell and Utkus
2003) 700,000 N/A 55 million over 2 trillion 2001 N/A
Employee Benefit Research Institute (EBRI) and Investment Company Institute (ICI)
Current Study N/A 442 167,116 $NT 713.98 billion 1998 47 Data Center, Ministry of Finance, Taiwan
(US$ 22.16 billion) Exchange rate: 1 US$=32.22 $NT
Appendix A. Comparison and contrast between current study and existing studies on investment in employer stocks in the United States
* depending on equal weighted vs. weighted by plan contributions; ** 17 percent for unrestricted match and 45.5 percent for company stock match; *** 17.3 percent for conglomerate firms and 20.6 for stand-alone firms; **** 401(k) only, as of 1998; ***** 401(k) only, as of 1998; ****** As of 1998.
Age < 18 7 0.01% 1 0.00% 8 0.00% Age18-25 5,766 4.88% 2,283 4.66% 8,049 4.82% Age 26-64 110,800 93.83% 46,322 94.47% 157,122 94.02% Age > =65 1,508 1.28% 429 0.87% 1,937 1.16% Gender (Male) 69,343 58.72% 26,242 53.52% 95,585 57.20% Tax < 13% 108,963 92.28% 47,439 96.75% 156,402 93.59% Tax ( 13-21% ) 7,378 6.25% 1,407 2.87% 8,785 5.26% Tax ( 21-30% ) 1,103 0.93% 135 0.28% 1,238 0.74% Tax > =31% 637 0.54% 54 0.11% 691 0.41% Total 118,081 49,035 167,116
Employees who invest in listed companies Employees who invest in
employer stocks
Employees who do NOT invest in employer stocks
Figure 1. Cumulative TAIEX Returns between January 1993 and December 2003 0 0.5 1 1.5 2 2.5 3 3.5 Jan-93 Jul-93 Jan-94 Jul-94 Jan-95 Jul-95 Jan-96 Jul-96 Jan-97 Jul-97 Jan-98 Jul-98 Jan-99 Jul-99 Jan-00 Jul-00 Jan-01 Jul-01 Jan-02 Jul-02 Jan-03 Cumulative TAIEX Index Return
Table 1. Investor Sample and Firm Summary Statistics
Panel A provides summary statistics on key firm characteristics. M/B is firm market value to book value ratio where market value is defined as the total number of outstanding shares times stock prices as of December 31, 1998. CAPM beta is calculated by running CAPM regression of firm returns on market index return for the period between January 1, 1996, and December 31, 1998. Size is the market capitalization of the firm, calculated as the number of outstanding shares times the stock price as of (December 31, 1998). Annualized 1-, 2-, and 5-year raw return is the per annum forward-looking return in percentage, for each stock during the period between January 1, 1999, and December 31st of 1999, 2000, and 2003, respectively. Past 1-, 2-, and 5-year raw return is the per annum return for each stock in percentage during the period between January 1 of 1998, 1997, 1994, and December 31, 1998, respectively. Panel B describes how sample investors are selected. The final sample of 167,116 investors includes all listed company employees who invest in Taiwan stock market.
Panel A. Firm Characteristics
Mean Median Standard deviation
M/B 2.97 1.48 0.17
Beta 1.05 0.78 0.02
Size (in thousands of $NT) 107,805 6,827 6,202
Annualized one-year forward return 32.09% 24.48% 3.70%
Annualized two-year forward return -15.82% 33.69% 1.23%
Annualized five-year forward return 1.57% -7.73% 0.68%
Annualized one-year past-return 11.32% -26.49% 1.48%
Annualized two-year past return 53.39% 10.01% 406.00%
Annualized five-year past return 24.82% 10.35% 1.67%
Panel B. Investor Sample Construction
Total Population 23 million
Individuals with identified income 14,541,662
Individuals with Income and salaries 6,676,100
Individuals with Income and salary above basic standard 4,045,360
Investors in listed markets 1,547,163
Employees of listed companies 210,103
Employees of listed companies invest in the listed market 167,116 100.00% employees of listed companies who own company stocks 118,081 70.66% Table 1 Summary Statistics
Percent of employees investing in employers Number of
Table 2 Summary Statistics on Taiwan Investors
Panel A provides sample investor characteristics. Age, income (in $NT), and salaries (in $NT) are obtained from the income file and household member file from the Data Center, Ministry of Finance, Taiwan. Number of shares in lots and value of investment (in $NT) for each individual is obtained from the stock shareholders file from the same source. Senior 05/10/25/50 correspond to employees whose salaries fall into the top 5/10/25/50 percentile within respective employers. Standard deviation is reported in parentheses. Panel B describes Taiwan employees’ tendency to invest in employer stocks. For each group of investors, fraction of employee/investors that invest in employer stocks is calculated as the number of employees who invest in employer stocks divided by the number of employees who invest in the stock market. Similarly, for each group of investors, fraction of portfolio invested in employer stocks is obtained by first calculating the dollar value of each household’s investment in employer stocks divided by total dollar value of the household portfolio, and then calculating the average of such a ratio among all investors from each group.