以GIS為基礎之選擇最理想學校的決策支援系統
79
0
0
全文
(2) 以 GIS 為基礎之選擇最理想學校的決策支援系統 A GIS-Based Decision Support System for the Optimal Selection of Universities. 研 究 生:王潔恩. Student:Kit-Yan Wong. 指導教授:黎漢林. Advisor:Han-Lin Li. 國 立 交 通 大 學 資 訊 管 理 硏 究 所 碩 士 論 文. A Thesis Submitted to Institute of Information Management College of Management National Chiao Tung University in partial Fulfillment of the Requirements for the Degree of Master in Information Management June 2004 Hsinchu, Taiwan, Republic of China. 中華民國九十三年六月.
(3) 以 GIS 為基礎之選擇最理想學校的決策支援系統. 硏究生:王潔恩. 指導教授:黎漢林. 教授. 國立交通大學資訊管理硏究所. 摘. 要. 企業的競爭力在業界中是一個很重要的成功因素;這在學術界也是一樣。每 年一些知名的組織都會提供各教育機構的排名及評比。然而,這些資料僅能提供 參考卻沒法提供與協助決策者最佳的決策。有鑑於此,本硏究旨在提議如何建立 一個不但可以有效率地整理及搜尋含有大量資料的資料庫,而且同時是一個能根 據決策者的需求及偏好來選出最理想結果的決策支援系統。為了能合理地產生最 理想的結果,數學模組會被應用在計算過程中。最後,各物件的空間性關係會由 GIS 介面呈現出來。. 關鍵字:. 決策支援系統、最佳化模組、地理資訊系統. -i-.
(4) A GIS-Based Decision Support System for the Optimal Selection of Universities. Student: Kit-Yan Wong. Advisor: Professor Han-Lin Li. Institute of Information Management National Chiao Tung University. Abstract. Competitiveness is a critical success factor for an organization in the business world; and this is also applicable to the academic world. There are rankings and comparisons for academic institutes produced by renowned organizations each year; however, this information is mere reference and unable to assist users to obtain the optimal decisions. Thus, this research aims to propose a tool that not only re-arranges the vast amount of data for viewing and searching in a more convenient manner, but also acts as a decision support system to generate the most suitable results according to users’ specifications and requirements. In order to produce the optimal results scientifically, mathematical models will be applied in the calculation. Moreover, the spatial relationships between different subjects can be displayed by using a geographic information system (GIS).. Keywords:. Decision. Support. System. (DSS),. Geographic Information System (GIS) - ii -. Optimization. Model,.
(5) Acknowledgements Two years of studies in the Institute of Information Management, NCTU have gone really fast. It has been an indescribable experience in both life and academia for me.. First of all, I would like to express my sincere gratitude to my advisor, Professor Han-Lin Li, for his on-going patience and guidance to allow me to complete this thesis. Then my senior, Chun-Ching Lee, for his suggestions and assistance in the technical part of the thesis; as well as Tony and Jamie, who have worked with me in the lab together for two years. Also, thanks to everyone else in the Operations Research Lab for their supports in every aspect during my study.. Next, I would like to thank my family for their continuous supports, and the opportunity they have given me to pursue what I desire in life. Without them, I won’t be what I am today.. Finally, to all my friends, thank you all for your encouragements and supports. Thank you for your patience and understanding. And thank you for the motivation and courage you have given me during harsh times.. Kit-Yan Wong July 2004 at NCTU. - iii -.
(6) Table of Contents Chinese Abstract ………………………………………………………………. - i English Abstract ………………………………………………………………... - ii Acknowledgement ..................................................................................... - iii Table of Contents ………………………………………………………………. - iv List of Figures ………………………………………………………………….. - vi List of Tables ………………………………………………………………...... - viiii -. Chapter 1 - Introduction ...................................................................................1 1.1. Research Motivation ......................................................................1. 1.2. Research Objectives ......................................................................2. Chapter 2 - Literature Studies ..........................................................................4 2.1 Selection Process of Universities........................................................4 2.2 Admission Process of Universities ......................................................5 2.3. Existing Sources of Information .....................................................7. 2.4. Competitiveness of Schools...........................................................9. 2.5. Decision Support System (DSS) ..................................................10. 2.6. Optimization Model ......................................................................13. 2.7. Geographic Information System (GIS) .........................................16. 2.8. Summary......................................................................................17. Chapter 3 – Mathematical Model ...................................................................19 3.1 Common Weight Model ....................................................................20 3.2 Spherical Model ................................................................................22 3.3 Summary ..........................................................................................24. - iv -.
(7) Chapter 4 - System Design ............................................................................25 4.1. System Architecture .....................................................................25. 4.2. Database Structure ......................................................................28. 4.3. Mathematical Models ...................................................................30. 4.4. GIS Architecture...........................................................................33. Chapter 5 - System Implementation...............................................................36 5.1. Setting Criteria .............................................................................37. 5.2. Select Schools .............................................................................40. 5.3. Generate Basic Information .........................................................41. 5.4. Simulate Results ..........................................................................46. 5.5. Optimize Results ..........................................................................47. 5.6. GIS Display ..................................................................................49. 5.7 Data Query .......................................................................................51 Chapter 6 - Conclusion and Future Research................................................53 6.1. Conclusion ...................................................................................53. 6.2. Future Development.....................................................................55. References ....................................................................................................56 Appendix A Selection of Schools for Students ...........................................58 Appendix B. Rankings and Comparisons of Schools..................................60. Appendix C. Description of the Database Schema .....................................68. -v-.
(8) List of Figures Figure 2.1. Student’s Selection Process of Schools ..………………….. 4. Figure 2.2. Admission Process ………………………….……………….. 5. Figure 2.3. Program Structure for a DSS ……………………………….. 12. Figure 2.4. Decision Making Process ………………………………….... 13. Figure 2.5. The Overall Process of Model Formulation ……………….. 15. Figure 2.6. Architecture for a SDSS ……………………………………... 17. Figure 4.1. Flow Diagram of the System ………………………………... 27. Figure 4.2. Proposed Architecture of the System …………………….... 28. Figure 4.3. Entity Relationship Diagram of the Database …………….. 30. Figure 4.4. Hybrid GIS Architecture ……………………………………... 34. Figure 4.5. Schematic Representation of Spatial Data Files ………….. 35. Figure 5.1. Welcoming Screen …………………………………………... 36. Figure 5.2. Select Criteria ………………………………………………... 38. Figure 5.3. Set Weights …………………………………………………... 39. Figure 5.4. The Weights are Set …………………………………………. 40. Figure 5.5. Select Schools ……………………………………………….. 41. Figure 5.6. Generate Data According to User’s Specifications ………. 42. Figure 5.7. Edit a Record …………………………………………………. 43. Figure 5.8. Record Edited ………………………………………………... 44. Figure 5.9. Merge Two Records …………………………………………. 45. Figure 5.10 Addition of a New Record ………………………………….... 46. Figure 5.11 Simulate Results ……………………………………………... 47. Figure 5.12 Optimize Results ……………………………………………... 48. - vi -.
(9) Figure 5.13 Display with a Sphere ..…………………………………….... 49. Figure 5.14 GIS Display ………………………………………………….... 50. Figure 5.15 A Closer Look of the Selected School ………………………. 51 Figure 5.15 Query According to User’s Specifications …………………. - vii -. 52.
(10) List of Tables. Table 3.1. Variables for the Common Weight Model .……………….... 20. Table 3.2. Variables for the Spherical Model …………………………... 22. Table 4.1. Explanation of Various Variables ………………………….... 31. - viii -.
(11) Chapter 1 - Introduction. 1.1 Research Motivation. Competitiveness has been used to compare different countries’ advantages or disadvantages in selling their products in international markets. It acts as a reference to users of which country is more favourable in terms of living and/or having businesses. A similar measure is applied for universities and business schools in the world, so that students, parents and educators are able to compare the standards and resources of various schools. In order to portray the comparison, various organizations have formulated different rankings in this regards.. Rankings are formulated by renowned universities and organizations every year. For instance, Shanghai Jiao Tong University has formulated a ranking for the top 500 universities in the world; Financial Times produces ranking for the top 100 business schools in the world every year; and Asia Inc. has done a ranking for the top 10 business schools in East Asia. All these provide guidelines and comparisons to both students and universities for school selection and improvement needs.. However, these rankings can only act as a guideline and when a prospective student or a lecturer wishes to compare different schools in more details or with particular preferences; these would be insufficient to provide the. -1-.
(12) necessary results. Therefore, some organizations, such as the Graduate Management Admission Council (GMAT), provide websites to allow students and educators to generate comparisons according to their requirements.. With these information provided as guidelines, students and educators might still have difficulties in finding the most favourable or suitable institute because these are insufficient to make the “best” solution with respect to all the requirements. Therefore, there should be a tool to assist them to input all the available information and to generate decisions with simulation and analysis.. 1.2 Research Objectives. In order to provide a tool to students and educators for better comparison and decision making, a system is proposed in this research; which combines rankings and essential information for more accurate comparisons, and simulation methods to generate a more suitable decision according to their preferences and requirements. The objectives of the proposed system are elaborated below:. (a) Knowledge management The amount of information available from different organizations and universities is vast, users may not be able to obtain all the information they require. This system plans to provide a more complete database of information for users to generate a more complete selection.. -2-.
(13) (b) Simulation methods Besides providing necessary information, simulation methods are provided to allow users to simulate results according to their preferences. These are able to provide a more suitable result which in turn assist them in the decision making process.. (c) Mathematical model A mathematical model, namely LINGO, is implemented into this system to calculate the most suitable result(s). The use of mathematical formulas is aimed to provide an accurate and scientific way to generate decisions.. (d) Map display The geographical locations of different schools are often important for considerations. Very often, students and educators might not know where exactly an institute is; so map display will be provided with the use of GIS tools to provide a reference in locations.. -3-.
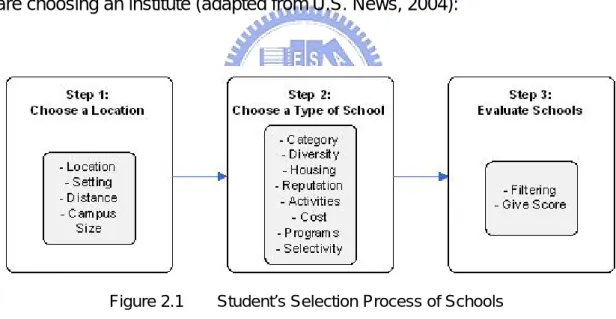
(14) Chapter 2 - Literature Studies. 2.1 Selection Process of Universities. Magazines such as U.S. News often provide guidelines for prospective students to select the most suitable institute(s) according to their specifications and preferences. These guidelines often provide basic information, such as location, cost, campus size, programs, etc, for students to evaluate different schools. Figure 2.1 illustrates the steps that the students can follow when they are choosing an institute (adapted from U.S. News, 2004):. Figure 2.1. Student’s Selection Process of Schools. Prospective students can give each criterion a score, according to the preference and important of each of them, to identify which school(s) is/are the most suitable. An example of a score sheet for calculating the scores of different schools is attached in Appendix A.. -4-.
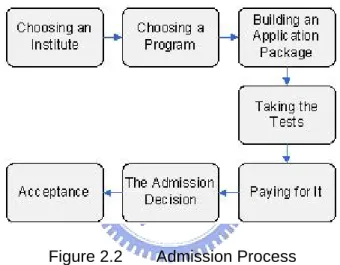
(15) 2.2 Admission Process of Universities. It is time-consuming but yet crucial for students to select the institute that is suitable for them to study further. Some magazines often publish guidelines and references to allow prospective students to acquire the necessary information on the requirements and processes of applying for an institute. Figure 2.2 shows the admission process suggested by Kaplan Inc.. Figure 2.2. Admission Process. (a) Choosing an Institute There are a huge number of institutes nationally and internationally. Students may find it difficult to decide on where to study further, especially if they consider studying overseas, there are even more options. An institute can be chosen according to the location, reputation, tuition fees, requirements and other factors.. -5-.
(16) (b) Choosing a Program After an institute is selected, a program has to be chosen. Beside personal interests of the prospective student, there are some issues of the program that can also be taken into consideration. There issues are culture, rankings, average starting salary, salaries at the 5-year mark, placement rate, location, campus, class profile, cost, specialized and general curriculum, class size and grading policy (Kaplan Inc., 2004).. (c) Building an Application Package An application package implies all the necessary information that may help the student to complete the application successfully. This includes the complete application form, recommendation letters, academic reports, motivation letter, etc.. (d) Taking the Tests When applying for an institute overseas, students are usually required to write language tests and/or related tests. Besides entrance tests required by the specific institutes, other tests such as TOEFL, GMAT or GRE are required according to the institute’s requirements.. (e) Paying for It The tuition fee is one of the main concerns when a student is selecting an institute. When the student is studying away from home, extra costs such as accommodation and transportation have to be considered as well. Thus, student can also consider applying for scholarships and financial aids when necessary. -6-.
(17) (f) The Admission Decision A selection procedure will take place in the institute where possible acceptances are collected. These applications will be considered in more detail so that the most suitable students can be chosen. After this process, a limited number of students will be chosen and will be contacted by the institute.. (g) Acceptance The students who are accepted will receive confirmation letters from the institutes. After this, students should begin to prepare for the necessary documents and materials, and anything that may be useful.. 2.3 Existing Sources of Information. Information on schools rankings and comparisons is produced by renowned universities and organizations in the world on a regular basis. As mentioned earlier, a ranking for the top 500 universities in the world is formulated by Shanghai Jiao Tong University; rankings for the top 100 business schools in the world is produced by Financial Times each year; and recently a ranking for the top 10 business schools in East Asia is done by Asia Inc.. Organizations, such as the Graduate Management Admission Council (GMAT), also provide information and websites for students and educators to search for and compare the business schools in the world. These sources of information can be categorized into two major types:. -7-.
(18) (a) Information on rankings Financial Times produces one of the most accredited rankings for the top 100 business schools in the world each year. Research is done on three broad areas: alumni career progress, diversity and idea generation; and each area contributes a specific percentage towards the total scores. (See Appendix B1) The information produced by Financial Times is broadly used by students and educators around the world as a reference.. Shanghai Jiao Tong University in China has also produced a ranking for the top 500 universities in the world. Scores are given to each university by various renowned organizations and an overall score is given to each of them in order to formulate the final ranking. (See Appendix B2). Lastly, Asia Inc. preformed a ranking for the top 10 business schools in East Asia. Three main areas, namely peer-reputation ranking, school and faculty quality, and student quality, are considered which contribute 20%, 45% and 35% of the final score respectively. (See Appendix B3). (b) Search Engines The Graduate Management Admission Council (GMAT) provides a comprehensive search engine online to allow prospective students and educators to search for and compare different business schools around the world. They can specify the requirements of the business school(s) that they are looking for and the database will generate the matching results for them. In this way, they are able to obtain more details of the business schools that they are interested in. (See Appendix B4) -8-.
(19) 2.4 Competitiveness of Schools. According to the IMD World Competitive Yearbook, there are four dimensions. that. shape. a. competitiveness. environment.. These. are. attractiveness vs. aggressiveness, proximity vs. globality, assets vs. processes, and individual risk taking vs. social cohesiveness. (IMD, 2003) Although these dimensions are applied to countries in the yearbook, they can also be applied to the competitiveness of schools.. (a) Attractiveness vs. aggressiveness Some universities are attractive to students and educators because of their fames and resources. They are often recognized around the world and prospective students would like to study there because of their recognition and accreditation. If other universities that are less well-known want to attract more students and educators, they may need to provide more benefits and facilities to attract them.. (b) Proximity vs. globality Proximity determines the services and facilities that a university provides to its students and prospective students locally; while globality determines its international. recognition. and. resources.. Undoubtedly,. a. university’s. competitiveness will increase if it is internationally recognized; but this may take time and effort to achieve.. -9-.
(20) (c) Assets vs. processes Some universities are rich in assets such as advanced technologies, renowned professors and huge resource base. These provide professional resources to students to assist them in studying. Universities that have fewer assets focus on processes such as skills in order to maintain their positions.. (d) Individual risk taking vs. social cohesiveness Many universities carry out joint programs with other universities so that both universities are able to provide high quality education and resources. Other universities prefer to improve their standards and resources individually so that they can focus more on what is lacking.. 2.5 Decision Support System (DSS). Decision support system is an information system that collects data, manipulates and analyzes them with the aids of models and calculations, and finally displays the results in a manner to help decision makers to generate the most suitable decisions. DSS can be divided into two general categories: data-oriented systems and model-oriented systems (Alter, 1980). Designed to support different purposes, data-oriented systems provide functions for data retrieval, analysis and presentation while model-oriented systems provide calculation, simulation or optimization models for decision making. (Bennett, 1983). - 10 -.
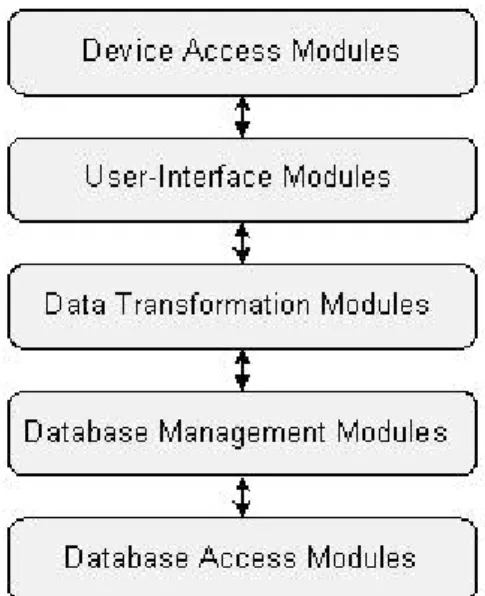
(21) (a) Structure of a DSS During the design of a DSS, there are a number of issues that should be considered. First, a DSS should be designed to support multiple processes because there are different types of decision making processes. Second, a DSS should also support different types of decisions because different types of decisions have different data processing requirements. Third, because decision makers make decisions by relying on conceptualizations, a DSS should provide familiar display tools, such as charts and graphs, to assist in conceptualization and presentation. Forth, a DSS should provide controls to allow decision makers to make decisions directly and according to their own requirements and preferences. (Bennett, 1983). A high-level structure of a DSS is shown in Figure 2.3. There are five major modules in a DSS. In order to minimize computation time and enhance efficiency, the number of module is kept as minimal so that the system will be more effective for both the developers and users. (Bennett, 1983). - 11 -.
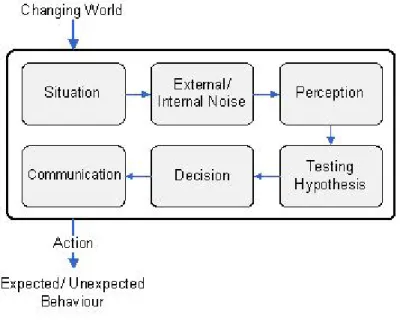
(22) Figure 2.3. Program Structure for a DSS. (b) Decision Making Process The process of decision making is usually influenced by the external environment and the decision maker’s cognition. The decisions are often subjective because it is generated according to the existing circumstances and the decision maker’s preference. However, in order to make a decision effectively, there are a few steps that can be taken. These steps are: (1) problem definition, (2) information gathering, (3) information assessment, (4) choice of decision making, (5) behavioural action and (6) review (MSU Counselling Centre, 2003).. When a decision maker is required to make a decision, he/she usually has to go through a number of processes. The relationship between these processes is shown in Figure 2.4 (Adapted from ISC, 2004).. - 12 -.
(23) Figure 2.4. Decision Making Process. Because of the turbulent environment, a decision maker has to adapt to the current situation through different noises. These noises come from both the environment and the mind of the decision maker; and these affect their perceptions of what is happening in the surroundings. In order to make an appropriate decision, the decision maker should consider different possibilities and create hypothesis to test various assumptions. This process helps to eliminate the possibilities until the final decision is reached. Then the decision maker can communicate with the others who may be influenced by the decision. Finally, actions can be taken to put the decision into practice. (ISC, 2004). 2.6 Optimization Model. The idea of optimization is often addressed when decisions have to be made. In order to provide a scientific approach for formulating optimal or best. - 13 -.
(24) solutions, industrial engineers and mathematicians have begun to build models and investigated for new techniques. When the number of available alternatives is small, simulation methods can be used to generate a meaningful evaluation effectively without too much simplification on each alternative (Murty, 1995).. As there are various optimization models available, it is important to select the one which is the most suitable in describing and solving the specific problem. In order to achieve this, there are five criteria that should be considered. They are performance, realism/complexity, computational costs, information requirements and ease of use (Mulvey, 1979).. With performance, the usefulness of the solution generated by the model is considered. The model should be able to provide information that helps to improve the current problem effectively. Realism or complexity is used to determine how closely related is the model to the real situation. It is to ensure that the model represents the reality appropriately. Hence, the more realism usually requires more complexity in the model. The computational costs imply the money and time that have to be spent for a problem. Ideally, the cost and time spent for computing the problem should be kept as minimal. The amount of information needed to solve the problem is the information requirements of the model. The more information available, the better results the model can produce. However, it is also important to identify and use the information that is critical to the decision making process. Too much unnecessary data can hinder the efficiency and increase the costs of the calculation. Lastly, ease of use ensures that the model is flexible and easy to use for different kinds of - 14 -.
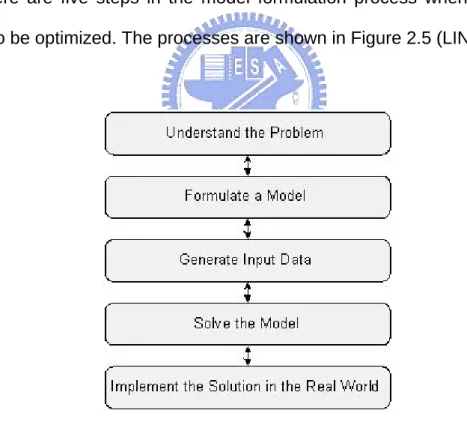
(25) problem. When the criteria of the problem are altered, the model should be able to adapt the changes accordingly. (Bennett, 1983). (a) LINGO LINGO is a form of mathematical programming that uses mathematical procedures to determine optimal allocation of scarce resources. In order to optimize a problem, two requirements are considered; they are limited resources and activities. The use of LINGO allows users to effectively input a model formulation, and solve and modify it until it gives the desired results.. There are five steps in the model formulation process when a problem needs to be optimized. The processes are shown in Figure 2.5 (LINDO, 1999):. Figure 2.5. The Overall Process of Model Formulation. - 15 -.
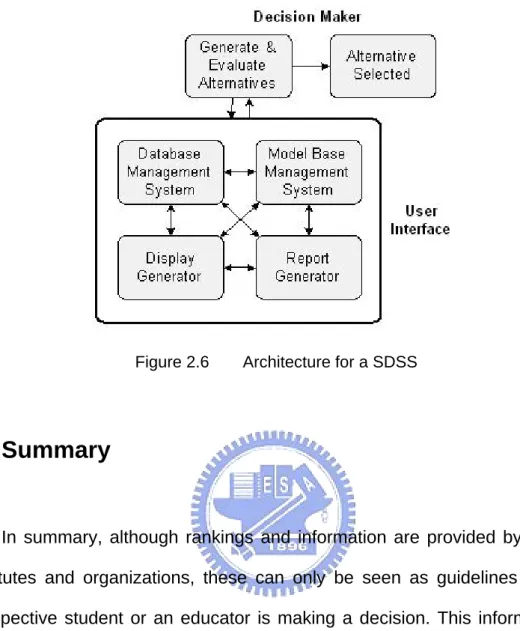
(26) 2.7 Geographic Information System (GIS). By definition, a geographic information system (GIS) is a computer-based information system that captures, models, manipulates, retrieves, analyzes and presents geographically referenced data (Worboys, 1995). GIS is applied widely in fields such as business, communication, defence, education, engineering, government, natural resources, health, transportation and utilities (ESRI, 2004). In Taiwan, GIS is mostly used in disaster prevention and transportation planning. In business environment, when decisions have to be made with reference to geographical information, a system called spatial decision support system (SDSS) will be evolved.. A SDSS allows users to interact with the system via a user interface; operations are done within the system and the final results will be shown in graphical or tabular forms. Inside the system, a database management system (DBMS) is the core that stores and manipulates data. There are also modelling techniques embedded in the system to retrieve the necessary data. The required outcomes are then generated and displayed. A SDSS architecture is shown in Figure 2.6. (Armstrong et al., 1986). - 16 -.
(27) Figure 2.6. Architecture for a SDSS. 2.8 Summary. In summary, although rankings and information are provided by various institutes and organizations, these can only be seen as guidelines when a prospective student or an educator is making a decision. This information is formulated statistically; however, it may be too objective for someone to base his/her decision on. Very often, the best in ranking does not imply the most suitable and favourable for a prospective student. He/She may be more concern with the academic environment or tuition fees, which are often not considered and less critical in statistical research; or some criteria may be more important than the others to him/her but it is not the case in general research data. Moreover, although there are guidelines from books and magazines to assist students to select the suitable schools, these are not efficient as students are required to generate the results themselves. So, there is a need for a tool that allows students and educators to manipulate data and - 17 -.
(28) make decisions according to their preferences.. Thus, this research aims to propose a system that does not only store and retrieve the required data, but also provides simulation and optimization for users to generate results that are most suitable and favourable according to their requirements and preferences. For geographical references and comparisons, a GIS is implemented to provide interaction and display for geographic data and results.. In the following sections, the structure of the proposed system will be discussed in detail. Chapter 3 will discuss the mathematical model behind the optimization process. Chapter 4 will discuss the structure of the system while Chapter 5 will demonstrate the actually operations of the system. Conclusion and suggestions for future development will be discussed in the final chapter.. - 18 -.
(29) Chapter 3 – Mathematical Model. Besides the provision of results according to the specifications and requirements of the users, the system should also be able to generate objective results accordingly. An objective solution usually implies a result that is generated scientifically and mathematically; so that it can be seen as a guideline or reference for users to make a decision.. In this research, a mathematical modelling tool called LINGO will be applied to calculate the optimal solutions for each user’s selection. In the entire optimization process, two models will be used for the calculation. These models are formulated by the professor and fellow students of the Operations Research Lab at National Chiao Tung University, Taiwan.. In a brief summary, the first model calculates the common weight for each criterion chosen by the user; while the second model calculates the x-, y- and z-coordinates for each subject so that it can be mapped onto a sphere with other subjects for comparison. The mapping of the results will show the relationship between each subject and its dissimilarity with the ideal solution.. - 19 -.
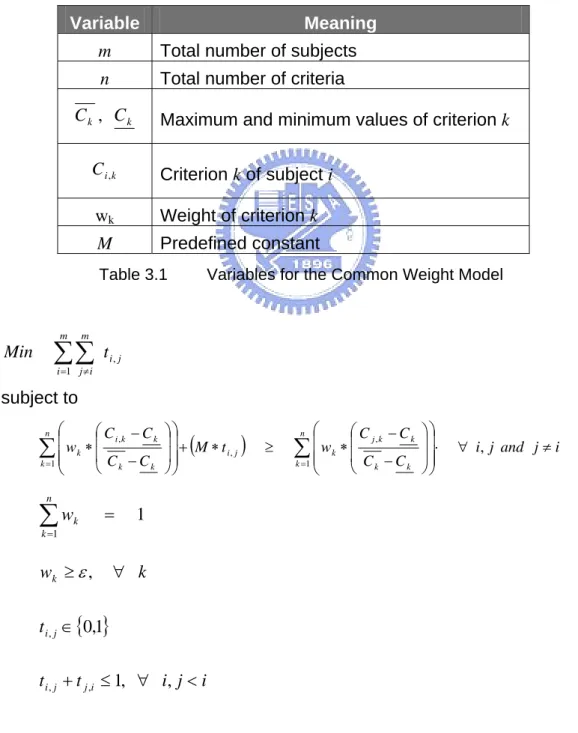
(30) 3.1 Common Weight Model. The common weight model aims to generate the weights for all the criteria mathematically, so that the users are able to obtain an objective result of weightings for each criterion without calculating it manually. The model is illustrated as follows:. Variable. Meaning. m. Total number of subjects. n. Total number of criteria. Ck , Ck. Maximum and minimum values of criterion k. C i ,k. Criterion k of subject i. wk. Weight of criterion k. M. Predefined constant. Table 3.1. m. m. ∑∑. Min. Variables for the Common Weight Model. i =1 j ≠ i. ti, j. subject to ⎛. ∑ ⎜⎜⎜ w n. k =1. k. ⎝. ⎛ C i,k − C k ∗⎜ ⎜ C −C k ⎝ k. n. ∑w k =1. k. =. wk ≥ ε ,. ⎞⎞ ⎟ ⎟ + (M ∗ t ) i, j ⎟ ⎟⎟ ⎠⎠. ≥. ⎛. ∑ ⎜⎜⎜ w n. k =1. ⎝. 1. ∀ k. t i , j ∈ {0,1} t i , j + t j ,i ≤ 1, ∀ i, j < i. - 20 -. k. ⎛ C j ,k − C k ∗⎜ ⎜ C −C k ⎝ k. ⎞⎞ ⎟⎟ ⋅ ⎟ ⎟⎟ ⎠⎠. ∀ i, j and j ≠ i.
(31) During the calculation, a matrix of binary numbers will return. The summation of each row in the matrix represents its rank. The goal of the m. m. ∑∑. objective function, Min. i =1 j ≠ i. t i , j , is to minimize the sum of t for each row in. order to maximize the rank of each subject. Thus, the smaller the sum of t, the higher the rank of the specific subject.. ⎛. ∑ ⎜⎜ w n. For each ti,j, if tj > ti, then tij will equal to 1. If. k =1. ⎛ ⎜w ∑ ⎜ k k =1 ⎝ n. greater ⎛. ∑ ⎜⎜ w n. k =1. ⎝. k. than. ⎛ Ci ,k − C k ∗⎜ ⎜ Ck − Ck ⎝. ⎛ C j ,k − C k ∗⎜ ⎜ Ck − Ck ⎝. ⎞⎞ ⎟⎟ , ⎟⎟ ⎠⎠. ⎞⎞ ⎟ ⎟ is smaller than ⎟⎟ ⎠⎠. ti,j, ⎛. ∑ ⎜⎜ w n. k =1. ⎝. k. will. be. ⎛ C j ,k − C k ∗⎜ ⎜ Ck − Ck ⎝. k. ⎝. 0.. ⎛ Ci ,k − C k ∗⎜ ⎜ Ck − Ck ⎝. ⎞⎞ ⎟ ⎟ is ⎟⎟ ⎠⎠. However,. if. ⎞⎞ ⎟ ⎟ , ti,j, will be 1 and ⎟⎟ ⎠⎠. M * ti,j will be non-zero.. n. The constraint,. ∑w k =1. k. equals to 1; while wk ≥ ε ,. =. 1 , ensures that the sum of all the criteria. ∀ k ensures that the weights are greater than 0,. which makes the calculation of the criteria meaningful. The constraint,. t i , j + t j ,i ≤ 1, ∀ i, j < i , ensures that if i is better than j, then the opposite relationship will not occur.. - 21 -.
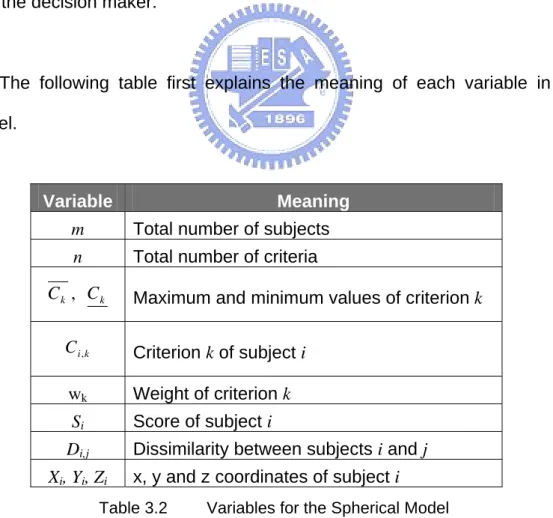
(32) 3.2 Spherical Model. After the rankings and scores are calculated by the model described in previous section, another model will be applied to calculate the x-, y- and z-coordinates for each subject so that the results can be displayed on a sphere for a clear representation and comparison of the results.. On the sphere, the ideal solution is projected on the North Pole. The ideal solution implies the optimal solution that carries the maximum values for each criterion. Thus, the closer a subject is to this ideal point, the more favourable it is to the decision maker.. The following table first explains the meaning of each variable in the model.. Variable. Meaning. m. Total number of subjects. n. Total number of criteria. Ck , Ck. Maximum and minimum values of criterion k. C i ,k. Criterion k of subject i. wk. Weight of criterion k. Si. Score of subject i. Di,j. Dissimilarity between subjects i and j. Xi, Yi, Zi. x, y and z coordinates of subject i. Table 3.2. Variables for the Spherical Model. - 22 -.
(33) The spherical model is illustrated as follows:. m. m. ∑∑ ( X. MIN. i =1 j >i. i. − X j ) 2 + (Yi − Y j ) 2 + ( Z i − Z j ) 2 − Di2, j. subject to n ⎛ S i = ∑ ⎜ wk ⎜ k =1 ⎝. ⎛ Ci ,k − C k ∗⎜ ⎜ Ck − Ck ⎝. ⎛ = 2 ∗ ∑ ⎜ wk ⎜ k =1 ⎝ n. Di , j. ⎞⎞ ⎟⎟ ⎟⎟ ⎠⎠. ⎛ C i ,k − C j ,k ∗⎜ ⎜ Ck − Ck ⎝. ⎞⎞ ⎟⎟ ⎟⎟ ⎠⎠. X i2 + Yi 2 + Z i2 = 1 , ∀ i Yi = 2S i − S i2 , ∀ i. This model assumes that the dissimilarity between two subjects is the distance between them. Dissimilarity is the degree of difference between subjects. It is calculated by minimizing the difference between the straight-line distances of two subjects.. n ⎛ First of all, S i = ∑ ⎜ wk ⎜ k =1 ⎝. ⎛ Ci ,k − C k ∗⎜ ⎜ Ck − Ck ⎝. n ⎛ criterion. Then, Di , j = 2 ∗ ∑ ⎜ wk ⎜ k =1 ⎝. ⎞⎞ ⎟ ⎟ calculates the score of each ⎟⎟ ⎠⎠. ⎛ C i ,k − C j ,k ∗⎜ ⎜ Ck − Ck ⎝. ⎞⎞ ⎟ ⎟ calculates the dissimilarity ⎟⎟ ⎠⎠. between i and j; and the largest possible value for Di,j is. Constraint projected. onto. X i2 + Yi 2 + Z i2 = 1 , ∀ i the. surface. of. ensures that all the points are. the. - 23 -. 2.. sphere.. The. last. constraint,.
(34) Yi = 2S i − S i2 , ∀ i , defines the relationship between the y-coordinates and the scores.. 3.3 Summary. The use of the mathematical models helps prospective students or lecturers to obtain an objective result on the scores of the universities and the selected criteria. The results can be considered as the optimal solution formulated scientifically. During this process, students or lecturers do not need to worry about the influence of their preferences; and the formulated results can be best used to compare the universities in different dimensions.. Moreover, the display of results on a sphere allows students or lecturers to visualize the results for better comparison and interpretation. The North Pole of the sphere represents the ideal location of the result. Thus, the closer a subject is to the North Pole, the better the result is. The display on the sphere also illustrates an important feature of the results; that is the similarity of the results. Results that are similar in terms of their scores and weightings will cluster together on the sphere; while dissimilar results will situate away from the others. In this way, comparison between different schools can be achieved visually.. - 24 -.
(35) Chapter 4 - System Design. 4.1 System Architecture. The system proposed in this research comprises of three modules. They are the optimization module, data query module and GIS module. In a nutshell, the system allows users to select the schools and criteria for comparison, set weights for each criterion, and input them into the optimization model to formulate an objective optimal result. Users are also able to query the most suitable results according to their specifications and requirements from the database management system (DBMS). For a visual display of the spatial relationships between different schools, a GIS tool is used to put the information onto a map.. There are four functions within the system. Firstly, it stores all the information in a database management system (DBMS). The information includes details of the universities, such as their names, origins, co-ordinates and descriptions; types of criteria, their descriptions and calculation methods; as well as score data in which it describes the scores of each criterion of a university. Secondly, it provides selection mechanisms for users to choose the kind of criteria and the specific schools the users would like to view and compare. They could also set different weightings for each criterion according to what they think would be more critical in making decisions. Thirdly, there are calculation mechanisms to simulate and/or optimize the results according to. - 25 -.
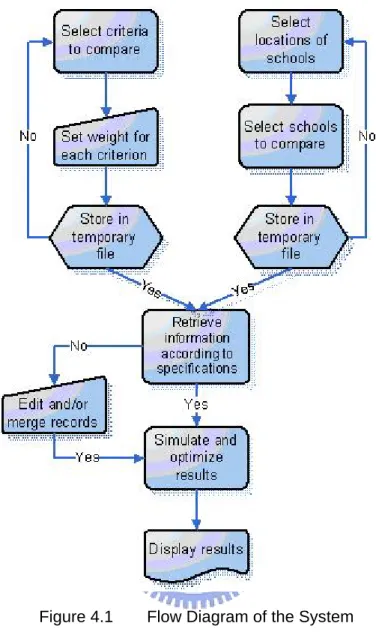
(36) the previous selections. On one hand, to simulate results, the system calculates total scores according to the score of each criterion with its predefined weighting. On the other hand, the selected information can be input in a mathematical model, namely LINGO, to simulate an optimized solution and the solution will be displayed on a sphere for a clear visual presentation. Lastly, the locations of different universities are displayed on a map using a GIS tool for geographical references; and the locations of the universities generated by simulation and optimization models can also be displayed as a reference.. The following tools will be used during the development of the system: y. Borland Delphi, for the overall system. y. LINGO, for the mathematical models. y. MapInfo, for the vector maps of the GIS functions. Figure 4.1 shows the flow of the system. There are a number of processes within the system. Users are able to input their preferences before calculation is done, and results are generated in the forms of reports, spheres or maps.. - 26 -.
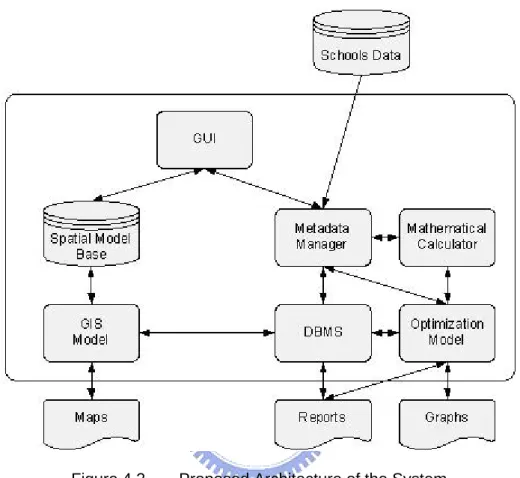
(37) Figure 4.1. Flow Diagram of the System. The architecture of the system is presented in Figure 4.2 (adapted from Hall et al., 1997). Inside the system, the graphical user interface (GUI) acts as a medium for users to interact with the system. It is connected to the database management system (DBMS) that manipulates the data, which is transferred to the mathematical calculator and the optimization model for simulation. Geographical data, such as maps, is stored in the spatial model base and will be retrieved by the GIS model for modelling and display in a later stage. The DBMS and spatial model base is linked so that the simulated results can be linked to their geographical data and be displayed when required. Finally, - 27 -.
(38) maps are produced by GIS modelling, and reports and graphs are produced by the simulated and optimized results.. Figure 4.2. Proposed Architecture of the System. 4.2 Database Structure. The structure of the database is presented in Figure 4.3. The database consists of 4 main types of data: school data, criteria types, descriptions of schools and scores of various criteria of each school. A unique code is assigned to each school record. Each record consists of the name of the university (Name), its location (Locations_Code), its descriptions (Descriptions_Code), its x- and y-coordinates, as well as its vision and mission statements. In this table, the Locations_Code is a foreign key from - 28 -.
(39) another table called Locations that stores the various possible locations of a university. These locations are Africa, Asia, Australia, Europe, Middle East, North America and South America. Each location is assigned to a unique code in this table. The Descriptions_Code is a foreign key from another table in the database called Descriptions that includes information about a particular school such as the type of school, programs it offers, the cost, campus size, etc. Each description is assigned to a unique code in this table.. The Criteria table simply stores the names of each criterion and its descriptions. A unique code is also assigned to each criterion. During the simulation and optimization processes, the scores of the criteria may need to be combined with the scores of other criteria. Some scores can be added together while the other may require obtaining an average score. So, an attribute (CalMethod) is added with the value of 0 implies addition and 1 implies an average.. The last table is the Score table, which stores the scores of the criteria of each university. There are two foreign keys, namely School_Code and Criteria_Code, which identify each criterion of a particular university. The scores of the criteria are included in this table.. A more detailed database schema of this database is included in Appendix C for reference.. - 29 -.
(40) Figure 4.3. Entity Relationship Diagram of the Database. 4.3 Mathematical Models. There are two types of calculations in the system, which have been entailed in Chapter 3. The first calculation is a simulation of the total score with user-defined weightings. The system allows users to select the criteria they would like to compare and set a weight from 1 to 5 to each criterion according to their preferences. So, the more important a criterion is, the higher the weight will become, and the more it counts towards the total score. The second calculation is done with a spherical DEA model that will produce the optimal results and can be displayed on a sphere for visual representation. This model is able to calculate outputs with the given weights and scores, and produces dissimilarity and the coordinates for each record. Details of the two calculation methods are described in the following:. - 30 -.
(41) The following table explains the meanings of various variables used in the two formulas:. Variable. Meaning. m. Total number of schools. n. Total number of criteria. Ck , Ck. Maximum and minimum values of criterion k. C i ,k. Criterion k of school i. wk. Weight of criterion k. M. Predefined constant. Si. Score of school i. Di,j. Dissimilarity between schools i and j. Xi, Yi, Zi. x, y and z coordinates of school i. Table 4.1. Explanation of Various Variables. (a) Simulation model As explained earlier, the simulation process takes the score of each criterion and its weighting given by the users into consideration. The following formula explains how the calculation will be formulated:. n. S=. Σ(w x c ) i. i. i=1. where S is the total score calculated; ci is the criterion; wi is the weight assigned to criterion i; and n is the total number of criteria in the calculation.. - 31 -.
(42) (b) Optimization model There are two steps in the optimization process. The first step is to optimize the ranking of the selected schools. It is calculated by the following formula, as mentioned in Chapter 3: m. m. ∑∑. Min. i =1 j ≠ i. ti, j. subject to ⎛. ∑ ⎜⎜⎜ w n. k =1. k. ⎝. ⎛ C i,k − C k ∗⎜ ⎜ C −C k ⎝ k. n. ∑w k =1. k. =. wk ≥ ε ,. ⎞⎞ ⎟ ⎟ + (M ∗ t ) i, j ⎟ ⎟⎟ ⎠⎠. ≥. ⎛. ∑ ⎜⎜⎜ w n. k =1. ⎝. k. ⎛ C j ,k − C k ∗⎜ ⎜ C −C k ⎝ k. ⎞⎞ ⎟⎟ ⋅ ⎟ ⎟⎟ ⎠⎠. ∀ i, j and j ≠ i. 1. ∀ k. t i , j ∈ {0,1} t i , j + t j ,i ≤ 1, ∀ i, j < i. After the ranking of the schools is formulated, the second step is to put the results onto a sphere for visual representation. The following formula is used to generate the coordinates of each result on the sphere. On the sphere, the North Pole represents the best possible result of each school. Thus, the closer the school is to the North Pole, the more favourable the school is according to the user’s requirements. Beside the comparison of scores, the sphere can also display the idea of similarity of results. When there are results that are similar to each other, it implies that their scores are similar and/or their criteria carry more or less the same importance. So, when these results are shown on the sphere, they will be located close to each other. In other words, the sphere is. - 32 -.
(43) able to show the groupings of similar results. The following formula has been introduced in Chapter 3: m. m. ∑∑ ( X. MIN. i =1 j >i. i. − X j ) 2 + (Yi − Y j ) 2 + ( Z i − Z j ) 2 − Di2, j. subject to n ⎛ S i = ∑ ⎜ wk ⎜ k =1 ⎝. ⎛ Ci ,k − C k ∗⎜ ⎜ Ck − Ck ⎝. n ⎛ Di , j = 2 ∗ ∑ ⎜ wk ⎜ k =1 ⎝. ⎞⎞ ⎟⎟ ⎟⎟ ⎠⎠. ⎛ Ci ,k − C j ,k ∗⎜ ⎜ Ck − Ck ⎝. ⎞⎞ ⎟⎟ ⎟⎟ ⎠⎠. X i2 + Yi 2 + Z i2 = 1 , ∀ i Yi = 2S i − S i2 , ∀ i. 4.4 GIS Architecture. The GIS architecture of the system is built in a hybrid approach. This means the spatial data is stored independently from the non-spatial data. (Worboys, 1995) In the system, geographical data such as the countries and landmarks are stored in a number of spatial data files; and they are linked to the relational database described in Section 4.2. The architecture of the hybrid approach is demonstrated in Figure 4.4.. - 33 -.
(44) Spatial data files. Figure 4.4. Non-spatial data files. Hybrid GIS Architecture. Due to the difference in nature between spatial data files and relational databases, the hybrid architecture helps to manage the two components separately so that performance can be optimized. In order to link the two components, pointers are used to connect the records in the files that have the unique identifiers of tuples in the database.. Spatial data is created in vector formats, where features are represented in terms of points, lines and polygons. In order to manage the data efficiently, different features are drawn in different layers. In other words, the schools are drawn in point layers while the countries are drawn in a polygon layer. As the number of schools is large, it is more convenient to categorize and put them in different layers according to their locations. This is demonstrated schematically in Figure 4.5.. - 34 -.
(45) Points layer B. Points layer A. Polygons layer. Figure 4.5. Schematic Representation of Spatial Data Files. Spatial data is geo-referenced; in other words, the information represented on the layers is geographically accurate. Because the locations of the schools may be too fine to plot onto the map, their locations will be considered according to the cities, provinces or countries where they are situated. The projection of the map uses the Universal Transverse Mercator (UTM), which is one of the most common projection types available.. - 35 -.
(46) Chapter 5 - System Implementation. The system is built according to the design specifications described in the earlier chapters. In order to demonstrate the functionalities and actual implementation of the system, an example will be used below. The example that will be used in the following is the scores of the top 500 universities in the world provided by Shanghai Jiao Tong University this year. The illustration will show how the system functions and responds to users’ selections, as well as the results generated by simulation and optimization in the forms of maps or spheres.. As the user enters the system, the following screen will appear:. Figure 5.1. Welcoming Screen. - 36 -.
(47) After this screen, the user will enter the main system where the application will begin. The entire operation will be demonstrated in the following sections.. 5.1 Setting Criteria. The first step of the operation requires the user to select the criteria he/she would like to view and compare. After the specification the criteria, the user has to set the weight for each criterion according to the importance of it in his/her decision making process. The following screenshots illustrate these operations:. (a) Select the criteria In this example, there are five criteria available for the users to choose from. Suppose the user selects three criteria, namely Score_on_HiCi, Score_on_NS and Score_on_SCI. The screen will look as follow:. - 37 -.
(48) Figure 5.2. Select Criteria. (b) Set the weights After the criteria are chosen, the user is required to set the weight for each criterion according to his/her preference. Click “Set Weights” and the following will be shown:. - 38 -.
(49) Figure 5.3. Set Weights. Click “OK” and the weights will be reflected in the main screen as follow:. - 39 -.
(50) Figure 5.4. The Weights are Set. 5.2 Select Schools. The second step is to select the schools the user would like to compare. Schools are categorized into six groups, including Africa, Asia, Australia, Europe, Middle East, North America and South America. The user is able to choose all the locations in one time, or choose one or more locations at a time. Assume that the user would like to compare the schools in Taiwan available in the database; it would look like the following:. - 40 -.
(51) Figure 5.5. Select Schools. 5.3 Generate Basic Information. After the selection process is completed, the data required will be generated and displayed when “Generate Data” is clicked:. - 41 -.
(52) Figure 5.6. Generate Data According to User’s Specifications. (a) Edit Records At this point, the system carries a number of important functions, which will be discussed later in the following sections. However, before these functions are performed, the user is allowed to alter the displayed data where necessary. He/She can edit the data of a record such as the following:. - 42 -.
(53) Figure 5.7. Edit a Record. The change(s) will be reflected afterwards:. - 43 -.
(54) Figure 5.8. Record Edited. (b) Merge Two or More Records Besides editing records, the user is also allowed to merge the data of two or more schools for simulation of results. Click “Merge” and the following will be shown:. - 44 -.
(55) Figure 5.9. Merge Two Records. The user can either delete the records combined or leave them for comparison. When this process is completed, a new record will be added into the table and the scores for different criteria will be calculated.. - 45 -.
(56) Figure 5.10. Addition of a New Record. 5.4 Simulate Results. When the required information is generated, the total scores of the records can be simulated with the formula described in Section 4.3(a). After the calculation, the records can be sorted in descending order so that the user is able to obtain the “ranking” of the results and see more clearly which school is the most favourable according to his/her selection and calculation.. - 46 -.
(57) Figure 5.11. Simulate Results. 5.5 Optimize Results. Results simulated by the above section provide a subjective solution according to the user’s specific requirements. Weights are set according to the importance with regards to the user. However, a more objective result can be formulated by using the optimization models described in Section 4.3(b). In this model, weights are calculated by the model in order to show the importance of the criteria to the overall scores. Score of each criterion and score of each school are calculated and displayed as shown in Figure 5.12.. - 47 -.
(58) Figure 5.12. Optimize Results. After the scores are calculated, dissimilarity between different schools can be calculated by the model. Based on the three calculated factors, namely the weight, score and dissimilarity, the model will perform the final calculation where the x-, y- and z-coordinates of a specific school are calculated. The results will be displayed on a sphere for better visual representation. Figure 5.13 shows how the results are shown on a sphere.. - 48 -.
(59) Figure 5.13. Display with a Sphere. On the sphere, point 0 (the North Pole) is the ideal solution of the calculation. Thus, the close the point to point 0, the more favourable the school is. Furthermore, the display also shows the similarity between various schools. The schools that have similar characteristics will cluster together on the sphere.. 5.6 GIS Display. In order to allow users to have an idea of where the schools are, the schools are plotted onto a map using GIS tool. For better display and easier management of data, schools are plotted in different layers according to where. - 49 -.
(60) they are located. The eight layers include schools in Africa, Asia (excluding Taiwan), Australia, Europe, Middle East, North America, South America and Taiwan. The users are able to view one or more or all of those layers at the same time. They are also able to view the data of a specific layer in a table form by selecting the desired layer. As the schools are displayed on the map as points, users cannot view the details of a particular school. There is an “InfoTool” ( ) that allows users to click on any point and its data will be shown in the “School Selected” section on the right. This is shown in Figure 5.14.. Figure 5.14. GIS Display. The selected school is marked on the map, in order to view its location clearly, the map can be zoomed in for a clearer result:. - 50 -.
(61) Figure 5.15. A Closer Look of the Selected School. 5.7 Data Query. Finally, users are able to ask the system to generate the schools that are the most suitable according to their specifications and preferences. They can choose the location, campus size, category, diversity, housing option, cost, reputation and selectivity process of different schools and the system will generate the results that fulfil all the requirements. The process is illustrated in Figure 5.15.. - 51 -.
(62) Figure 5.16. Query According to User’s Specifications. - 52 -.
(63) Chapter 6 - Conclusion and Future Research. 6.1 Conclusion. This research aims to propose a system that is easy to use and user-friendly so that users can follow the step-by-step procedures and generate the most favourable results according to their requirements and preferences. Users are only required to select the criteria and the subjects they wish to compare, and the results will be simulated. The initial goals of this research are to provide a tool that combines rankings and essential information for better comparison and decision making, and also to use simulation methods to generate a more suitable decision according to users’ preferences and requirements.. (a) Advantages The system is easy to use. The interfaces are designed such that they are simple and easy to understand. Users are only required to select what they wish to compare and in what forms they wish to see the results.. It provides a medium to store all the necessary information in a DBMS. Data can be retrieved easily with simple selection procedures. However, it is not a mere database, it provides simulation and optimization mechanisms for users to generate results to assist them in decision making.. - 53 -.
(64) In order to optimize results, mathematical models are implemented so that it provides precise and logical results according to users’ preferences. Results can also be shown on maps which allow users to obtain a visual comparison of subjects and where the subjects are situated.. The system is flexible because it can be applied to any subjects. It can be used in fields such as real estates, selection of location for any new construction, etc. There is no limitation for the subjects as long as there are different criteria to be taken into consideration.. (b) Disadvantages Although the database can store a large number of data within the system, the mathematical model may not be able to calculate a large number of data at one time. If the number of data in the calculation is too large, it may take a long computation time for the model to generate the optimal results.. Users are unable to create new criteria or subjects. This is done to protect the original dataset so that the original research data can be maintained.. (c) Summary In summary, the system has achieved what was proposed in the beginning of this research. It has provided a tool that combines essential information from different sources in a DBMS and provides simulation and optimization mechanisms to generate the most favourable results for the users. It applies mathematical models to calculate accurate solutions and GIS tool to provide a visual representation of locations. - 54 -.
(65) 6.2 Future Development. As mentioned earlier, the system can be applied to other applications besides schools selection and comparison. When it does apply to other applications, alterations might be required to adapt to the specific application.. However, there are still rooms for enhancements in the system. For instance, the mathematical models can be re-evaluated to provide more effective and efficient calculations. The GIS section can be more interactive where users are allowed to add or remove features from the maps. The system can be more flexible so that users are able to add more criteria and/or subjects during the selection and comparison processes.. - 55 -.
(66) References. . Alter, S.L., “Decision Support Systems: Current Practice and Continuing Challenge”, Addison-Wesley, 1980.. . Armstrong, M.P., Densham, P.J. & Rushton, G., “Architecture for a Microcomputer-Based Decision Support System”, Proceedings of the 2nd International Symposium on Spatial Data Handling, International Geographical Union, Williamsville New York, pp. 120-131, 1986.. . Asia. Inc.,. “Asia’s. Best. MBA. Schools”,. http://www.asia-inc.com/April04/MBAschools_apr.htm, April 2004. . Bennett, J.L., “Building Decision Support Systems”, Addison-Wesley, 1983.. . ESRI, “Industries Overview”, http://www.esri.com/index.html, 2004.. . Financial Times, “The top 100 full-time international MBA programs”, http://news.ft.com/management/mba, 2004.. . Graduate Management Admission Council (GMAT), “Find Your Program: Internet Search”, http://www.mba.com/mba/default.htm, 2004.. . Hall, G.B., Bowerman, R.L. & Feick, R.D., “GIS-Based Decision Support Architecture and Applications for Developing Countries”, University of Waterloo, Ontario, http://www.fes.uwaterloo.ca/Tools/docs/saj/pdf, 1997.. . Institute. for. Management. Development. (IMD),. “IMD. World. Competitiveness Yearbook, 2003”, June 2003. . Institute for Strategic Clarity (ISC), “The Decision Making Process Map”, http://www.instituteforstrategicclarity.org/dmp.htm, 2004.. - 56 -.
(67) . Kaplan. Inc.,. “The. Admissions. Process”,. Kaplan. Inc.,. http://www.kaptest.com/repository/templates/ArticleInitDroplet.jhtml, 2004. . LINDO, “Optimization Modeling with LINGO”, 3rd Edition, LINDO Systems Inc., 1999.. . MSU Counselling Centre, “Overview of Decision Making”, Michigan State University, http://www.couns.msu.edu/self-help/decisions.htm, 2003.. . Mulvey, J.M., “Strategies in Modeling: A Personnel Scheduling Example”, Interfaces, 1979.. . Murty K.G., “Operations Research: Deterministic Optimization Models”, Prentice Hall, 1995.. . U.S.News, “College Planner - 2004 Edition America’s Best Colleges”, U.S.News, 2004.. . Worboys, M.F., “GIS: A Computing Perspective”, Taylor & Francis, 1995.. - 57 -.
(68) Appendix A Selection of Schools for Students This score sheet allows prospective students to evaluate each potential school. Various factors are provided and students can rank each of them on a scale of 1 to 5, with 5 being the highest score and 1 being the lowest. The school with the highest overall score will be considered as the most suitable selection.. The score sheet is adapted from U.S.News, 2004.. School: __________________________________ Location. Score (1-5). Region Setting (urban, suburban, rural) Distance from home Academics Rigor of coursework Choice of majors Class size and student/faculty ratio Academic facilities Quality of professors Access to professors Campus Life Size of student body Diversity of student body Student attitudes about the school Social life Extracurricular activities Housing options Atmosphere Costs Affordability Access to grant/aid - 58 -. Notes.
(69) Career Preparation Range of internships Quality of career services Other Factors. Total Score. - 59 -.
(70) Appendix B Rankings and Comparisons of Schools. 1.. Financial Times MBA2004 – The top 100 full-time international MBA programs (Financial Times, 2004). The following page shows a complete research result of the top 100 full-time international MBA schools in 2004 formulated by the Financial Times.. - 60 -.
數據
+7
Outline
相關文件
The main objective of this system is to design a virtual reality learning system for operation practice of total station instrument, and to make learning this skill easier.. Students
Therefore, this research paper tries to apply the perspective of knowledge sharing to construct the application model for the decision making method in order to share the
In this paper, a decision wandering behavior is first investigated secondly a TOC PM decision model based on capacity constrained resources group(CCRG) is proposed to improve
In order to serve the fore-mentioned purpose, this research is based on a related questionnaire that extracts 525 high school students as the object for the study, and carries out
This research is based on the consumer decision- making theory, to study what may affect people to join the army force and the intention to enlist oneself in military force.. We
In order to have a complete and efficient decision-making policy, it has to be done with multi-dimensional reflection and analysis; The multi-criteria decision-making analysis
The purpose of this research is using the UET to combine the GIS(Geographic Information Systems)and utilize the resources characteristic and land of understanding, to look for
The major task of the research is to provide a sort of automatic system solution for producing the RF Power module in fast and accuracy by several core module from
