國 立 交 通 大 學
機 械 工 程 學 系
博 士 論 文
脈衝式電源之平板型介電質常壓電漿束特性分析及
利用其後放電區域的應用研究
Characterization of a Planar Atmospheric Dielectric Barrier Discharge
Driven by a Pulsed-Power Source and Its Applications Using
Post-Discharge Jet Region
研 究 生: 江明鴻
指導教授: 吳宗信 博士
脈衝式電源之平板型介電質常壓電漿束特性分析及利用其後放電
區域的應用研究
Characterization of a Planar Atmospheric Dielectric Barrier Discharge
Driven by a Pulsed-Power Source and Its Applications Using
Post-Discharge Jet Region
研 究 生: 江明鴻 Student: Ming-Hung Chiang
指導教授: 吳宗信 博士 Advisor: Dr. Jong-Shinn Wu
國 立 交 通 大 學
機 械 工 程 學 系
博 士 論 文
A Thesis
Submitted to Department of Mechanical Engineering College of Engineering National Chiao Tung Iniversity
In partial Fulfillment of the Requirements
for the Degree of Doctor of Philosophy in Mechanical Engineering June 2010
Hsinchu, Taiwan
脈衝式電源之平板型介電質常壓電漿束特性分析及利用其後放電區域的應
用研究
學生:江明鴻 指導教授:吳宗信 博士
國立交通大學機械工程學系博士班
中文摘要
中文摘要
中文摘要
中文摘要
本論文探討自組的脈衝式電源驅動的平板型介電質常壓電漿束 (氮氣為主),及電漿 束的後放電區域特性分析及其應用之研究。特性分析主要包括拍照直接觀察、電性量測 (電壓及電流波型,電漿吸收功率) 、光譜量測 (OES 及 FTIR) 、氣體溫度量測 (熱電偶 線及 OES)與臭氧濃度量測。量測顯示純氮 DBD 電漿產生大量亞穩態氮氣[N (A u) +∑
3 2 ], 逐漸加入氧氣後產生大量臭氧。同時,根據後放電區域量得的光譜特性,吾人成功地瞭 解相關電漿化學反應機制。了解這些反應機制對表面處理相關的應用是相當重要的。此 研究使用氮氣為主的平板型介電質常壓電漿束的應用研究包括 PP 薄片親水性改質、ITO 玻璃表面清潔、E. coli/ B. subtilis 殺菌與 B. subtilis 孢子滅菌。結果顯示這些特性對於應 用有很大效率影響,簡單的敘述如下。 在靜止 PP 薄片表面親水特性處理方面,以氮氣為主 (氧氣/氮氣比小於 1%) 平板型 DBD 常壓電漿束處理後 (處理距離小於 10 mm,處理時間 5 秒),接觸角從原先 103 度 降至 30 度。處理後 PP 薄片靜置 24 小時後接觸角恢復至 40 度。同樣電漿條件對靜止的 ITO 玻璃表面處理,結果顯示 (氧氣/氮氣比) 有兩個區域接觸角從 84 度降至 20-30 度。 第一區域為氧氣/氮氣比小於 0.05%,處理距離 6-16 mm。第二區域為氧氣/氮氣比超過0.06%,處理距離 2-10 mm。量測結果顯示: (1) 於後放電出口 10 mm 內,亞穩態氮氣 [N (A u) +
∑
3 2 ]與臭氧光分解反應均扮演主要角色對於表面處理,而相關電漿反應過程需再 進一步研究釐清。(2) 遠離大於後放電出口 10 mm,對於 ITO 玻璃清潔及 PP 薄板表面 親水改質,亞穩態氮氣[N (A u) +∑
3 2 ]扮演了主要角色。XPS 量測結果發現,經過平板型 DBD 常壓電漿束處理後的試片隨 O/C 比增加而更加具有親水性。 在 E. coli 與 B. subtilis 殺菌的應用,結果顯示與前人在放電區域的研究相較後放電區 滅菌效率仍然相當優異,毫無遜色。主要關鍵在於電漿放氣體中需要加入氧氣以產生足 夠量的臭氧增加滅菌效率。此外使用空氣平板型介電質常壓電漿束的滅菌效率比氧氣電 漿好,可能與空氣電漿中含有氮氧化物與臭氧同時對滅菌作出貢獻。在 E. coli 與 B. subtilis (107 CFU/mL)存活率實驗方面,經過氧氣及空氣電漿處理小於 18 次 (等效停留 時間 1.8 秒),距離介於 4-20 mm,均可以使菌種達到完全失活(inactivation)。在 B. subtilis 孢子(105 – 107 spore/mL)滅菌實驗方面,經過加入 2%四氟化碳的空氣電漿對孢子滅菌處 理效果相當優異(單純空氣電漿處理幾乎完全無效)。經過 2%四氟化碳的空氣電漿處理小 於 10 次 (等效停留時間 1 秒),距離 14 mm,均可以達到完全滅菌。間接證明應有不少 高化學反應性自由基 (如氟原子),存在放電及後放電區域。 總結來說,本博士論文在實驗上針對氮氣為主的平板型介電質常壓電漿束自組架設 完成及有效的特性分析,成功地利用其後放電區域進行應用的研究。與前人大部分直接 利用放電區域進行分析與應用的研究相較,本論文相對是較獨特的。同時在論文最後章 節亦條列出建議未來應進行研究的研究部分。Characterization of a Planar Atmospheric Dielectric Barrier Discharge
Driven by a Pulsed-Power Source and Its Applications
Using Post-Discharge Jet Region
Student: Ming-Hung Chiang Advisor: Dr. Jong-Shinn Wu
Department of Mechanical Engineering
National Chiao Tung University
Abstract
Development, characterization of a planar atmospheric-pressure nitrogen-based dielectric barrier discharge driven by a quasi-pulsed (distorted sinusoidal) power source and its applications using the post-discharge jet region are presented in this PhD thesis. The characterizations of the DBD system included the measurements of the direct image visualization, the electrical properties (current-voltage curve and power absorption), the optical properties (optical emission spectra and FTIR), the gas temperatures (thermocouple and optical emission spectra), and the ozone concentration. The measurements showed that abundant mestastable nitrogen [N (A u)
+
∑
3
2 ] was generated in the pure nitrogen DBD, while abundant ozone was created as long as the oxygen was added. Specially, observation of optical emissions in the post-discharge jet region was successfully explained by several kinetic mechanisms, which is important in understanding the fundamental mechanism in surface modification. This DBD system was then applied to several important applications, which included the modification of hydrophilic property of PP film, the surface cleaning of ITO glass, the inactivation of E. coli, B. subtilis and the sterilization of B. subtilis spore. Results of applications showed that the developed DBD system was highly effective in these
applications under proper operating conditions, which they are briefly described in the following in turn.
For the stationary PP films, the contact angle (CA) decreases dramatically from 103° (untreated) to less than 30° (treated) with a wide range of O2/N2 ratios (< 1%) and treating
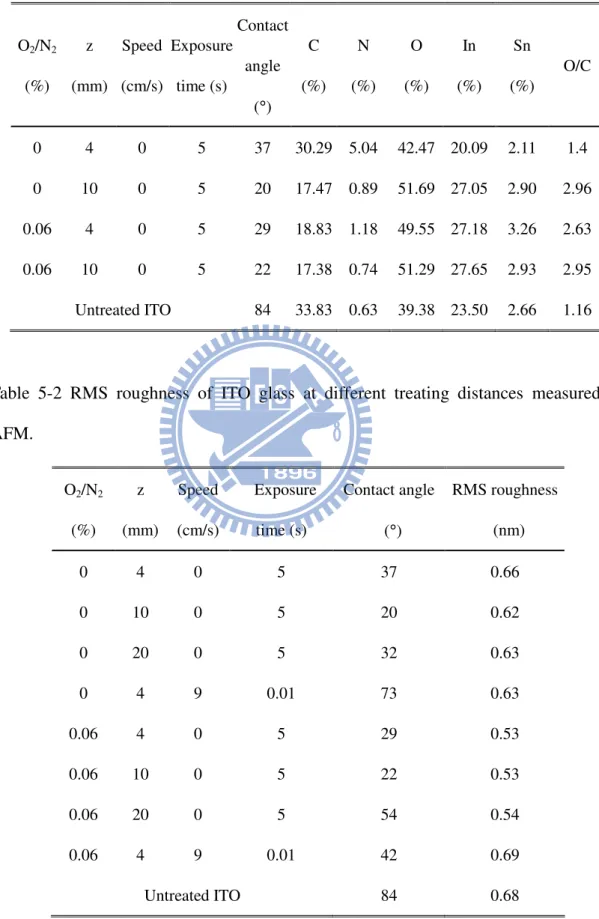
distances (< 10 mm). In addition, the CA can still be maintained at ~40° after 24 h of the aging test. For the stationary ITO glass, show that there exists two distinct regimes with lower CAs in the range of 20-30° (84° for untreated). The first one was the regime with an oxygen addition of less than 0.05% and a treating distance in the range of 6-16 mm. The second one was the regime with an oxygen addition larger than 0.06% and a treating distance in the range of 2-10 mm. The measurements showed that: 1) in the near jet downstream location (z<10 mm), both the metastable N2 [N (A u)
+
∑
3
2 ] and ozone photo-induced dissociation played dominant roles in surface modification, although their relative importance was unclear and requires further investigation; and 2) in the far jet downstream location (z>10mm), when the ratio of O2/N2 was small, only the long-lived metastable N2 [N (A u)
+
∑
3
2 ] played a major role
in ITO cleaning and PP film surface modification. XPS measurements showed that improved hydrophilic property was obtained after DBD jet treatment with increasing O/C ratio.
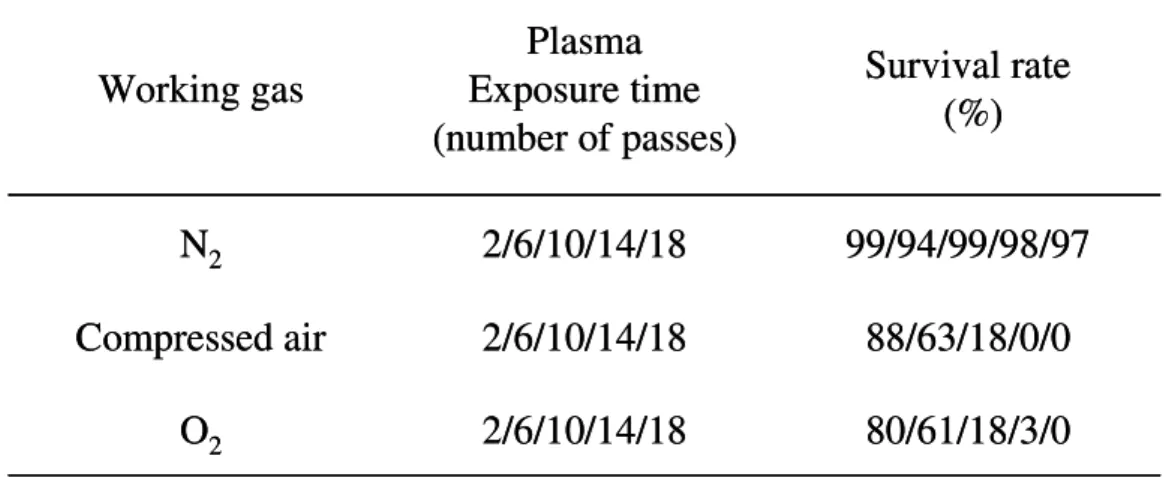
For the inactivation of E. coli and B. subtilis, the results showed that the post-discharge jet region is very efficient in inactivating these two bacteria as previous studies using the discharge region, should the working gas contains appreciable oxygen addition, which in turn generates abundant ozone. In addition, the inactivation is more effective by using compressed-air APPJ as compared to that by oxygen APPJ, possibly through the assistance of nitrous oxide existing in the former. Results of survival rate show that both E. coli and B. subtilis bacteria (up to 107 CFU/mL) can be effectively inactivated using less than 18 passes (1.8 seconds of residence time in total) of exposure to the post-discharge jet region of compressed air and oxygen discharges at different treating distances in the range of 4-20 mm. For the sterilization of B. subtilis spore, the results showed that addition of only 2% CF4 into
the air DBD is found to be very effective, which was otherwise very ineffective using the pure air DBD. It was found that the CF4/air (2%) APPJ treatment resulted in the efficient
inactivation of the B. subtilis spores after 10 passes (residence time: 1.0 s) exposures for treatment distances (14 mm). Indirect evidence showed that highly reactive atoms, such as F atoms, were generated in the discharge and in the post-discharge jet region.
In conclusion, in the current thesis, a simple yet very effective planar nitrogen-based DBD system under atmospheric-pressure condition is presented and characterized experimentally. It was successfully applied using its post-discharge jet region, which was rarely seen in the literature, for surface modification and inactivation/sterilization. Recommendations for the future study are also outlined at the end of the thesis.
誌
誌
誌
誌
謝
謝
謝
謝
本文得以順利完成,首先要感謝指導教授 吳宗信博士四年來的悉心指導與訓練,並 引導至脈衝式電源之平板型介電質常壓電漿束研究的領域,謹在此致上最誠摯的謝意。 同時承蒙成功大學工科系 楊瑞珍博士、交通大學機械系 陳慶耀博士、中原大學化工系 魏大欽博士、台灣大學化工系 徐振哲博士及大葉大學生科系 吳建一博士五位口試委員 與國衛院醫工組 林峰輝博士提供寶貴的經驗與建議,亦深表謝意。 研究進行中,感謝洪捷粲學長,博士後研究郭啟良博士,同學孟樺、沅明,學弟育 宗、逸民、皓遠、其璋、柏村、瑞祥及大葉大學生科系學弟奕宏、柏榮、峻傑,在實驗 上的建議與幫忙,在此致上十分的謝意。 最後僅將本文獻給我的母親,小妹佳玲,小女彥璇及無怨無悔的老婆璧華,謝謝他 們在四年求學期間給我的鼓勵與支持。 2010 年 6 月 28 日於新竹交通大學氣熱與電漿物理研究室Table of Contents
中文摘要
中文摘要
中文摘要
中文摘要………..…….i
Abstract….………...………..iii
誌
誌
誌
誌
謝
謝
謝
謝……..………..…………...vi
Table of Contents ...vii
List of Tables... xi
List of Figures ...xiii
Nomenclature... xvi
Chapter 1. Introduction... 1
1.1 Background and Motivation ...1
1.1.1 Advantages of Atmospheric-Pressure Discharges...1
1.1.2 Classification of Atmospheric-Pressure Discharges ...1
1.1.2.1 Plasma Torch...2
1.1.2.2 Plasma Jet...2
1.1.2.3 Corona Discharge ...2
1.1.2.4 DBD...3
1.1.3 Comparison of Plasma Sources ...3
1.2 Literature Review of Dielectric Barrier Discharges...4
1.2.1 Types of DBD...4
1.2.2 Discharge and Post-Discharge Regions ...5
1.2.3 Surface Hydrophilic Modification ...5
1.2.4 Bacteria Sterilization/Inactivation ...7
1.3 Specific Objectives and Organization of the Thesis ...9
Chapter 2. Experimental Methods ... 11
2.1 Test Facility...11
2.1.1 Planar DBD APPJ... 11
2.1.2 Cooling System... 11
2.1.3 Distorted Sinusoidal Voltage Power Supply ...12
2.1.4 Gas Supply System ...12
2.1.5 Venting Chamber...13
2.1.6 Non-Stationary Stage...13
2.2 Instrumentation ...13
2.2.1 Thermocouples for Post-Discharge Gas Temperature Measurement...14
2.2.2 Measurement of Electric Properties ...14
2.2.2.2 Power Absorption Estimation based on Lissajous Figure ...15
2.2.3 OES for Spectral Measurements ...15
2.2.3.1 Species Identification...15
2.2.3.2 Gas Temperature Measurements ...16
2.2.3.3 2nd Order Radiation in OES spectra ...16
2.2.4 Measurement of Ozone Concentrations ...17
2.2.4.1 Ozone Monitor ...17
2.2.4.2 FTIR...17
2.2.5 Contact Angles for Surface Energy Measurement ...18
2.2.6 AFM for Surface Profile Measurement ...18
2.2.7 SEM for Bacteria Morphological Observation...18
2.2.8 XPS for Surface Chemical Composition ...19
2.2.9 Visualization of Planar DBD APPJ ...19
2.2.10 Sample Preparation of Bacteria ...19
2.2.10.1 E. coli and B. subtilis...20
2.2.10.2 B. subtilis Spore...20
2.3 Test Conditions ...21
2.3.1 Surface Modification Applications...21
2.3.1.1 PP Film Modification ...21
2.3.1.2 ITO Glass Surface Cleaning ...22
2.3.2 Bacteria Sterilization/Inactivation Applications ...22
2.3.2.1 E. coli and B. subtilis...22
2.3.2.2 B. subtilis Spore...23
Chapter 3. Characterization of the DBD APPJ ... 25
3.1 Visualization of the Post-Discharge Region...25
3.2 Electrical Properties ...26
3.2.1 Current and Voltage Waveforms...26
3.2.2 Power Absorption Estimation Based on Lissajous Figures ...28
3.3 Optical Properties ...28
3.3.1 Species Identification...28
3.3.1.1 Nitrogen-Based DBD APPJ...28
3.3.1.2 Air-Based DBD APPJ ...30
3.3.1.2.1 Pure Air DBD ...30
3.3.1.2.2 Air/Carbon Fluorine Mixture DBD ...31
3.3.2 Gas Temperature Measurements ...31
3.4 Concentration Measurements of Ozone ...32
3.4.2 Infrared Absorption Spectra of the Post-Discharge Region ...33
3.5 Summary of Chapter 3 ...33
Chapter 4. Hydrophilic Modification of the PP Film Using Nitrogen-Based
DBD APPJ ... 35
4.1 Contact Angle Measurements ...35
4.1.1 Stationary Conditions...35 4.1.2 Non-Stationary Conditions ...36 4.2 Aging Effect ...37 4.3 AFM Analysis ...38 4.4 XPS Analysis...38 4.5 Discussion ...39 4.6 Summary of Chapter 4 ...41
Chapter 5. Surface Cleaning of the ITO Glass Using Nitrogen-Based DBD
APPJ... 43
5.1 Contact Angle Measurements ...43
5.1.1 Stationary Conditions...43 5.1.2 Non-Stationary Conditions ...44 5.2 XPS Analysis...44 5.3 AFM Analysis ...44 5.4 Discussion ...45 5.5 Summary of Chapter 5 ...46
Chapter 6. Inactivation of the
E. coli and the B. subtilis Using Air-Based
DBD APPJ ... 48
6.1 Appearance of Petri Dish for E. coli and B. subtilis ...48
6.2 SEM images of Untreated and Treated E. coli and B. subtilis ...49
6.3 Discussion ...50
6.4 Summary of Chapter 6 ...51
Chapter 7. Sterilization of the
B. subtilis Spore Using Air/Carbon Fluorine
DBD APPJ ... 52
7.1 XPS Analysis of PP Film...52
7.2 Appearance of Petri Dish for B. subtilis Spore ...53
7.3 SEM Images of Untreated and Treated B. subtilis Spore ...53
7.4 Summary of Chapter 7 ...54
Chapter 8. Conclusion and Recommendations for Future Study ... 55
8.1 Summaries of the Thesis ...55
8.1.1 Characterization of the Planar DBD APPJ ...55
8.1.3 Surface Cleaning of the ITO Glass ...57
8.1.4 Inactivation of E. coli and B. subtilis...58
8.1.5 Sterilization of B. subtilis Spore...58
8.2 Recommendations for Future Work ...59
References ……….61
Appendix A. Removal of the 2nd Order Radiation in OES Spectra... 67
Appendix B. Tolerance Analysis... 73
List of Tables
Table 1-1 Breakdown voltages of the plasma discharge...75
Table 1-2 Densities of charge species in the plasma discharge ...75
Table 1-3 Densities of oxygen species in the discharges ...75
Table 1-4 Main plasma reaction ...76
Table 2-1 Summary of the DBD-APPJ system...77
Table 2-2 Summary of the instrumentation. ...78
Table 2-3 Element peak line information of NO (220-280 nm) ...80
Table 2-4 Test conditions of planar DBD APPJ in PP film modification application. ...81
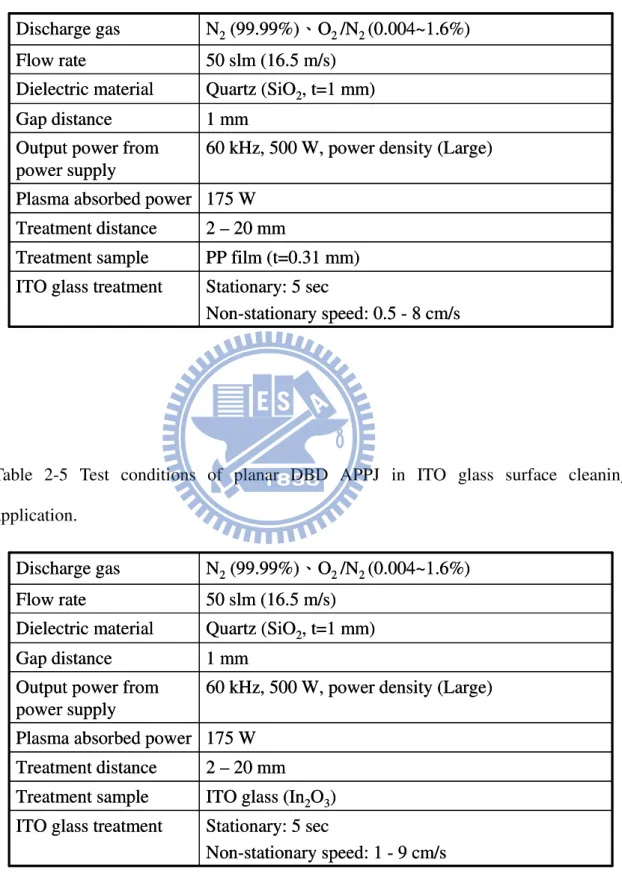
Table 2-5 Test conditions of planar DBD APPJ in ITO glass surface cleaning application. ....81
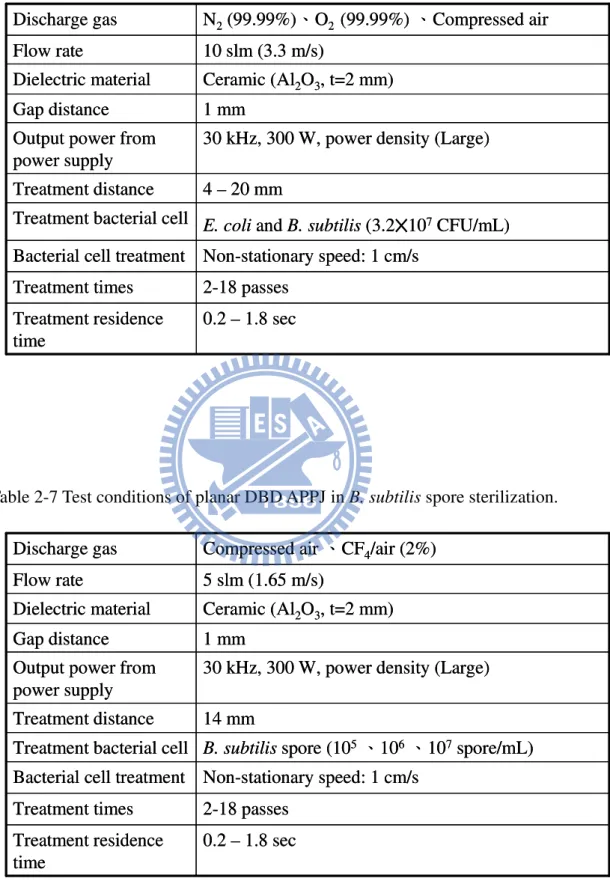
Table 2-6 Test conditions of planar DBD APPJ in E. coli and B. subtilis sterilization. ...82
Table 2-7 Test conditions of planar DBD APPJ in B. subtilis spore sterilization...82
Table 3-1 FTIR measured absorption peak value of 1055 cm-1 for ozone in the post-discharge region for N2, compressed air, and O2 discharges in z distance 4-20mm. ...83
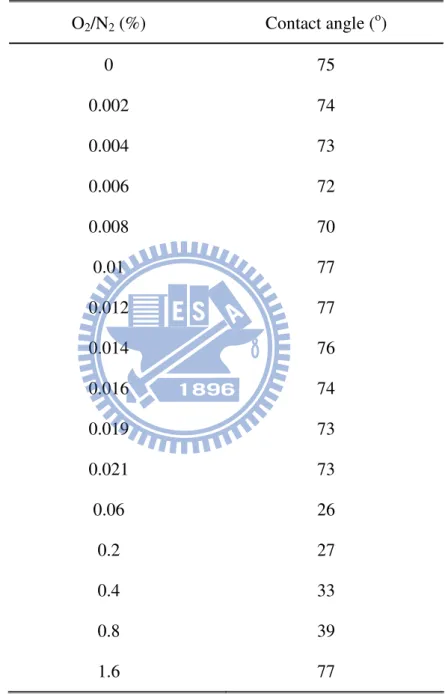
Table 4-1 Measured contact angles of non-stationary PP film at different O2/N2 ratios after plasma treatment (z=2 mm, v= 0.5 cm/s)...84
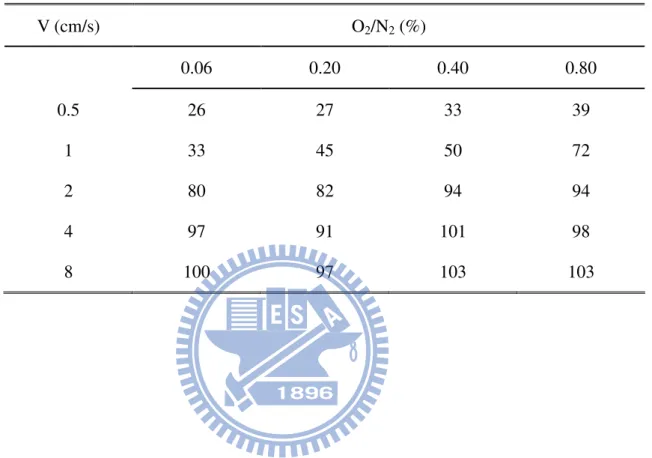
Table 4-2 Measured contact angles of non-stationary PP film at four typical O2/N2 ratios after plasma treatment (Z=2 mm, v= 0.5-8 cm/s)...85
Table 4-3 RMS roughness of PP film at different treating distances measured by AFM ...85
Table 4-4 Atomic percent concentration and ratio and percentage peak area of XPS C1s core level spectra of untreated PP and atmospheric- pressure plasma treated PP...86
Table 5-1 XPS measured chemical composition of ITO glass after planar-DBD APPJ treatment ...87
Table 5-2 RMS roughness of ITO glass at different treating distances measured by AFM. ....87
Table 6-1 Summary of survival rates under different treatment distances for E. coli bacteria (107 CFU/mL) on petri dishes for different gas discharges. Other discharge parameters: gas flow rate=10 slm, stage moving speed=1cm/sec, output power from power supply=300 W, gap=1 mm, and Z=20 mm...88
Table 6-2 Summary of survival rates under different treatment distances for B. subtilis bacteria (107 CFU/mL) on petri dishes for different gas discharges. Other discharge parameters: gas flow rate=10 slm, stage moving speed=1cm/sec, output power from power supply=300 W, gap=1 mm, and z= 20 mm. ...88
Table 7-1 Chemical composition of PP film after planar-DBD APPJ treatment (30 kHz, output power from power supply=300 W) ...89
Table 7-2 Summary of survival rates under different bacterial number treatments for B. subtilis spore bacteria on petri dishes for air discharges. Other discharge parameters: gas flow rate=5 slm, stage moving speed=1cm/sec, output power from power supply=300 W, gap=1 mm, and Z=14 mm. ...89
Table 7-3 Summary of survival rates under different bacterial number treatments for B. subtilis spore bacteria on petri dishes for CF4/air (2%) discharges. Other discharge parameters:
gas flow rate=5 slm, stage moving speed=1cm/sec, output power from power supply=300 W, gap=1 mm, and Z=14 mm...90
List of Figures
Fig. 1-1 Types of atmospheric-pressure plasma: (a) transferred arc; (b) plasma jet; (c) corona discharge; and (d) dielectric barrier discharge. ...91 Fig. 1-2 Typical electrode arrangements of barrier discharges: (a) planar reactor; (b) cylindrical reactor; and (c) pin-to-plate discharge...92 Fig. 2-1 Schematic sketch of a planar DBD APPJ...93 Fig. 2-2 Image of the venting chamber. ...94 Fig. 2-3 Typical Lissajous figure for a parallel-plate DBD APPJ: (a) distorted-sinusoidal voltage power supply; and (b) AC power supply...95 Fig. 2-4 Schematic sketch of a planar DBD APPJ with OES measurement...96 Fig. 2-5 Line identification of O2/N2 DBD plasma OES spectrum (180-280 nm). ...97
Fig. 2-6 Observed and simulation emission spectra of NO-γ. The gas temperature in the calculated spectrum was 360 K (∆λ=0.01 nm, output power from power supply= 500W)...98 Fig. 2-7 Air DBD plasma infrared spectrum in 800-3600 cm-1 (air plasma) (output power from power supply=300 W). ...99 Fig. 3-1 Images of post-discharge region of APPJ with discharge gases consisting of (a) N2, and
(b) N2+0.06% O2 (output power from power supply=500 W). ...100
Fig. 3-2 Bottom view of discharge region for N2, compressed air and O2 discharges. Other
discharge parameters: gas flow rate=10 slm; output power from power supply=300 W; and gap=1 mm. ...101 Fig. 3-3 Side view of post-discharge region for N2, compressed air and O2 discharges. Other
discharge parameters: gas flow rate=10 slm; output power from power supply=300 W; and gap=1 mm. ...102 Fig. 3-4 Typical current and voltage waveforms for N2 discharge (60 kHz)...103
Fig. 3-5 Typical current and voltage waveforms for various gas discharges: (a) N2; (b) O2; and
(c) compressed air (output power from power supply=300 W). ...105 Fig. 3-6 Typical Lissajous figure for a parallel-plate DBD APPJ of N2 discharge (output power
from power supply=500 W). ...106 Fig. 3-7 Lissajous figure for a parallel-plate DBD APPJ for various gas discharges driven by a distorted sinusoidal voltage power supply (30 kHz, output power from power supply=300 W): (a) N2; (b) O2; and (c) compressed air. ...108
Fig. 3-8 Optical emission spectra in (a) 180-500 nm; and (b) 500-900 nm for post-discharge plasma (60 kHz, 50 SLM) ...109 Fig. 3-9 Distributions of typical NO-γ UV emission intensity (236.6 nm, photon energy: 5.2 eV) as functions of downstream distance and O2/N2 (%) in post-discharge region (60 kHz,
50 SLM, output power from power supply=500 W)... 110 Fig. 3-10 Optical emission spectrum in the (a) UV and (b) VIS regions for the post-discharge
plasma (output power from power supply=300 W). ... 111 Fig. 3-11 Optical emission spectrum in 180-380 nm for the discharge plasma (output power from power supply=300 W). ... 112 Fig. 3-12 Temperature distributions in the post-discharge jet region of N2, compressed air and
O2 discharges (output power from power supply=300 W)... 113
Fig. 3-13 Distributions of O3 concentration (ppm) as functions of downstream distance and
O2/N2 (%) in post-discharge region (60 kHz, 50 SLM, output power from power
supply=500 W). ... 114 Fig. 3-14 Infrared spectra of post-discharge region for N2, compressed air, and O2 discharges in
the 800-3600 cm-1 (30 kHz, 10 SLM, output power from power supply=300 W). . 115 Fig. 4-1 Distribution of measured contact angles as a function of downstream distance and ratio of O2/N2 (%) (60 kHz, 50 SLM, output power from power supply=500 W)... 116
Fig. 4-2 Contact angle of water on PP film versus various gases, Z-directions and aging times treated in the N2+O2 DBD environment (output power from power supply=500 W).
... 117 Fig. 4-3 XPS scan spectra of (a) untreated PP film and (b) N2+0.06% O2 treated PP at Z= 6 mm
(output power from power supply=500 W)... 118 Fig. 4-4 C1s spectra of (a) untreated PP film and (b) N2+0.06% O2 treated PP at Z= 6 mm. 119
Fig. 5-1 Measured contact angle of ITO glass surface (stationary) as functions of z coordinate and O2/N2 (%) after 5 seconds of plasma jet treatment (60 kHz, 50 SLM, output power
from power supply=500 W). ...120 Fig. 5-2 Measured contact angle of ITO glass surface (non-stationary) as functions of z-coordinate and O2/N2 (%) after (a) pure N2 and (b) 0.04 % O2/N2 plasma jet
treatment (60 kHz, 50 SLM, absorbed power=175W)...121 Fig. 6-1 Appearance of E. coli petri dishes after incubation with different exposure times with different exposure distances and times (number of passes) to compressed air plasma. Other discharge parameters: gas flow rate=10 slm, output power from power supply=300 W, and gap=1 mm...122 Fig. 6-2 Appearance of B. subtilis petri dishes after incubation with different exposure distances and times (number of passes) to compressed air plasma. Other discharge parameters: gas flow rate=10 slm, output power from power supply=300 W, and gap=1 mm. ..123 Fig. 6-3 SEM images of various microorganisms with a parallel-plate DBD APPJ using compressed air: (a) untreated E. coli; and (b) plasma-treated E. coli. ...124 Fig. 6-4 SEM images of various microorganisms with a parallel-plate DBD APPJ using compressed air: (a) untreated B. subtilis; and (b) plasma-treated B. subtilis. ...125 Fig. 7-1 Appearance of B. subtilis spore petri dishes after incubation with different exposure times to different bacterial numbers (spore/mL) and times (number of passes) to compressed air plasma. Other discharge parameters: gas flow rate=5 slm; output power from power power=300 W; and gap=1 mm. ...126
Fig. 7-2 Appearance of B. subtilis spore petri dishes after incubation with different exposure times to different bacterial numbers (spore/mL) and times (number of passes) to CF4/air (2%) plasma. Other discharge parameters: gas flow rate=5 slm; output power
from power supply=300 W; and gap=1 mm...127 Fig. 7-3 SEM images of various microorganisms with a parallel-plate DBD APPJ using compressed CF4/air (2%): (a) untreated B. subtilis spore; and (b) plasma-treated B.
Nomenclature
D
Venting chamber diameter (mm)
L Venting chamber length (mm)
E
Mean energy deposited into gas in a full cycle
P
Plasma-absorbed power
Z Vertical direction
f Quasi-pulsed
frequency
Chapter 1
Introduction
1.1 Background and Motivation
1.1.1 Advantages of Atmospheric-Pressure Discharges
Recently, atmospheric-pressure (AP) plasmas have attracted great attention [Schütze
et al., 1998; Chaudhary K et al., 2003; Laroussi M et al., 2007], mainly because of their distinct advantages as compared to low-pressure plasmas. These advantages include: 1) their relatively low cost since there is no need to use expensive vacuum equipment, 2) the reduced practical operational time; and 3) the possibility for large-scale continuous in-line processing. To make the most of the AP plasmas, a thorough understanding of all aspects of AP plasmas is of critical importance, in terms of both their fundamental physics and their practical applications.
1.1.2 Classification of Atmospheric-Pressure Discharges
Atmospheric-pressure plasmas overcome the inherent disadvantages of low-pressure plasmas [Schutze et al., 1998; Becker et al., 2004; Moravej et al., 2006]. Thus, there exists great interest in atmospheric-pressure plasmas, as can be seen increasing publications from several international conferences on this subject during the past five years. There are several ways of classifying atmospheric-pressure plasmas. In this section, we have adopted the one that was adopted by Schutze et al. [1998]. Types of atmospheric-pressure plasmas include: transferred arc and plasma torch, corona discharge, dielectric barrier discharge (DBD), and atmospheric-pressure plasma jet, as shown schematically in Fig. 1-1. They are briefly introduced in the following in turn.
1.1.2.1 Plasma Torch
Plasma torch (see Figure 1-1a) is one type of thermal equilibrium plasmas, in which the temperatures of the electrons, ions and neutrals are approximately the same (10,000-20,000 K); the other three kinds are all non-thermal (“cold”) non-equilibrium plasmas, in which the electron temperature (104-105 K) is much higher than that of the ions or neutrals (~300K). The former is limited in applications such as welding and gasification of materials due to its high temperature, while the latter are more widely used due to their low temperature. In addition, one of the major problems of plasma torch is the relatively short life of the electrode, caused by the discharge arc attached on it.
1.1.2.2 Plasma Jet
Atmospheric-pressure plasma jets (see Figure 1-1b) often consist of two coaxial electrodes through which a mixture of rare gases flow (He or Ar). By applying 13.56 MHz (or higher frequency) RF power to the central electrode at a voltage in the range of several hundred volts, the gas discharge can be ignited and maintained over a fairly large range of conditions. Normally, the atmospheric-pressure plasma jet is operated in the “abnormal glow” regime, in which the voltage increases with increases in current, while the low-pressure plasma is often operated in the “normal glow” regime, in which the voltage remains constant with increases in current [Schutze et al., 1998]. Atmospheric-pressure plasma jets have been demonstrated to be very useful in surface cleaning, thin-film deposition and biomedical applications, among others.
1.1.2.3 Corona Discharge
needle within a distance of ~0.5 mm, where the electric field is very large and highly non-uniform. The corona discharge is considered a Townsend discharge or a negative glow discharge depending on the field and potential distribution. Micro-discharges and streamers are generated in the plasma. The operating voltage is in the range of 10-50 kV. Major applications of the corona discharge are in the field of photocopying.
1.1.2.4 DBD
A DBD (see Figure 1-1d), which is often called a “silent discharge,” consists of two electrodes with at least one coated with dielectrics. The discharge is maintained through a series of micro-discharges or “streamers”, which last for 10-100 ns and are randomly distributed in space and time. The operating voltage is in the range of 5-25 kV. As for N2,
high breakdown voltage (35kV/cm) can be used in atmospheric-pressure DBD applications within a few mm discharge gap range. Rare gases like helium and argon have generally been used [Walsh et al., 2006; Jung et al., 2007] in RF atmospheric-pressure plasma jets, dramatically increasing operating costs. Thus, the efficient use of cheaper gases, such as nitrogen or air, has become an important issue in practical applications. In N2 DBD plasma, there exists abundant metastable N2
[N2(A3
∑
u+)]. Note that the metastable N2 [N2(A3∑
u+)] energy state is 6.2 eV abovethe ground state and its lifetime is ~13 sec [Fridman et al., 2004]. It is very reactive towards saturated hydrocarbons and can efficiently transfer about 6.2 eV to these molecules to generate dissociative triplet states that break C-H (4.2 eV) and C-C bonds (3.8 eV) [Herron 1999; Klages et al., 2008].
1.1.3 Comparison of Plasma Sources
plasma densities, respectively, for different plasma sources [Schutze et al., 1998]. More detailed comparisons of these plasma sources, which have been omitted here for the sake of brevity, can be found in [Schutze et al., 1998]. The arc and plasma torch exhibit the highest plasma density (1016-1019 cm-3) in the discharge region but, as they are types of thermal plasma, both medical and polymer material surface modification applications are limited. The DBD plasma density (1012-1015 cm-3) in the discharge region is another good choice as a non-thermal plasma source. The DBD parallel-plate-type discharge, although representing the simplest geometrical configuration, has the potential for applications that require large-area uniformity. In addition, Table 1-3 shows a summary of the typical densities of oxygen species for different types of discharges. The densities of oxygen-related species generated from DBD (e.g., 1018 cm-3 for long lifetime ozone species) are the highest for these plasmas, making them suitable for bio-medical sterilization/inactivation applications. The main types of plasma reactions are listed in
Table 1-4 [Eliasson 1991].
1.2 Literature Review of Dielectric Barrier Discharges
As our particular interest was in developing the DBD in atmospheric-pressure condition, the following literature surveys reflect this focus.
1.2.1 Types of DBD
A typical DBD in an atmospheric-pressure planar-electrode arrangement is as shown in Figure 1-2 [Wagner, et al., 2003; Lee et al., 2005]. Because of a capacitive coupling of the insulating material to the gas gap, a barrier-discharge can be driven by either an alternating feeding voltage or by a pulsed DC voltage. The high voltage is connected to the top electrode, while the bottom electrode is grounded. There are other types besides
planar electrodes, such as the cylindrical-barrier-discharges [Xu et al., 2006] used for sterilization applications and pin to parallel electrodes with lower breakdown voltage characteristic for increased etching rate [Lee et al., 2005]. In addition, the parallel-plate-type discharge, although having the simplest geometrical configuration, has the potential for applications requiring large-area uniformity.
1.2.2 Discharge and Post-Discharge Regions
One of the major disadvantages of AP plasma is the small distance between the two electrodes (order of mm) [Takaki et al., 2005; Lee et al., 2005; Laroussi et al., 2004], which makes their application difficult and inflexible, although it has been shown that thin foil can still be used directly in the discharge region [Meiners et al., 1998]. Thus, the use of the post-discharge jet region of atmospheric-pressure plasma may possibly remove this difficulty, although the corresponding plasma would likely be much weaker than that in the discharge, or even entirely disappear. However, the use of the post-discharge region can render the plasma source as a stand-alone module, which could be very useful in practical applications [Herrmann et al., 1999; Xiong et al., 2008].
1.2.3 Surface Hydrophilic Modification
PP films have found numerous applications in industry and our daily lives. Most applications requires hydrophilic surface for strong adhesion with some other surfaces. Thus, how to effectively improve the hydrophilic property of the PP film at a reduced cost becomes an important issue. In the past, most of the studies using nitrogen APPs for PP film surface modification have directly placed the test object in the discharge region [Kwon et al., 2005; Wang et al., 2008; Akishev et al., 2008], while relatively few
have made the most of the post-discharge region. These studies have shown that the application of the nitrogen DBD discharge is relatively efficient in modifying PP film from a highly hydrophobic (90.8o) into a relatively hydrophilic state (56.5o) after a short period of exposure (e.g., 3 s) in the discharge [Morent et al., 2008]. In addition, XPS analysis has shown that when polar functional groups, such as C-O, C=O and COO, have been introduced onto the PP film surface after the AP nitrogen plasma treatment, the percentage of oxygen-containing groups has increased dramatically from 2.998% to 9.039% [Kwon et al., 2005]. Akishev [Akishev et al., 2005] argued that the polar groups were mainly formed from the abstraction of hydrogen in the secondary carbon atom, and that the formation and disappearance rate of the polar groups became equilibrated. They also found that the decomposition of the C1s peak for PET C=O/N–C=O bonds appeared and the C–O/C–N bonds proportionally increased with N2 treatment.However,
there seems to be no systematic study available for the existence of the functional groups on PP film using a post-discharge region of nitrogen APPs.
ITO coated glass is an important component in a TFT-LCD panel. Before depositing TFT thin film, effective and fast surface cleaning is necessary. In the past decade, excimer xenon-based lamps with 172 nm emission have been shown to effectively remove most of the organic compound on the ITO glass. However, the cost of operation is relatively high since the life time of an excimer lamp is comparably short (~1,000 hours) and expensive. Thus, how to effectively clean the surface of the ITO glass at a reduced cost becomes an important issue. Recently, Iwasaki et al. [2007-2008] have shown that the post-discharge region of a remote-pulse nitrogen DBD with ~0-0.2% of oxygen added, could be used for the surface cleaning of mobile ITO glass surfaces, and also that it could dramatically increase the corresponding hydrophilic property. A kinetic mechanism was proposed to elucidate the cleaning process of the nitrogen AP jet through the measured concentrations of the reactive species, including the reactive
nitrogen species (NO) and the reactive oxygen species (O, O3), by using optical
diagnostics; in their study, neither a detailed description of the pulsed power supply (e.g. voltage waveform and discharge current) nor the quality of the discharge gases were provided. In addition, the measured OES data seemed not properly interpreted through any plausible kinetic mechanisms. Thus far, no other study has systematically verified the results or investigated the effect of the treatment distance (between the exit of the DBD and the surface to be cleaned or treated), both of which are important in practical applications.
1.2.4 Bacteria Sterilization/Inactivation
Conventional sterilization technologies, such as autoclaves, ovens, chemicals such as ethylene oxide (EtO), and radiation (gamma rays) [Holyoak et al., 1996; Lucas et al., 2003] heavily rely on the irreversible metabolic inactivation or breakdown of vital structural components of microorganisms. Althoughsome of these methods which apply direct heating may be effective in inactivating microorganisms, they are often highly inefficient in terms of time and cost (high energy consumption). Sterilization/inactivation using non-thermal plasmas represents one of the most promising technologies. Most applications of plasma technology for sterilization/inactivation require the direct contact of the discharge with the bacterial cells [Moisan et al., 2001] because abundant chemically active ions, electrons and radicals exist in the discharge. The use of low-pressure plasma may be helpful, whereby the electrode distance can be quite large. A larger space between the electrodes in low-pressure plasmas means easier handling of the treated bacteria, as compared to those using atmospheric-pressure plasmas [Deng et al., 2006; Laroussi et al., 2002], in which the electrode distance is very small (order of mm). However, handling the test
pieces requires the break of the vacuum, which is costly and time-consuming.
Deng et. al has show a 10-min exposure to the atmospheric-helium plasma plume led to a 4-log reduction of the Bacillus subtilis spores, whereas the use of the less than 0.2-log reduction [Deng et al., 2006]. Lee et. al has show D-values were 14 min for B. subtilis spore. The sterilizing effect of the Atmospheric-pressure cold helium/oxygen plasma is not due to UV light, which is known to be the major sterilization factor of APCP, but instead results from the action of reactive oxygen radicals [Lee et. al, 2006]. Lerouge’s group investigated B. subtilis spore sterilization by O2/CF4 plasma under
low-pressure condition, which exhibited much higher efficacy than all other gases or gas mixtures tested (O2, O2/Ar, O2/H2 and CO2), with more than a 5 log decrease in 7.5
min, as compared with a 2 log decrease with pure oxygen at an operation pressure of 80 mTorr [Lerouge et al., 2000]. Note B. subtilis spore represents one of the toughest organisms, which can tolerate extreme environmental conditions for more than 10 years, and has been often used as a target bacterium to test whether the sterilization method is effective or not. However, the creation of low-pressure plasmas requires the use of vacuum equipment, which is very expensive and rather impractical in bio-medical applications.
Recently, sterilization/inactivation using non-thermal atmospheric-pressure plasmas (APP) has attracted tremendous attention [Sharma et al., 2006; Sun et al., 2007]. The major advantages of applying atmospheric-pressure plasmas may include, among others
[Hippler et al., 2008]: 1) generating abundant bactericidal active agents (chemically active radicals, high kinetic energy ions, electrons, and UV photons); 2) producing a fairly low-temperature gas stream which is in direct contact with the bacteria or container; 3) a shorter operating time in the order of seconds or minutes; 4) easy removal of inactivated bacteria and viruses on the treated surface through jet gas streams; and 5) producing essentially no hazardous substances.
1.3 Specific Objectives and Organization of the Thesis
Based on the preceding discussion of the related studies of DBD atmospheric-pressure plasma, it was clear that further experimental study was needed to provide a better fundamental understanding of the properties of DBD atmospheric-pressure plasma and will thus lead to more effective applications.
Therefore, the specific objectives and organization of this thesis were summarized as follows:
1. To develop a parallel-plate DBD operating under the atmospheric-pressure condition that is driven by a high-voltage bipolar quasi-pulsed power supply. (Chapter 2)
2. To study nitrogen-based and air-based DBD planar plasmas, which include measuring the electrical properties of the discharges, the spectrum intensity distributions and temperature distributions in the post-discharge region, to name a few. (Chapter 3)
3. To interpret the measurements in Item No. 2 to understand the plasma physics in the discharge and post-discharge jet regions. (Chapter 3)
4. To study the surface modification of PP film by applying the post-discharge jet region of a nitrogen-based planar DBD. The effects of oxygen addition into the nitrogen DBD and treating distance between the DBD and PP film on the hydrophilic properties were investigated, including the surface hydrophilic properties, roughness and chemical composition (elements and functional groups). Optical emission intensity from the excited species and ozone concentration in the post-discharge region were measured and then used to explain the measured contact angles for the stationary and non-stationary PP
films. (Chapter 4)
5. To study nitrogen, DBDs with and without the addition of trace oxygen were then applied to clean stationary and non-stationary ITO glass using the post-discharge jet region at different treating distances. Measurements of the concentrations of several reactive species at various spatial locations under different levels of oxygen addition to nitrogen were then used to elucidate the cleaning process. (Chapter 5)
6. To apply a parallel-plate DBD atmospheric-pressure plasma jet (APPJ) to inactivate two typical bacteria, E. coli and B. subtili, in the post-discharge jet region. Various inexpensive working gases, including pure N2, pure O2 and
compressed air, were tested and the discharges were characterized accordingly. (Chapter 6)
7. To apply a parallel-plate DBD atmospheric-pressure plasma jet (APPJ) to inactivate B. subtilis spore in the post-discharge jet region. Various working gases, including compressed air and air mixed with Carbon Fluorine (CF4), were tested and the discharges were characterized accordingly. (Chapter 7)
Chapter 2
Experimental Methods
2.1 Test Facility
The test facility for a planar DBD APPJ measurement in this study included: a planar DBD APPJ, cooling system, distorted sinusoidal voltage (quasi-pulsed) power supply, gas supply system, venting chamber and non-stationary stage. Table 2-1
summarizes various components of the DBD system. Each of these arrangements is described in the following in turn.
2.1.1 Planar DBD APPJ
Figure 2-1 illustrates the schematic diagram of a parallel-plate DBD atmospheric-pressure plasma jet (APPJ) along with a gas supply system and the instrumentation for voltage and current measurements. This APPJ consisted of two parallel copper electrodes (50 × 50 × 8 mm each) with embedded cooling water. Each electrode was covered with a ceramic plate 70 × 70 × 2 mm for the inactivation/sterilization application, and a quartz plate 70 × 70 × 1 mm for the surface hydrophilic modification application. The 5 mm dielectric plates extruded from the end of the electrodes (in the flow direction), and prevented the electrode assembly from arcing. The distance between the two dielectric plates (ceramic/quartz) was 1 mm throughout the study. The assembly of electrodes and dielectrics was then covered by a Teflon insulation layer to provide safety and prevent arcing problems during operation.
The water flow of the cooling electrode was delivered by a cooling system. The inlet cooling temperature control was 20 ± 2℃ for the electrode and the water pressure control was 1.6 ± 0.1 kg/cm2. The high voltage and ground electrode used separate cooling pipes which are controlled separately. The diameter of the cooling pipe was 1/4”.
2.1.3 Distorted Sinusoidal Voltage Power Supply
This DBD assembly was powered by a distorted sinusoidal voltage (quasi-pulsed) power supply (Model Genius-2, EN Technologies Inc.). This power supply facilitated the adjustment of the frequency (20~60 KHz), power density (low/middle/large), peak current (max. 4A), peak voltage (max. 15 kV), and power (max. 2 kW). The distorted sinusoidal voltage power facilitated generation of high voltage with high dv/dt to enhance the discharge intensity and thus radical generation. Another feature of the output electrical waveform is the distorted sinusoidal voltage waveform which can minimize the occurrence of arc (or streamer) to ensure stable power output according to asymmetric load and sudden load change caused by the plasma.
2.1.4 Gas Supply System
Various working gases flowed between the parallel plates, including N2 (99.99%),
O2 (99.99%), O2/N2 (0.004-1.6%), O2 (99.99%), compressed air (produced from an
oil-less compressor) and CF4/air (2% of CF4). The flow rates were controlled by
manually adjustable flowmeters. The gas was introduced through two holes at the top of the parallel plate assembly and then passed through a sieved aluminum plate containing 480 holes (0.5 mm in diameter each) for pressure redistribution, followed by a convergent section with a length of 10 mm to coincide with the channel gap size (1 mm)
at the end of the section.
2.1.5 Venting Chamber
In setting up the planar DBD APPJ in a venting chamber for operation safety, the cylindrical chamber size was D600 × L700 (mm), as shown in Figure 2-2. The planar DBD APPJ was mounted on the top side of the chamber. The exhaust pipe (diameter 210 mm) was mounted on the bottom side of the chamber. The venting flow was produced by a variable blower which was driven by a 1 HP-3phase induction motor (Tatung EBFC) with frequency converter (TECO 7300CV, 1~60 Hz). The blower (frequency 8 Hz) remained on during the experiments as the flow is introduced into the chamber.
2.1.6 Non-Stationary Stage
For the surface treatment, the distance between the bottom edge of the planar DBD and the sample varied in the range of z=2~20 mm; “z” denotes the coordinate in the downstream direction measured from the bottom edge of the DBD assembly throughout the thesis. The sample was either stationary or transported by a pre-programmed non-stationary stage (Unice E-O Service Inc., U-S1-D0-H080378, maximum traveling distance 20 cm, USB driver). The stage plate size was 10×10 cm. The non-stationary variable speed of the sample passing the DBD jet was in the range of 1-9 cm/s. We could preset the passes of the sample treatment using the pre-programmed non-stationary stage.
2.2 Instrumentation
The instruments for a planar DBD APPJ measurement in this study included thermocouples for post-discharge gas temperature measurements, the measurement of
electric properties, the OES for optical spectral measurements, the FTIR for gas and surface sample analysis, contact angles for surface energy measurements, AFM for surface profile measurements, SEM for bacteria morphological observation, visualization of planar DBD APPJ and the sample preparation of bacteria. Table 2-2
summarizes various instruments which were used for the measurements. Each of these arrangements is described in the following in turn.
2.2.1 Thermocouples for Post-Discharge Gas Temperature
Measurement
The gas temperatures in the post-discharge jet region were measured using a K-type (-50-500 ℃ ) thermocouple, which was fixed on a non-stationary stage. The thermocouple was connected to a digital indicator (Brainchild BTC-900) for temperature display.
2.2.2 Measurement of Electric Properties
2.2.2.1 Current and Voltage Waveforms
Input voltage and output current waveforms across the electrodes of the parallel-plate discharges were measured by a high-voltage probe (Tektronix P6015A) and a current monitor (IPC CM-100-MG, Ion Physics Corporation Inc.), respectively, through a digital oscilloscope (Tektronix TDS1012B). The current monitor was of the Rogowski coil type. The output sensitivity was 1 volts/Amp, and the diameter of the hole was 0.5 inch to suit the insulating power cable. The Rogowski coil used for fast current changing measurement was proved to be better than the Hall-effect device in terms of sampling speed and accuracy.
2.2.2.2 Power Absorption Estimation based on Lissajous Figure
Plasma power absorption was measured by the technique of the “Lissajous figure” (Q-V characteristics) [Wagner et al., 2003] using a capacitor with a capacitance of Cm=6.8 nF and a voltage probe (Tektronix P2220).
Figure 2-3shows the typical Lissajous figure obtained for a DBD. The shape of the Q-V curve is a distorted version of the standard parallelogram [Wagner et al., 2003]
observed in a DBD driven by a sinusoidal AC power source. The electrical energy consumed per voltage cycle, E, and the plasma absorbed power, P, were estimated by the following relations [Wagner et al., 2003]:
E=∮V(t)dQ ≡ area of (Q-V) diagram (1)
1
P E fE T
= = (2)
where f is the frequency ofthedistorted sinusoidal voltage.
2.2.3 OES for Spectral Measurements
The spectral optical emission intensities of the APPJ were measured using a monochromator (PI Acton SP 2500) with a Photomultiplier tube (Hamamatsu R928),
which was mounted on a mobile 3-D table (see Figure 2-4). The spectral range was
180~900 nm with 1200-g/mm grating (Holographic, 300-nm Blaze and 500-nm Blaze). When the center wavelength of the emission line is 400 nm the linear dispersion is 1.489 nm/mm. Both sides of the fiber (Ocean Optic. BTW-FPC-600-0.22-1.5-UV, 600
μm) were separately connected to the SMA adapter of the monochromator and the
collimating lenses (Ocean Optics 74-UV).
2.2.3.1 Species Identification
discharge and post-discharge jet region. In addition, the absolute intensity was proportional to the number density in the region of interest. One aspect of OES measuring is identifying which particle species emits radiation. From the line position, the wavelength is a characteristic of an element/compound; it is sufficient to use a wavelength calibrated (survey) monochromator in combination with wavelength tables
for atoms, ions and molecules [Fantz 2006]. A spectroscopy software package, named
Plasus SpecLine, was used to evaluate the spectral data, i.e. finding specific lines in the
spectra (ex. Figure 2-5) and excited species level change (ex. Table 2-3), and identifying
unknown peaks or comparing data from the OES measurements.
2.2.3.2 Gas Temperature Measurements
Metastable states of molecules play an important role in different discharges due to their ability to accumulate a great amount of energy, which can be effective in various chemical and physics processes. For example, from measured line intensities, the concentrations of NO as functions of the average discharge power and estimations of the electron density in the discharge could be derived. Variations in the measured
rotational temperature of NO-γ(245-249 nm) can be attributed to changes in the gas
heating and, consequently, the gas dynamics in DBD. Since the collision frequency is very high in a DBD under atmospheric-pressure condition, we can assume thermal equilibrium between translational and rotational temperatures. Therefore, in the
spectrum of NO- γ transition, the rotational distribution of excited emission
( 3 2 2 1
2( u) ( ) ( ) 2( g)
N A∑+ +NO X →NO A∑+ +N X ∑+
∏ ) corresponds to the ambient gas temperature
[Bibinov et al., 2000]. We used LIFBASE [Luque et al., 1999] to simulate gas
temperature in the discharge region (ex. Figure 2-6) throughout the study.
Diffraction gratings produce a multiple order of diffracted light where constructive interference permits the light of one wavelength to appear at more than one angle of diffraction. For example, 236 nm light passing through a monochromator normally appears as 236nm “first order” light. Some of the 236nm light will also appear at 472nm as “second order” light and so on. We removed second order emission lines from
measured OES spectra by long-pass filter verification. See Appendix A for details.
2.2.4 Measurement of Ozone Concentrations
2.2.4.1 Ozone Monitor
The concentrations of ozone were measured using an ozone monitor (API Model 450) which was mounted on a mobile 3-D table in the post-discharge jet region. The detection of ozone molecules is based on the absorption of 254 nm UV light due to an internal electronic resonance of the ozone molecule. The API Model 450 used a mercury lamp so that a large majority of the light emitted was at the 254nm wavelength. The
operation range was 1 to 1000 ppm. The O2/N2 (<1.6%) DBD plasma produced a
concentration of ozone well under 1000 ppm based on our measurements. However, as the oxygen exceeds some amount, the concentration of ozone is over the range of the ozone monitor and cannot be measured properly.
2.2.4.2 FTIR
Infrared spectroscopy exploits the fact that the chemical bounds of molecules have specific frequencies at which they rotate or vibrate corresponding to discrete energy levels (vibrational modes). In order for a vibrational mode in a molecule to be IR active, it must be associated with changes in the permanent dipole. Ozone belongs to the dipole
is over 1000 ppm, which renders the above-mentioned ozone monitor inappropriate. The ozone infrared spectrum absorbance of the APPJ was measured using a FT-IR
spectrometer (Bruker Tensor 27). For example, Figure 2-7 shows the infrared absorption
spectra (800-3600 cm-1) of the planar air DBD APPJ. A strong absorption peak of 1055
cm-1 for the ozone was clearly observed in the compressed air discharges because of
abundant oxygen species in the discharges. We defined the 1055 cm-1 line intensity of
IR spectrum as the relative ozone concentration in the post-discharge jet region.
2.2.5 Contact Angles for Surface Energy Measurement
The hydrophilic property (contact angle) of the PP film and the ITO glass surface
were measured using a contact angle machine (KRŰSS GH100) with a 2 µL drop of
de-ionized water placed on the glass surface using a micropipette. The values of the static contact angle were obtained using Laplace-Young curve fitting to measure the 10 average values in the plasma treatment region.
2.2.6 AFM for Surface Profile Measurement
The AFM images for measuring the roughness of the sample surface were obtained using a Veeco Dimension 5000 Scanning Probe Microscope (D5000).When the probe scan is near the sample surface, the probe with sample interaction force reflects testing-arm deformation through laser-beam detection and feeds the information to a PC. The Z-axis information showed the roughness of the sample, and the X-axis and Y-axis showed the AFM scanning area. Three sets of data can be output: 2D/3D morphology, step profile, and roughness analysis.
The bacteria of the control (untreated) and the plasma-treated samples were rinsed with distilled water and fixed with 2.5% glutaraldehyde solution overnight. The fixed bacteria were dehydrated in a series of graded acetone concentrations and then dried in a
CO2 atmosphere (HCP-2, Hitachi, Japan) under critical conditions, and then coated with
a thin layer of gold. The effects of the plasma treatment on the structure of the bacteria were examined using a scanning electron microscopy (Hitachi S-470 type II, electron voltage: 5kV, amplification factor: 30k).
2.2.8 XPS for Surface Chemical Composition
The surface chemical composition of the PP film and ITO glass before and after application of the AP plasma jet was measured using an X-ray photoelectron spectrometer (PHI Quantera SXM, Scanning Monochromated Aluminum anode,
chamber pressure below 5×10⁻¹⁰ torr for ITO glass; ESCA PHI 1600, Mg anode at
250W and 15KV, 1253.6 eV, the electron take-off angle respect to the PP film surface
was 45°, chamber pressure below 2×10⁻⁸ torr for PP film).
2.2.9 Visualization of Planar DBD APPJ
The different discharge images of the planar DBD APPJ were taken using a digital camera (Nikon D1H) and lens (Nikon Micro-Nikkor 105mm f/2.8). The image sensor was 12-bit RGB CCD with 2.74 million pixels. The typical images of the post-discharge region for DBD plasma were taken after 0.2 sec (side view: width 1mm) and 2 sec
(front view width: 50 cm) of exposure. The typical images of the discharge region for
DBD plasma were taken after 0.2 secof imaging.
2.2.10.1
E. coli and B. subtilis
E. coli (BCRC 13014) and B. subtilis (BCRC 14716) cultures were grown in 100
mL of nutrient broth which was maintained for 12 h and 18 h at 37◦C, respectively. This
allowed the bacteria to reach the exponential-log phase. Bacteria (10 mL) were harvested and transferred from the broth under sterile conditions to the phosphate buffer solution (90 mL and pH 7.0). The solution was then diluted further to the required
concentration level (3.2×10⁷ CFU/mL), which was very high as compared to previous
studies [Sun et al., 2007]. Then 0.1 mL of the diluted solution was added to sterile petri
dishes (diameter 80 mm) containing 20 mL of nutrient agar, and spread on the central area of the petri dishes (4 cm × 4 cm) to ensure that all bacteria were treated by a plasma jet 5 cm in width. During the bacteria preparation, we made sure that the petri dishes were level in order to prevent any of the bacteria flowing out of the central area of the petri dish. The petri dishes with nutrient agar were exposed to the parallel-plate DBD APPJ following the planned test conditions, as will be shown later. After the plasma jet treatment, the petri dishes were incubated at 37°C for 24 h, prior to determining the resulting number of colony-forming units (CFU/mL) by NIH ImageJ [Sheffield et al., 2007]. This software can easily calculate the area of grown bacteria based on a pixel count, which resulted in the survival rate of the bacteria in the petri dish.
2.2.10.2
B. subtilis Spore
B. subtilis (BCRC 14716) precultures were grown in 100 mL of nutrient broth which
was maintained for 18 h at 37℃; then 0.1 mL culture suspension was added to sterile
petri dishes containing 20 mL of nutrient agar (beef extract, 3 g/liter; peptone, 5 g/liter;
agar, 15 g/liter; with the pH adjusted to 6.8±0.2). After being incubated at 37℃ for 2
water per plate. The spores were washed five times by centrifugation and suspension in
sterile water, and finally stored at 4℃ in water at concentrations of about 1.24×10⁹
spores/mL, diluted according to the demand thickness of the experiment. Then, 0.1 mL of the diluted solution was added to sterile petri dishes (diameter 80 mm) containing 20 mL of nutrient agar and spread on the central area of the petri-dishes (4 cm × 4 cm) to ensure that all bacteria were treated by a plasma jet 5 cm in width. During the bacteria preparation we made sure that the petri dishes were level; otherwise, some bacteria would flow out of the central area of the petri dish. The petri dishes with nutrient agar were exposed to the parallel-plate DBD APPJ following the planned test conditions, as will be shown later. After the plasma jet treatment, the petri dishes were incubated at 37°C for 24 h, prior to determining the resulting number of spore (spore/mL) by NIH ImageJ, which was described earlier.
2.3 Test Conditions
The test conditions for the planar DBD APPJ measurements in this study included surface modification applications and bacteria sterilization/inactivation
applications. Each of these test conditions has been summarized in Tables 2-4 – 2-7.
2.3.1 Surface Modification Applications
2.3.1.1 PP Film Modification
Various working gases flowed between the parallel plates, including N2 (99.99%
purity) and its mixture with trace oxygen (99.99% purity) with different volume fractions in the range of 0.004-1.6%. The flow rates were controlled by manually adjustable flowmeters. The total flow rate was fixed at 50 slm throughout the study. The output power from the power supply was fixed at 500 W (plasma-absorbed power: 175
W). For the PP film treatment, the distance between the planar-DBD APPJ bottom edge
and the PP film was varied, while the PP film (0.31 mm in thickness, density of
0.91~0.92 g/cm3, Nan-Ya Inc.) was either stationary or transported by a
pre-programmed non-stationary stage. The moving speed of the PP film was in the range of 0.5-8 cm/s throughout the study. The testing conditions of the PP film
modification have been summarized in Table 2-4.
2.3.1.2 ITO Glass Surface Cleaning
Discharge gases, which included pure nitrogen (99.99%) and mixtures of gases with 0.004~1% of oxygen in nitrogen flowed from the top to the bottom between the parallel plates for the ITO glass surface treatment under the conditions of 60 kHz (power supply), 50 slm (flow rate) and 175 W (plasma absorbed power). In addition, the gas temperatures (measured by a K-type thermocouple) in the jet region (z=2~20 mm) were generally low in the range of 50-80°C under the typical operating condition, which was safe for ITO glass cleaning and other applications. The data on the contact angle for the stationary case presented here were obtained after 5 s of plasma jet stream impinging onto a stationary ITO glass. The non-stationary speed of the ITO glass passing the DBD jet was in the range of 1-9 cm/s. The testing condition of ITO glass surface cleaning has
been summarized in Table 2-5.
2.3.2 Bacteria Sterilization/Inactivation Applications
2.3.2.1
E. coli and B. subtilis
Various working gases flowed between the parallel plates, including N2 (99.99%),
O2 (99.99%) and compressed air (produced from an oil-less compressor). The flow rates
the results presented in this paper were performed under the conditions of 30 kHz (power supply) and 10 slm (flow rate). The petri dishes which contained the bacteria were transported by a pre-programmed moving stage. For the treatment of the bacteria, the distance between the bottom edge of the planar DBD and the bacteria varied in the range of z=4-20 mm. The moving speed of the petri dishes was kept at 1 cm/s and the
number of passesof the DBD jet pass varied in the range of 1-18. Note that “a pass” is
defined as the motion of the APPJ traveling back and forth over the petri dish. Resulting residence time over the petri dish was 0.1 s for a pass under the designated speed, assuming the jet width is 1 mm at the impinging point. In addition, the gas temperatures in the post-discharge jet region were measured using a K-type thermocouple, which was fixed on a moving stage. The testing conditions of the E. coli and B. subtilis inactivation
have been summarized in Table 2-6.
2.3.2.2
B. subtilis Spore
Various working gases flowed between the parallel plates, including compressed air
(produced from an oil-less compressor) and CF4/compressed air (2%). The flow rates
were controlled by manually adjustable flowmeters. For clarity of presentation, all of the results presented in this paper were performed under the conditions of 30 kHz (power supply) and 5 slm (flow rate). The petri dishes which contained the bacteria were transported by a pre-programmed moving stage. For the treatment of B. subtilis spore, the distance between the bottom edge of the planar DBD and the bacteria was fixed at 14 mm. The moving speed of the petri dishes was kept at 1 cm/s and the
number of passesof the DBD jet pass varied in the range of 1-18. Resulting residence
time over the petri dish was 0.1 s for a pass under the designated speed. In addition, the gas temperatures in the post-discharge jet region were measured using a K-type thermocouple which was fixed on a moving stage. The testing conditions of B. subtilis
![Table 1-2 Densities of charge species in the plasma discharge [Schutze et al., 1998]](https://thumb-ap.123doks.com/thumbv2/9libinfo/8694492.198654/93.892.275.701.505.742/table-densities-charge-species-plasma-discharge-schutze-et.webp)
![Table 1-4 Main plasma reaction [Eliasson, B., 1991]](https://thumb-ap.123doks.com/thumbv2/9libinfo/8694492.198654/94.892.222.791.204.1154/table-main-plasma-reaction-eliasson-b.webp)