~ ) Pergamon
Copyright © 1996 Elsevier Science Ltd Printed in Great Britain. All rights reserved 001~9310/96 $15.00+0.000017-9310(95)00256-1
Experimental study of unstable mixed
convection of air in a bottom heated
horizontal rectangular duct
W. L. L I N and T. F. L I N tDepartment of Mechanical Engineering, National Chiao Tung University, Hsinchu, Taiwan, Republic of China
(Received 5 January 1995 and in final form 28 June 1995)
Abstract--An
experiment was carried out to investigate the buoyancy induced spatial and temporal flow transition and the associated heat transfer processes in a mixed convective air flow through a bottom heated horizonl:al rectangular duct, by measuring the local heat transfer coefficient, spanwise temperature distributions, air temperature variation with time at selected locations and by visualizing the cross plane secondary flow for the Reynolds numbers ranging from 9 to 186 and the Grashof numbers up to 5 × 10⁶. The results indicated that the heat transfer enhancement is due to the formation and development of a buoyancy driven secondary vortex flow. The onset of thermal instability was found to move upstream for a higher Grashof number and to be delayed for a larger Reynolds number. At increasing Grashof numbers the measured spanwise time-averaged fluid temperature distributions and the corresponding instantaneous flow visualizations clearly show the formation of secondary vortex flow and the changes in the flow structures. At slightly supercritical Grashof numbers, the secondary flow is in the form of two pairs of longitudinal rolLls with the vortex flow ascending along the side wails. For higher Grashof numbers the vortex rolls rotate in opposite directions, with the secondary flow descending near the side walls. At even higher Grashof numbers, merging of the vortices takes place and only one pair of vortex rolls exist. Furthermore, raising the Grashof number or lowering the Reynolds number causes the flow to change from a laminar time periodic to a transitional quasiperiodic and even to a chaotic turbulent state. Based on the present data, a regime map delineating the temporal state of the flow and a correlating equation forthe Hopf bifurcation were proposed.
1. I N T R O D U C T I O N
A mixed convective flow in a b o t t o m heated rec- tangular duct is simple and steady when the buoyancy is small compared with the inertia. But when the buoy- ancy is d o m i n a t e d over the inertia, the flow can become unsteady, transitional and even turbulent. Additionally, various complex flow structures like the longitudinal vortices, 'Lransverse waves and flow rever- sal may appear during this buoyancy induced flow transition. These complicated processes are often encountered in a low Reynolds n u m b e r flow. Detailed understanding o f these buoyancy induced flow tran- sition processes is i m p o r t a n t in fundamental fluid mechanics and heat transfer study and in various tech- nological processes, such as the cooling of mic- roelectronic equipments [1], heat transfer in compact heat exchangers [2], growth o f single crystal through chemical v a p o r depo:~ition [3] and m a n y others. In particular for C V D , reactors are operated with a com- bination o f large G r a s h o f n u m b e r (Gr) and small Reynolds number (Re) so that the value o f Gr/Re 2 ranges from 10 to 1000. The superposition o f trans- verse and longitudinal vortices can lead to rather non-
t Authors to whom correspondence should be addressed.
uniform deposition layer thickness. But how the gov- erning parameters affect these processes is still poorly understood. In the following, the relevant literature is briefly reviewed.
The onset o f the thermal instability and the associ- ated heat transfer enhancement in a b o t t o m heated horizontal plane channel was found to occur at
Ra = 1708, as predicted from experimental measure-
ments [4-9] and linear stability theory [4]. Beyond this critical Rayleigh number, steady longitudinal vortex rolls prevail. Ostrach and K a m o t a n i [6, 7] exper- imentally noted that the vortex rolls become irregular as Ra > 8000. In the thermal entrance region K a m - otani et al. [9] indicate that the heat transfer rate is affected not only by the Rayleigh n u m b e r but also by the buoyancy-to-inertia force ratio Gr/Re 2. In the mixed convection of nitrogen gas, Rosenberger and his coworkers [10, 11] observed the unsteady snaking longitudinal vortex rolls even for the Rayleigh n u m b e r only slightly above the critical value of 1708. Besides, the asymmetric roll patterns were found also at low Rayleigh numbers. A flow regime m a p o f Re vs Ra was proposed to predict the boundaries a m o n g the flow with no roll, steady and unsteady rolls. Finally, the transverse rolls were noted at very low Reynolds n u m b e r by Ouazzani et al. [12, 13]. They also refined the regime m a p to include the transverse rolls. 1649
1650 W.L. LIN and T. F. LIN
NOMENCLATURE
A aspect ratio, b/d T temperature
A,~do area of the side wall 72~v t time average temperature at a given
A, area of the top wall location
Aw area of the heated plate Tb bulk temperature
b, d width and height of the duct u, v, w velocity components in x, y, z
F shape factor directions
g gravitational acceleration V voltage
Gr modified Grashof number, x, y, z Cartesian coordinates
gflq"o, vd4/kv 2 X, Y, Z dimensionless Cartesian
h local convection heat transfer coordinates, x/d, y/d and z/d
coefficient Z* critical modified Z coordinate,
I electric current Z/(Re × Pr).
k thermal conductivity
L length of the heated plate Greek symbols
M volume flow rate ~ thermal diffusivity
Nu Nusselt number, hd/k fl thermal expansion coefficient
Pr Prandtl number, v/ct e emissivity
Q't'o~ the total heat dissipation in the plate v kinematic viscosity
q~'onv local convective heat flux p density
qi'nsul
local conduction heat loss through the cr Stefan-Boltzmann constant.insulation
qi'o~s local heat loss, q"ad + q~suJ Subscripts
qTad
local radiation heat loss from the in values at the inlet of the test sectionsurface side of side wall qualities
q't'ot the total heat flux in the plate t of top wall qualities
Ra Rayleigh number w of heated wall qualities.
Ra* critical Rayleigh number
Re Reynolds number, ~v~nd/v Superscripts
t time average value.
A series of experiments have been conducted by Incropera and his coworkers [14-19] to investigate buoyancy effects on a forced air or water flow in a horizontal plane duct with the bottom and/or top plates subject to uniform heat fluxes. The onset and qualitative picture of the buoyancy driven secondary flow on the bottom plate were clearly visualized [14]. While over the top plate the buoyancy shows little effect in the laminar flow, but it results in relami- narization in the transitional and turbulent flows [15]. Their flow visualization distinctly discloses four flow regimes along the bottom plate-laminar forced con- vection, laminar mixed convection, transitional mixed convection and turbulent free convection. The tran- sition to turbulent flow was attributed to the break- down of the vortices due to the hydrodynamic insta- bility [17].
Various numerical works [20-36] were carried out on the basis of the assumption that the axial viscous and thermal diffusion can be neglected, i.e. the flow is parabolic and thus the problem can be solved efficiently by various marching techniques. In view of the presence of the three-dimensional transient tran- sitional flow in the duct, this approximation becomes inappropriate at high Rayleigh or low Reynolds num-
bers. To explore the buoyancy induced flow transition in low Reynolds number flow, recently Huang and Lin [37] directly solved the unsteady three-dimensional elliptic flow equations by a higher order finite differ- ence numerical scheme, without using any turbulence modeling for Re = 500 and A = 2. They revealed that the buoyancy induced laminar to turbulent flow tran- sition follows the Ruelle-Taken route. This remains to be verified by experiments.
In may cases such as the practical CVD reactors it is necessary to consider the effects of the aspect ratio of the channel on the unstable mixed convection. Moffat and Jensen [38, 39] suggested that the buoyancy driven secondary flow structure is very sensitive to the aspect ratio and needs to be investigated in detail. To comp- lement our previous numerical analysis [37], the pre- sent experiments are intended to measure the charac- teristics of the flow transition and the associated changes in the secondary flow structure, and heat transfer in the mixed convective air flow in a bottom heated horizontal rectangular duct of a finite aspect ratio (A = 4). Attention is focused on the effect of the Grashof and Reynolds numbers on the transitional flow characteristics. Specifically, an experiment is designed to detect the flow transition by examining
i n s u l a t i o n SS301 Foil P l e x i g l a s s
1"
12o r ~=[
30 n n !T ® ® @--7
,1
®
1
®
S c h e m a t i c D i a g r a m of E x p e r i m e n t a l A p p a r a t u s . 1.ak ~ flow ; 2 . b l o w e r ; 3 . f r e q u e n c y r e g u l a t o r ; 4 . f l o w m e t e r s a n d v a l v e s ; 5 . d i f f u s e r w i t h s c r e e n s ; 6 . s t r a i g h t e n e r w i t h h o n e y c o m b a n d s c r e e n s ; 7 . n o z z l e ; 8 . d e v e l o p p i n g c h a n e l ; 9 . t e s t s e c t i o n ; l O . p r o b e s ; l l . t h r e e - w a y t r a v e r s i n g d e v i c e ; 1 2 . a m m e t e r ; 13. D.C. p o w e r s u p p l y ; 14.1amp ; 1 5 . c a m e r a .Fig. 1. The schematic diagram of the experimental apparatus.
the local temperature variations with time at selected detection points and to visualize the flow structure at relatively large
Gr/Re 2.
2. EXPERIMENTAL APPARATUS AND PROCEDURES
2.1. Experimental apparatus
Figure 1 shows a schematic view of the mixed con- vective experimental[ apparatus established in this study. The apparatus consists of three parts: wind tunnel, test section and measuring probes along with the data acquisition :~ystem. The test section is a bot- tom heated rectangular duct constructed of 9 mm thick plexiglass top and side walls to facilitate flow visualization. The cross-section of the duct is rec- tangular, 30 mm in height and 120 mm in width, providing an aspect ratio of A -- 4 and a total length of L -- 800 mm. Its bottom wall was made of 0.25 mm thick SS301 stainless steel heater plate, 120 mm wide by 800 mm long, and is bonded to a sheet of 12 mm thick plexiglass ]?late. Direct electric current was provided from a 3C,V-50A d.c. power supply and transferred to the heater plate through several copper
bus-bars firmly attached at the ends of the heater, intending to produce a nearly uniform heat flux boundary condition. Power dissipation was deter- mined by measuring the current and voltage drop across the heater plate and uniformity of the energy dissipation was checked by measuring the voltage dis- tribution on the plate. Specifically. The longitudinal measurements yield a linear voltage drop and span- wise measurements resolve variations no larger than 0.3 mV for a voltage drop of 0.418 V across the heater plate in the pure natural condition at high wall heat flux. The total heat dissipation in the plate is
Q'[o¢ = I x V, (1)
where I is the electric current and V is the electric voltage drop across the plate. To measure the d.c. current past through the heater plate, a d.c. ammeter (YOKOGAWA model 201137) is arranged in series connection with the plate. The accuracy of the ammeter is within 0.01A. To determine the voltage drop across the heater plate, a digital multimeter (Chung 6005) with an accuracy of 0.01 mV is employed to measure the voltage difference between two ends of the heater plate. The entire channel, including the
1652 W.L. LIN and T. F. LIN test section and the upstream and downstream flow
straighteners, was insulated with the Superlon insu- lator of 150 mm thick and mounted on a rigid sup- porting flame.
The working medium was air which was driven by a blower and sent into the long rectangular duct downstream of a diffuser buffer section, as shown in Fig. 1. The flow rate is controlled by a variable speed blower whose speed is controlled by an a.c. motor with an output frequency of 0-60 HZ. The volume flow rate of air upstream of the diffuser buffer section was measured by a float-area-type flowmeter with an accuracy of 1.6%. To reduce the influence of the vibration from the blower, a flexible connection made of cloth is used to connect the blower and a diffuser buffer section. The purpose of installing the diffuser buffer section and a series of three additional fine- mesh screens is to reduce turbulence from the blower blades. In the inlet section turbulence was further sup- pressed by passing the air through a section packed with plastic straws of 3 mm in diameter and bounded on each side by two fine mesh screens, and then fol- lowed by a nozzle and a developing channel, before entering the test section. The nozzle is made of 5 mm thick acrylic plate with a contraction ratio of 10 : 1 and has been designed to eliminate flow separation, minimize turbulence, and provide a nearly uniform velocity profile at the inlet of the developing section. The developing section is 1000 mm in full length, approximately 33 times that of the duct height. This ensures the flow is fully developed at the inlet of the test section for Re <~ 200. An outlet section was added to the test section to reduce the effects of the disturbances from the ambient surrounding of the open-loop wind tunnel on the flow in the test section. The optical observations of the flow structure were performed using smoke tracers to determine the pat- tern of the secondary flow. A thin sheet of smoke was injected into the test section along the bottom of the channel through a slot across the width of the heater plate just in front of the test section. When illuminated through the top wall by lamps and viewed from the end of the channel, a sharp contrast could be achieved between the channel walls and the smoke.
In order to obtain adequate resolution of the tem- perature distributions on the bottom wall, the heater plate was instrumented with 57 (placed at 19 longi- tudinal locations) calibrated copper-constantan (T- type) thermocouples and their signals were recorded by the Hewlett-Packard 3852A data acquisition sys- tem with a resolution of _+0.05°C. Additional ther- mocouples were used to measure the temperatures of the inlet and outlet air and the top and side plates, and to determine temperature differences across the Superlon insulation underneath the heater plate. A T- type thermocouple having a bead of 70/zm diameter was used to measure the air temperature in the duct, which was equipped in the flow so as to have its sensing point 5 mm upstream of the supporting stain- less steel pipe of 1 mm outer diameter. This probe was
inserted into the flow through the top wall or from the exit end of the channel and can be traversed in the flow to measure the time-averaged temperature field and the instantaneous temperature. The temperature data are recorded when the system reaches steady or statistical state, usually 5 6 h after starting the test. The experiment was performed mainly at the Grashof numbers ranging from 104 to 5 × l06 and for Reynolds numbers below 200. The resulting Gr/Re 2 ratio, which governs the characteristics of a combined free and forced convection in duct flow, was above 2. 2.2. Data reduction for heat transfer coefficient
The spanwise-averaged Nusselt number defined as
hd q ~ ' o n v d
Nuz = T = (Tw - Tin)k (2) is obtained from measuring the local mean bottom wall temperature Tw and local convective heat flux q~onv. Note that the above heat transfer coefficient h is based on (Tw-Tin) instead of (Tw-Tb) since the heated section is not long (L/d = 26.7), so that the convective heat transfer in it is mainly in the entrance region. The surface energy balance relating the total energy dissipated in the heater plate due to electric resistance heating per unit surface a r e a q't'ot to the heat
fluxes associated with the convection from the surface to the flow q"o,v, net radiation heat loss from the surface q~'ad and conduction loss through the insu- lation q['n~ul is
q'(ot = qLnv + q~'ad + qi~sul- (3) The convective heat flux is therefore determined by measuring the total dissipated heat flux and applying appropriate correlations for the nonconvective com- ponents. An implication of the expression in equation (3) is that although uniform heat generation q't'ot is
achieved in the heated plate, variations in the radi- ation and conduction losses induce nonuniformities in the convective heat flux. The variations were esti- mated to be less than 20% of the average q~'o,v.
Considering the shape factor and surface resistances for thermal radiation from the heated bottom surface to the top surface in a rectangular duct and that from the bottom surface to the two side plates, the net radiation loss from the bottom surface is estimated as
~(/~4- L~ )
" + 2 qrad - - 1 -- ew 1 1 - - g t × 1 - ~w 1 1 - - ~side - - + - - += 0.331 a(7~4w - Tt n) + 2 x 0.082a(7 T M - T~o),
where
ew ~ 0.39 et = eside ~ 0.85 Fw.t -,~ 0.78 Fw.side ~ 0.1
At/Aw = 1 Asidc/Aw
= 0.25.The mean temperature of the heated surface ~rw is measured directly, and the mean top(side) plate temperature ~ri(~r~id= ) is obtained by interpolation between the measured values. Radiation losses were estimated to range from 24 to 33% of the total flux.
Conduction losse,; through the insulation q~',~,~ were calculated by assuming one-dimensional conductive transfer and by measuring the temperature difference across the first 9 mrn of the insulation (kinsu I = 0.21 W m - l oC-~) beneath the heater plate. Losses calculated in this manner were estimated to range from 14 to 23% of the total flux q~'ot,
AT
q~'~u, = - kinsul ~Y insu,' (5)
2.3.
Analysis of temperature fluctuation
The time-averaged temperature and the intensity of the temperature fluctuation of the air flow were obtained by averaging 1000 sampled data at each detection point. In the tests, the detection points are distributed at 24 equi-spaced spanwise positions in the horizontal planes at y = 5, 15 and 25 mm. Also, the power spectrum densities of the temperature fluc- tuation were obtained by analyzing the output of the thermocouple using a F F T analyzer. The response time of the thermocouple is about 0.13 s.
3. EXPERIMENTAL RESULTS AND DISCUSSIONS
3.1. Preliminary investigation of flow field
In order to confirm the fully developed laminar flow at the inlet of the heated test section, the cross- sectional velocity distributions were measured in the entrance region of the test section using a hot-wire probe which was operated by a constant temperature anemometer (DANTEC Probe Type 55Pll with 56C17 CTA Bridge). For calibrating the hot-wires, the pipe-flow method, where the probe is placed in the center of a fully developed laminar pipe flow, was used. The total flow rate is measured and the pipe center velocity is calculated from the parabolic dis- tribution. Figure 2 shows the measured velocity pro- files along the vertical centerline at x = 60 mm and horizontal centerline at y = 15 mm for
Re
= 186 with no heat input to the bottom plate. These results are in good agreement with the analytical results given by Shah and London 1140]. The turbulence level of the inlet stream also given in the figure is all within 1%, implying that the eftbcts of the free stream turbulence on the mixed convective flow characteristics are mod- erate.t.0 - ~ OOOOO Local Velocity a O " ~ . ~ ~ * ~ a T u r b u l e n c e I n t e n s i t y a ~ _ _ Analytical fully S.S - ! - ~ o p e d profile
00 :
,¢,'=,0
y / d ~' 0.2 ~ O . v e l o c i t y a t . c e n t e r of t h e i n l e t cross s e c t i o n (a) o.o o. o o.12 o .14 o .16 o. 8 1 .Io Re=186 z=0 rn , y = 1 5 m r s A=4 , d=30 m m 4.o 3.0 ~ zx "-~z 1/2 ,~ ( w ) xi0 1.0(b) o.o o . . . . ~ o.'~. o.ls o.~ i,'o
Fig. 2. Fully developed velocity distribution at the inlet of heated section for
Pr
= 0.72 andRe
= 186 for (a) along the vertical centerline at x = 60 mm and (b) along the horizontalcenterline at y = 15 mm.
3.2.
Heat transfer coefficient
Uncertainties in the Nusselt number and other par- ameters were estimated according to the standard pro- cedures proposed by Kline and McClintock [41]. Our analysis indicated that the combination of many measurements, together with the uncertainties in the predicted quantities (radiation and conduction losses), yields the Nusselt number uncertainties rang- ing from 4 to 10%. Uncertainty in the Grashof num- ber ranges from 10 to 25%, which primarily reflects the uncertainty in the convective heat flux. The esti- mated uncertainty in the Reynolds number was 2%. Because of the fluid property variations with the tem- perature the Reynolds and Grashof numbers vary with axial distance. Although the variations in the Reynolds number were small, the Grashof number could vary by as much as 25%. For convenience, experiments are identified according to the Reynolds and Grashof numbers based on the inlet conditions and averaged convection heat flux. The uncertainties of various parameters are summarized in Table 1.
The reliability of the present data of the spanwise- averaged Nusselt number was established through various tests and comparison with some appropriate standard conditions. The most relevant comparison is to compare the measured data for small Grashof numbers with the numerical solution for the cor- responding forced convection. This comparison is made in Fig. 3. The agreement with the numerical
1654 W.L. LIN andT. F. LIN Table 1. Summary of the uncertainty analysis
Parameters and estimated uncertainties
Parameter Uncertainty L, b, d (m) _+0.0005 m Tin ["C] _+0.2' C Tw, Tt, Tside
[°C]
_+ 0.15"C I [Amp] + 1.5% V [Volt] + 1.5% M [L min -~] + 1.6% kf[W(K m) ~] _+0.05% # [N'm s 2] _+0.05% p [kg m -3] +0.05% v [m 2 s -t] +0.07% (Tw- Tin) [°El +0.25°C Q 't'o, [W] +2.12% q','ot [W m -2] _+ 14.8 [W m 21 q"ad.t [Wm 2] -+0.57 [Wm -2] q%d.~ [W m 2] -+0.48 [W m -2] q[n~,~ [ wm-2] -I-6.1 [Wm -2] q','o~ [Wm 2] +6.12 [Wm -2] q~o,v [Wm 2] -+16 [Wm -2] Gr _+ 10 ~ 25% Re _+ 2.04% Gr/Re 2 _ 10.5 ~ 25.2% Nu _+4 ~ 10%prediction [37] is excellent and well within the exper- imental uncertainty.
As the heat flux is increased beyond certain critical value depending on R e , the Nusselt n u m b e r exhibits a discernible departure from the forced convection limit indicating the onset of the longitudinal vortex rolls. This is shown in Fig. 4 for the case with
Gr = 1.1 × 10⁵ and R e = 102, a n d is also compared to the numerical solution a n d the forced convection result. The agreement is also good, except that the earlier appearance of the vortex rolls is predicted in the numerical study. This difference is attributed to the significant conduction heat transfer from the heated bottom plate to the top plate through the plexiglass side walls whose thermal conductivity is much higher than that of air. This conjugated heat transfer effect
14 12- I0- 8-
Nuz
6- 4 - 2 0 0.0- - N u m e r i c a l Solution for Forced Convection 00000 E x p e r i m e n t a l Results Re=102 , Gr/ReZ=0.41 H=30 m m , A=4 , Pr=0.T2
~
o
o o o O
0.12
0.14
0
]60 ]8
Z ( m )Fig. 3. Comparison of the experimental data with numerical solution for forced convection.
8 II - Numerical Solution for Forced Convection ~,1 ooooo E x p e r i m e n t a l Results / ',~ . . . . N u m e r i c a l Solution ~,' Re=102 , G r = l . l x l O ~ 6 1 ' ! ' H = 3 O m m , A = 4 , Pr=0.72 N u z 4' Instability ~ - . ", o --- ° ' ° ' ~ - b - - ° - ' ° - ° - o o "<%0200
0q
0.0 0.12 0.14 0.16 0 ]8z (m)
Fig. 4. Comparison of the predicted spanwise-averaged Nus- selt number distribution with the measured data for
Re = 1 0 2 , Gr = 1.1x10⁵ a n d A = 4 .
was not included in the numerical calculation [37]. Note that the m o n o t o n i c decay in the Nusselt n u m b e r associated with the forced convection dominated region ends when the buoyancy force becomes strong enough to destabilize the hydrodynamic b o u n d a r y layer on the bottom plate. Beyond the onset of insta- bility, plumes of warm fluid rise from the heated sur- face ascending along the side walls, resulting in a developing secondary vortex flow a n d the bottom heated plate temperature is reduced by the cool fluid descending from the duct core. Thus, the secondary flow circulation provides an effective mechanism for heat transfer enhancement. As the secondary flow strengthens, the Nusselt n u m b e r rises well above the forced convection limit. Note that the secondary flow can enhance the heat transfer by as much as 110%, as the Nusselt number rises to its maximum at z ~ 0.4 m. Downstream of this location the fluid in the core region has been warmed up by the secondary flow and the descending fluid is no longer at the inlet tempera- ture. Thus the reduction in the surface temperature is less pronounced a n d the Nusselt n u m b e r begins to decay. The intensity of the secondary vortex flow can increase with the axial direction, since the flow of air continues to receive heat from the bottom plate as it moves downstream. Thus the Nusselt n u m b e r can rise with the axial distance. As a result, N u . exhibits a wavy variation with z in the downstream region.
The expected spanwise temperature variations on the heated bottom plate caused by the three-dimen- sional nature of the secondary vortex flow were jus- tified by the present measurements. The local Nusselt n u m b e r distributions were spanwisely uniform at a given axial position prior to the onset of instability, b u t certain spanwise variations ( _ 10%) occurred after the formation of the secondary flow. Since a much larger axial change in the Nusselt n u m b e r fol- lowing the onset of thermal instability was always accompanied by some spanwise variations, the axial distribution of the local Nusselt n u m b e r can be well represented by its spanwise average.
8
_ _ _ Forced Correct.ion Re=f02
oeoe9 Gr=4.3xl04 H=30mm,A=4 i ~ t.2xl0 Pr=0.72 o ~ l.lxlO ) 6, '~ . . . 3.1,10', ==r.== 5.8x10 NU_ z 4 - , ~ . . ~ 0 O. 0 C .12 0.~4 0.16 0.~8 z
(~)
Fig. 5. The spanwise-averaged Nusselt number distributions for various Grashof numbers for Re = 102.
ing its resistance to thermal instability and impeding secondary flow development.
Finally, the present data for the onset of instability are compared with those in the literature for the mixed convective flow in a horizontal plane channel. The onset point is defined as the location where the heat transfer enhanced by the vortex flow is 5% larger than the forced convection value. The results suggest that the onset of thermal instability is delayed for a finite aspect ratio duct, A = 4, considered here [37]. Our instability data can be approximately correlated by the equation
Ra* = 1330(Z~-1.34 (6)
aged Nusselt number are discussed first. Figure 5 depicts the Nu~ distribution for Re = 102 and Gr varied from 4.3 x 10³ to 5.8 × 10⁵. The results indicate that for a given Grashof number each Nuz curve initially follows the forced convection limit. However, the location at which the heat transfer enhancement begins to be noted advances upstream at increasing Grashof numbers. It is important to note that for a higher Grashof number, there is a greater departure from the forced convection limit before a minimum in the Nusselt number is reached. Beyond this minimum
Nu: location rapid velocity boundary layer growth in
the upstream region prevents the secondary flow from fully compensating for the effect of the thickening boundary layer. Hence the Nusselt number, although enhanced above the forced convection limit, continues to decline. They also suggest that the axial oscillations in the Nusselt number will decay to a final fully developed value which increases with the Grashof number.
Next, the effects of the Reynolds number on the
Nuz distributions are examined. Figure 6 demonstrates
that an increase in the Reynolds number shifts the onset of instability .downstream and reduces the Nus- selt number in the downstream region. This effect is expected as the increased flow velocity thins the boundary layer on Lhe bottom plate, thereby increas-
8 Re=51 G r = I . I x t 0 s 102 H = 3 0 m m , A=4 186 P r = 0 . 7 2 NLI z 4 2 - 0
o.o
0.'2
0.'4
0.'6
o.'8
z (m)Fig. 6. The spanwise-averaged Nusselt number distributions for various Reynolds numbers for Gr = 1.1 x 10 5.
3.3. Spanwise time-averaged air temperature dis-
tributions and flow v&ual&ation
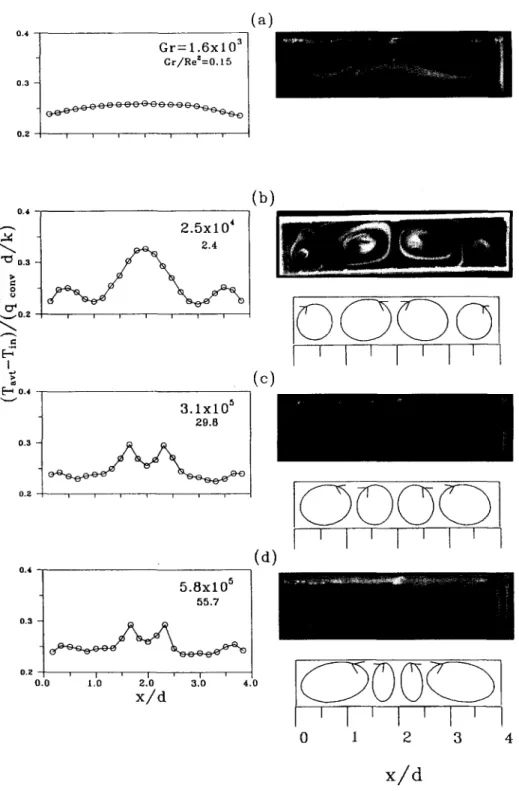
Results for the air temperature variations with the spanwise positions and the flow visualizations can reflect the secondary vortex flow structure, and are to be presented in the following. Figure 7a-d shows the non-dimensional spanwise time-averaged air tem- perature distributions at y/d = 0.5 and z = 0.7 m and the corresponding instantaneous snapshot of the sec- ondary vortex flow for several Grashof numbers with
Re fixed at 102. The reason for presenting the time
average temperature distributions is simply because the flow is time oscillatory at high Grashof numbers. The results for the instantaneous temperature vari- ations will be examined later. At a very low Grashof number (~1600) the spanwise temperature dis- tribution in Fig. 7a is close to that for the fully developed forced convection, implying that the buoy- ancy effect is extremely small. This flow pattern is confirmed by the corresponding instantaneous flow visualization shown. As the Grashof number is raised
to 10 4, significant spanwise temperature variation begins to appear, suggesting the existence of the buoy- ancy driven vortex flow at the cross-section z = 0.7 m. At Gr = 2.5 x 10⁴, three peaks appear in the spanwise temperature distribution shown in Figure 7b, one adjacent to the vertical center plane at x = 60 mm and another two near the side walls, which result from the presence of two pairs of longitudinal vortex rolls in the duct with the flow ascending along the vertical middle plane and the side walls, as evident from the flow visualization and the corresponding sche- matically sketched vortices. The slight asymmetry in the spanwise temperature distribution with respect to the vertical central plane is attributed to the exper- imental disturbances. Similar asymmetry was also found in a longer duct studied by Nyce et al., [42]. As the Grashof number is further raised to 3.1 x 10⁵, two temperature peaks are observed near the vertical center plane (Fig. 7c). This unique temperature dis- tribution is conjectured to result from two pairs of vortices with the upward vortex flow near the peaks and downward flow near the valleys. Note that the induced vortices at this higher Gr rotate in an opposite direction to that in Fig. 7b for Gr = 2.5 × 10⁴, with the
1656 W.L. LIN and T. F. LIN 0.4 ~ G r = 1 . 6 x 1 0 3
0.3 t
G r / R e = = 0 ' i f 0 . 2 1 " r 1 1 , 1 i i(a)
0 . 4o.s
r. .E I ~ o.4 0 . 3 0 . 2 ( b ) 2 . 5 x i 0 4 i i i i i I i 3 . 1 x l O ~29.8
i f i i i(o)
0 . 4(d)
0 . 3 0 . 2 0 . 0 1 .'0 5 . 8 x 1 0 ~ 5 5 . 7 J i i 2 . 1 0 3 . 1 0 4 . 0x/d
I
I
I
I
I
I t
I
i
I
I
I
I I
0 1 2 3x/d
Fig. 7. The time-averaged spanwise temperature distributions at z = 0.7 m and y/d = 0.5 and the instan- taneous flow photos at z = 0.7 m for Re = 102 and various Grashof numbers.
s e c o n d a r y flow d e s c e n d i n g a l o n g the side walls. These vortices are d e s i g n a t e d as the 'reverse vortices' w h i c h m i g h t result f r o m the h i g h e r c o n d u c t i o n h e a t t r a n s f e r t h r o u g h the side walls at h i g h e r Gr. F r o m the associ- ated flow visualization, two pairs o f u n s t e a d y longi- t u d i n a l vortex rolls were o b s e r v e d to swing b a c k a n d f o r t h in the spanwise d i r e c t i o n a n d slowly c h a n g e their shape w i t h time, as detected in the time records o f the
air t e m p e r a t u r e to b e described later. N o t e t h a t the distance between the two p e a k s in the d u c t core is r a t h e r small a n d the i n d u c e d vortex pair n e a r the vertical center p l a n e x = 60 m m is m u c h smaller t h a n the o t h e r pair. Similar results are n o t e d in Fig. 7d for a n even h i g h e r G r a s h o f n u m b e r (Gr ,,~ 5.8 x 10⁵).
Next, the effects o f the R e y n o l d s n u m b e r are exam- ined. As the R e y n o l d s n u m b e r is reduced to 51, the
0 . 4 0 . 3 0 . 2 G r = I . 4 X I O 5
Gr/Re'=53.O
n i i n i I v(a)
o.,~-
. . - . . 1 . 7 X l O s~'~ t
65.3
I b.~ o.4 - 2 . 5 X 1 0 5 9 6 . 1 0 , 3C
~
~
0.2 --
I | I 0 . 0 1 . ' 0 ( b )(o)
I
'
I '
t
~ I '
I
'
I '
I
'
I I
I
20
3o,o
657 _ 1
x / dI
'
I
'
I
~ I '
t
0 1 2 3 4x/d
Fig. 8. The time-averaged spanwise temperature distributions at z = 0.7 m and y/d = 0.5 and the instan- taneous flow photos at z = 0.7 m for Re = 51 and various Grashof numbers.
results from the me, asurement of the spanwise tem- perature distributions and flow visualizations for
Gr/Re2<~ 50 are qualitatively similar to those for Re = 102 in Fig. 7, at the same mixed convection
parameter Gr/Re 2. The results for a higher Gr/Re 2 are presented in Fig. 8. N o t e that for Gr/Re 2 = 53.8 and 65.3, the temperature is low near the side walls and two high temperature peaks are observed near the vertical center plane. Thus two pairs o f reverse vor- tices with the d o w n w a r d secondary flow along the side walls are induced. Like those for Re = 102 these reverse vortices are also unsteady and, in fact, oscillate periodically in time. A t a higher Gr/Re 2 the vortices adjacent to the side walls are bigger. As Gr/Re 2 is further raised over 96.1, there is only one temperature peak in the flow and only one pair of reverse vortices exist in the flow (Fig. 8c). N o t e that the vortex flow descends near the duct sides and ascends in the core region. The observed vortices are steady at
Gr/Re 2 = 96.1. This unique secondary flow pattern o f
one pair o f reverse vortices prevails for an even higher buoyancy, but it becomes unsteady for Gr above 2.9 x 10⁵. The above results for Re = 51 clearly show the changes in the secondary flow patterns from two pairs o f vortices to two pairs of reverse vortices and finally, to one pair o f reverse vortices as the buoyancy force is gradually increased.
3.4. Time records of air temperature and associated
power spectrum densities
Several i m p o r t a n t flow characteristics can be ident- ified in a mixed convective flow through a b o t t o m heated horizontal duct. The appearance of the sec- ondary vortex flow as the Rayleigh n u m b e r exceeds the critical value for the onset o f instability, is the first unique feature already discussed above. The transition o f the steady vortex flow to the unsteady one, the so called ' H o p f bifurcation', at even higher buoyancies
1658 W.L. LIN and T. F. L1N 5 0 . 9 5" o 5 0 . 3 5 2 . 2 v [-~ 5 1 . 6 5 3 . 7 E- 5 3 . 1 0 l z = O . S m I 52.8 [.., 5 2 . 2 z : 0 . 5 m j 55.8 v E-~ 5 5 . 2 z : O . 5 m I 2 4 6 8 I0 t ( s e e ) z : 0 . 6 m I y = 2 5 m m z = 0 . 6 m y = 1 5 m m 57.0 ~ z = 0 . 6 m
I
E-~ 5 6 . 4 0 2 4 6 8 1 0 t ( s e e ) 53.a z = O . T m ] ~ ~ ~- ~ y = 2 5 r n m 5 3 . 2 5v.2 ] z = 0 . V m / 5 6 . 8 . . . . . 58.9 z = 0 . T m y = 5 m m U 5 8 . 3 0 2 ~ 4 ~ ' 6' ' 8 ~ I 0 t ( s e e ) Fig. 9. The time records of the air temperature for Re = 102, Gr = 5.8 x 10⁵ with x = 60 mm and z = 0.5,0.6, 0.7 m at y = 5, 15, 25 mm.
is the second i m p o r t a n t feature to be e x a m i n e d in the following.
Results for the time records o f the air t e m p e r a t u r e at the d e t e c t i o n p o i n t s at x -- 60 m m a n d y = 25 m m at selected cross sections for R e = 102 a n d
Gr = 5.8 x 10⁵, indicate t h a t the t e m p e r a t u r e oscil- lations for z ~< 0.5 m are r a t h e r small in a m p l i t u d e a n d these small a m p l i t u d e oscillations c a n be c o n s i d e r e d to result f r o m the t u r b u l e n c e at the d u c t inlet. T h u s , the t e m p e r a t u r e at these l o c a t i o n s for z ~< 0.5 m c a n be r e g a r d e d as steady. A t z = 0.6 m the tem- p e r a t u r e oscillation is quasiperiodic a n d c o n t a i n s a n u m b e r o f high frequencies, b u t still in small ampli- tude. F u r t h e r d o w n s t r e a m at z = 0.7 m the tem- p e r a t u r e is n o n p e r i o d i c a n d in a larger a m p l i t u d e . T o investigate the d e p e n d e n c e o f the t e m p e r a t u r e oscil- l a t i o n o n the axial a n d vertical positions, Fig. 9 shows the results for the same case with x = 60 m m , z = 0.5, 0.6 a n d 0.7 m at y = 5, 15 a n d 25 m m . T h e results indicate t h a t at z = 0.5 m the three t e m p e r a t u r e traces are steady. A little d o w n s t r e a m at z = 0.6 m, notice- able quasiperiodic oscillations exist at y = 5 a n d 25 mm. M o v i n g f u r t h e r d o w n s t r e a m to the cross-section z = 0.7 m, n o n p e r i o d i c oscillations are seen at all three locations a n d the oscillation is largest at y = 25 mm. Clearly, the oscillations d e p e n d o n the vertical pos- ition to some degree. This finding agrees with the results f r o m n u m e r i c a l s i m u l a t i o n [37]. It is also o f interest to k n o w the d e p e n d e n c e o f the t e m p e r a t u r e o n the spanwise position. T h e results for three spanwise positions, x = 10, 60 a n d 110 m m , at z = 0.7 m for the same case are s h o w n in Fig. 10. N o t e t h a t the t e m p e r a t u r e oscillation d e p e n d s slightly o n the span- wise position.
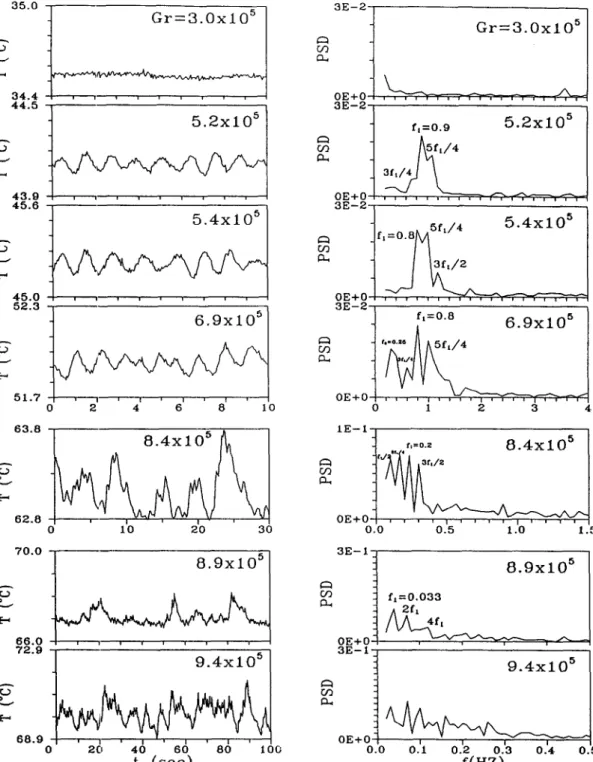
Next, the m e a s u r e d time histories o f the tem- p e r a t u r e for various G r a s h o f n u m b e r s with the Reyn- olds n u m b e r fixed at 102 a n d 51 at the s a m p l i n g p o i n t , x = 60 m m , y = 25 m m a n d z = 0.7 m are, respec- tively, displayed in Figs. 11 a n d 12. T h e results indi-
cate t h a t a t a very low G r a s h o f n u m b e r steady tem- p e r a t u r e is recorded. As the G r a s h o f n u m b e r exceeds a certain critical value, d e p e n d i n g o n the R e y n o l d s n u m b e r , time periodic t e m p e r a t u r e oscillation is seen. T h e associated p o w e r s p e c t r u m densities also given in the figures imply t h a t the t e m p e r a t u r e oscillation is m a i n l y d o m i n a t e d b y a single f u n d a m e n t a l frequency. This f r e q u e n c y is n o t always h i g h e r for a h i g h e r G r a - s h o f n u m b e r . F o r a f u r t h e r increase in the G r a s h o f n u m b e r , a second f u n d a m e n t a l frequency a p p e a r s in the t e m p e r a t u r e f l u c t u a t i o n i n d i c a t i n g the tem- p e r a t u r e is quasiperiodic. This c a n be seen in the curve for Re = 102 a n d Gr = 6.9 x 10⁵. A t a n even h i g h e r 47.5 1 z = 0 . T m o 46.9
53.a
z = 0 . 7 m
I
x = 6 0 m m
P
63.2 4 8 . 6 ~z : O . ~ m
48.0 i , L , i , ~ , ~ , 0 2 4 6 8 10 t ( s e e )Fig. 10. The time records of the air temperature for Re = 102,
G r = 5 . 8 x 1 0 5 a t z = 0 . 7 m , y = 2 5 m m a n d x = 10,60,110 mm.
3 5 . 0 3 4 . 4 4 4 . 5 E-. 4 3 . 9 4 5 . 6 L~ 4 5 . 0 5 2 . 3 o 5 1 . 7 5 . 4 x 1 0 ~ , , , , , 6 " 9 x 1 0 5 0 2 4 6 8 I 0 6 3 . 8
g
6 2 . 0!
0 I 0 2 0 3 0 7 0 . 0 r.9 66.0 7 2 . 9 r.) *._.. F-, 6 8 . 9 0 ~ ~ 9 " 4 x 1 0 5 2 0 4 0 6 0 8 0 1 0 0 t ( s e c ) O 0 D ~ 5 0 D ~ 5 0 O ~ 5 0 3 E - 2 0 E + 0 3 E - 2 t , = o . 95.2x10⁵
~ f t / 4 0 E + 0 , ,' - ~ , , , ~ , ~ 2 c , , , , , ~ , , 3 E - 2 iI f, = o.8/~/~5ft/4
5"4xi05
O E + O " , : . . . ~", , ~ , ~ 3 E - 2 I"F AA
Q = 0 . 86"9X10⁵
0 E + 0 1 . . . ,f"7"~, ~ - , " 0 1 2 3 4 I E - Ij ,
,,-o.~ 8 . 4 X 1 0 5[
O E + O . . . . . , . . . . i . . . . i 0 . 0 0 . 5 i .0 1 . 531/ 9x
C.~ f 1 = 0 . 0 3 3 ^ 2 f t 0 E + 0 / , , , v - / ~ - , 3 E - I O E + O , i i i i 0 . 0 0 . 1 0 . 2 0 . 3 0 . 4 0 . 5 f ( H Z )Fig. 11. The time records of the air temperature and the corresponding power spectrum densities for Re = 102 and various Grashof numbers at z = 0.7 m, x = 60 mm and y = 25 mm.
G r a s h o f number Gr >~ 7 . 4 x 10⁵, irregular tem- perature oscillations prevail in the flow for R e = 102. But for R e = 51 the situation is somewhat different. There is a reverse H o p f bifurcation for G r a s h o f num- ber in the range o f 1.9 x 10⁵-2.9 x 10⁵. This reverse H o p f bifurcation takes place when there is a cor- responding change in the secondary flow patterns from two pairs o f reverse vortices, to one pair of reverse vortices shown in Fig. 8b,c. A n o t h e r reverse
transition also tends to occur for Gr >>. 5.5 x 10 5 by noting the reduction in the oscillation amplitude at increasing Gr. But since the heated plate temperature is already very close to the design limit o f our exper- imental system at these high G r a s h o f numbers, tests were forced to stop here.
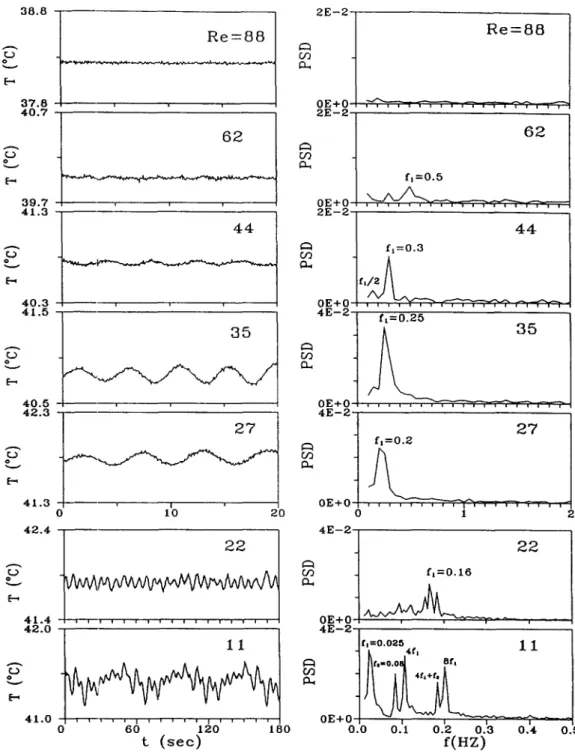
T o further illustrate the characteristics o f the tem- perature oscillations, tests were conducted for a fixed G r a s h o f n u m b e r with the Reynolds n u m b e r varied.
1660 W . L . L I N a n d T. F. L I N 3 8 . 4 o E-, 3 7 . 6 3 9 . 9 E-" 3 9 . 1
40.8
40.0 4 5 . 1 o 4 4 , 3 4 8 . 3 4 7 . 5 G r = 1 . 2 x I o S I 1 . 6 x l O s 0 1 0 2 0 0 3 0 3 ¢:::1 r J? ¢:U r.O C l r./3 I:U 2 E - 2 G r = 1 . 2 x l O ~ I 0 E + 0 ~ , , , 7 7 - - ; r-;--, ~ , " ' ~ 7 " 14E-2
1
3 t ' , / 4 /~l'4xlOS
f ~ = 0 . 5 O E + O , ~ , , , ~ , , ~ , . , , - , - , , 7 0 E + 0 . . . ~ , , ,3E-Zj
2 . 5 x 1 0 5 f t = 0 . 3 oP.+o ~ . . . .!
i0 I
0 E + 0 , , , , , , , , i , , i i , , ; ,' 0 . 0 0 . 5 1 .O 1 . 5 2 . 0 5 3 . 6G"
E-, 5 2 . 3 0 1 0 2 0 3 0 4 0 5 0 1 . 2 E - I O . O E + O 0 . 0i
5
Gr=4"7x10⁵
0 . 5 1 . 0 1 . 5 2 . 0 6 3 . 1 6 2 . 3 0t
1 0 2 0 ( s e c ) U3 7E--210E+0 " ~ s t ' 5 " 5 X i 0 5 . . . ,z'y~- . . . . , . . . . i O.O 0 . 5f(HZ)
1 . 0 1 . 5 2 . 0 Fig. 12. T h e t i m e r e c o r d s o f t h e a i r t e m p e r a t u r e a n d t h e c o r r e s p o n d i n g p o w e r s p e c t r u m d e n s i t i e s f o r R e = 51 a n d v a r i o u s G r a s h o f n u m b e r s a t z = 0.7 m , x = 60 m m a n d y = 25 m m .First, the temperature traces for Gr = 8.6 × l 0 4 at the location x = 60 mm, y = 25 mm and z = 0.7 m with the Reynolds number reduced from 51 to 9 are recorded. All the temperature records were found to be steady. But when the Grashof number is fixed at a higher value of 2 × 10⁵, reducing the Reynolds number from 88 can cause the flow to change from a steady state to a time periodic state for Re = 44, 35 and 27
(Fig. 13). Note that the oscillation frequency is lower for a smaller Reynolds number for these three cases. As the Reynolds number is lowered to 22, nonperiodic temperature oscillations appear. At an even low Reyn- olds number ( = 11) the temperature fluctuation is irregular. Similar results were obtained for a still higher Grashof number.
3 8 . 8 r . . . ) o [-, 3 7 . 8 4 0 . 7 L . 39.7 4 1 . 3 r . . ) 4 0 . 3 4 1 . 5 o._. 4 0 . 5 4 2 . 3
F
F - 4 1 . 3 4 2 . 4 L ) 4 1 . 4 4 2 . 0 4 1 . 0R e = 8 8
6 2
2 7
1'o
zo
2 2
i i i i i i i i i i i ~ ~ i i i i 2 E - 2¢n~m
R e = 8 8
O E + O , ~ , , , ~ , 2 E - - 26 2
~o f t = 0 . 5 0 E + 0 . . . . . . . . . . . . ,-~,"~'"~,, ,-"7 , , , 2 E - 2 4 4 f z = 0 . 3 Ca., / 2 ~ ^ _ O E + O i i l ~-~---~ ~ i i i i i i i i i i i i A-~,_-.~ i i i i i 4 E - 2 f t = 0 . 2 53 5
Q., O E + O . . . 4 E - 2 O E + O ] . . . . . . . . . . . . ~ , , , , 0 I 2 4 E - 22 2
fz=O.16,
h
A
O E + O A ~ f l , V ,~ - " " r " - L , .... 4 E - 2 / I~t,-o.od at, O~ 4tL÷t, 0 E + 0 ~ - 0 6 0 1 2 0 1 8 0 0 . 0 0 . 1 O J2 0 . 3 0 . 4 0 . 5t
f ( n z )
Fig. 13. The tirae records of the air temperature and the corresponding power spectrum densities for
Gr = 2.0 x l05 and various Reynolds numbers at z = 0.7 m, x = 60 mm and y = 25 ram.
Reynolds and G r a s h o f numbers, a flow regime m a p characterizing the temporal state of the flow is given in Fig. 14. The result:~ indicate that the flow is steady at a low G r a s h o f number, beyond a certain critical G r a s h o f n u m b e r a periodic oscillation is induced, and the oscillation becomes chaotic at a higher G r a s h o f number. F o r practical use, a correlating equation to fit the boundary between the steady and periodic flow regimes for the present data is proposed,
Gr = 200(Re) 1.6 (7)
4 . C O N C L U D I N G R E M A R K S
We have performed an experimental study con- cerning the effects of the Reynolds and G r a s h o f num- bers on the flow transition in a mixed convective air flow through a b o t t o m heated horizontal rectangular duct, by systematic measurement o f the heat transfer coefficient and time records of the air temperature. Additionally, the measurements of the time-averaged spanwise temperature distributions and the instan- taneous flow visualizations were also conducted. The
1662 W.L. LIN and T. F. LIN o o o o o No rolls , R e : 5 l a • oo°° Steady , Pr=0.72 aaaaa Periodic 1.2E+6 , , . , , Chaotic _ _ Gr=200(Re) t6 " Gr - - - Onset of i n s t a b i l i t y a aa 4 . 0 E + 5 a a a a ' a a a a a a a a ° • • i l a{~ j • 1 . 6 E + 3 . . . ,-, S 7 , - , . 7,-, ~ 7 ~ , . 7 , - , . 7 ~ - , . 7 , - , . [ , , 5 8 1 0 0 1 5 0 2 0 0 Re
Fig. 14. The flow regime map for various Reynolds and Grashof numbers for Pr = 0.72.
experiments were carried o u t for the R e y n o l d s n u m - bers r a n g i n g f r o m 9 to 186 a n d the G r a s h o f n u m b e r s u p to 5 × 10⁶. T h e conclusions o b t a i n e d are as follows : (1) In the e n t r y region the u p w a r d b u o y a n c y force thickens the t h e r m a l b o u n d a r y layer p r i o r to the onset o f t h e r m a l instability. T h e Nusselt n u m b e r shows a r a p i d decline with the d o w n s t r e a m distance a n d is slightly smaller t h a n the forced c o n v e c t i o n limit. B e y o n d the onset o f stability, h e a t t r a n s f e r e n h a n c e - m e n t was a t t r i b u t e d to the f o r m a t i o n a n d devel- o p m e n t o f a b u o y a n c y d r i v e n s e c o n d a r y vortex flow.
(2) T h e onset o f t h e r m a l instability was f o u n d to m o v e u p s t r e a m for increasing G r a s h o f n u m b e r a n d decreasing R e y n o l d s n u m b e r .
(3) Results for the t i m e - a v e r a g e d air t e m p e r a t u r e v a r i a t i o n s w i t h the spanwise positions a n d the i n s t a n - t a n e o u s flow visualization reflect the s e c o n d a r y vortex flow s t r u c t u r e a n d the t e m p o r a l state o f the flow.
(4) As the G r a s h o f n u m b e r is high e n o u g h , the t r a n s i t i o n o f the steady vortex flow to the time p e r i o d one, the so called H o p f b i f u r c a t i o n , could occur. F u r - t h e r raising the G r a s h o f n u m b e r causes the flow to c h a n g e f r o m a periodic to a q u a s i p e r i o d i c a n d even to a chaotic state. Similar t r e n d s are n o t e d w i t h decreas- ing R e y n o l d s n u m b e r . T h u s , the flow t r a n s i t i o n fol- lows the Ruelle--Taken r o u t e to chaos. A regime m a p for c h a r a c t e r i z i n g the t e m p o r a l state o f the flow was given a n d the c o r r e l a t i n g e q u a t i o n for the H o p f bifur- c a t i o n was p r o p o s e d .
Acknowledgement--The financial support of this study by the engineering division of National Science Council of Taiwan, Republic of China through the contract NSC82-0404-E-009- 141 is greatly appreciated.
REFERENCES
I. F. P. lncropera, Convective heat transfer in electronic equipment cooling, J. Heat Transfer 110, 1097-1111 (1988).
2. W. M. Kays and A. L. London, Compact Heat
Exchangers (3rd Edn). McGraw-Hill, New York (1984).
3. G. Evan and R. Grief, A study of traveling wave insta- bilities in a horizontal channel flow with applications to chemical vapor deposition, Int. J. Heat Mass Transfer
32, 895-911 (1989).
4. Y. Mori and Y. Uchida, Forced convective heat transfer between horizontal fiat plates, Int. J. Heat Mass Transfer
9, 803-817 (1966).
5. M. Akiyama, G. J. Hwang and K. C. Cheng, Experi- ments on the onset of longitudinal vortices in laminar forced convection between horizontal plates, J. Heat Transfer 93, 335-341 (1971).
6. S. Ostrach and Y. Kamotani, Heat transfer aug- mentation in laminar fully developed channel flow by means of heating from below, J. Heat Trans/er 97, 220- 225 (1975).
7. Y. Kamotani and S. Ostrach, Effect of thermal instability on thermally developing laminar channel flow, J. Heat Transfer 98, 62-66 (1976).
8. G. J. Hwang and C. L. Liu, An experimental study of convective instability in the thermal entrance region of a horizontal parallel-plate channel heated from below,
Can. J. Chem. Engng .qul, 521 525 (1976).
9. Y. Kamotani, S. Ostrach and H. Miao, Convective heat transfer augmentation in thermal entrance regions by means of thermal instability, J. Heat Transfer 101, 222- 226 (1979).
10. K. C. Chiu and F. Rosenberger, Mixed convection between horizontal plates--I. Entrance effects, Int. J. Heat Mass Transfer 30, 1645 1654 (1987).
11. K. C. Chiu, J. Ouazzani and F. Rosenberger, Mixed convection between horizontal plates--lI. Fully developed flow, Int. J. Heat Transfer 30, 1655-1662 (1987).
12. M. T. Ouazzani, J. P. Caltagirone, G. Meyer and A. Mojtabi, Etude numrrique et exprrimental de la con- vection mixte entre deux plans horizontaux, Int. J. Heat Mass Transfer 32, 261-269 (1989).
13. M. T. Ouazzani, J. K. Platten and A. Mojtabi, Etude exprrimental de la convection mixte entre deux plans horizontaux ~, temprratures diffrrents--II, Int. J. Heat Mass Transfer 33, 1417-1427 (1990).
14. D. G. Osborne and F. P. Incropera, Laminar, mixed convection heat transfer for flow between horizontal par- allel plates with asymmetric heating, Int. J. Heat Mass Transfer 28, 207~217 (1985).
15. D. G. Osborne and F. P. lncropera, Experimental study of mixed convection heat transfer for transitional and turbulent flow between horizontal, parallel plates, Int. J. Heat mass Transfer 28, 1337-1344 (1985).
16. F. P. Incropera, A. L. Knox and J. A. Schutt, Onset of thermally driven secondary flow in horizontal rec- tangular ducts, Proceedings o f the eohth International Heat Transfer Conference, San Francisco, pp. 1395 1400 (1986).
17. F. P. Incropera, A. L. Knox and J. R. Maughan, Mixed- convection flow and heat transfer in the entry region of a horizontal rectangular duct, J. Heat Transfer 109, 434- 439 (1987).
18. J. R. Maughana and F. P. Incropera, Experiments on mixed convection heat transfer for airflow in a horizontal and inclined channel, Int. J. Heat Transfer 30, 1307 1318 (1987).
19. J. R. Maughan and F. P, Incropera, Regions of Heat transfer enhancement for laminar mixed convection in a parallel plate channel, Int. J. Heat Mass Transfer 33, 555-570 (1990).
20. W. Nakakyama, G. J. Hwang and K.C. Cheng, Thermal instability in plane poiseuille flow, J. Heat Transfer 92, 61-68 (1970).
21. G. J. Hwang and K. C. Cheng, Convective instability in the thermal entrance region of a horizontal parallel-plate channel heated from below. J. Heat Transfer 95, 72-77 (1973).
22. F. S. Lee and G. J. Hwang, Transient analysis on the onset of thermal instability in the thermal entrance region of a horizontal parallel plate channel, J. Heat Transfer 113, 363-370 (1991).
23. K. C. Cheng and G. J. Hwang, Numerical solution for combined free and forced laminar convection in hori- zontal rectangular channels, J. Heat Transfer 91, 59-66 (1969).
24. K. C. Cheng, S. W. Hong and G. J. Hwang, Buoyancy effects on laminar l:Leat transfer in the thermal entrance region of horizontal rectangular channels with uniform wall heat flux for large Prandtl number fluid, Int. J. Heat
Mass Transfer 15, 1819-1836 (1972).
25. J.W. Ou, K. C. Che:ag and R. C. Lin, Natural convection effects on Graetz problem in horizontal rectangular channels with uniform wall temperature for large Pr, Int.
J. Heat Mass Transfer 15, 835-843 (1974).
26. K. C. Cheng and J. W. Ou, Convective instability and finite amplitude convection in the thermal entrance region of horizontal rectangular channels heated from below, Proceedings of the seventh International Heat
Transfer Conference, Munish, Germany, paper NC-12,
pp. 189-194 (1982).
27. K. C. Cheng and J. W. Ou, Buoyancy and tilt angle effects on Graetz problem in horizontal rectangular channels, Proceedings of A S M E - J S M E Join t Conference
on Thermal Engineering, Vol. 3, pp. 141-147 (1983).
28. F. C. Chou and G. L Hwang, Vorticity velocity method for the Graetz problem and the effect of natural con- vection in a horizon Lal rectangular channel with uniform wall heat flux, H. Heat Transfer 109, 704-710 (1987). 29. G. J. Hwang and F. C. Chou, Effect of wall conduction
on combined free ard forced laminar convection in hori- zontal rectangular channels, J. Heat Transfer 109, 936- 942 (1987).
30. F. C. Chou and W. Y. Lien, Effect of wall heat con- duction on laminar mixed convection in the thermal entrance region of horizontal rectangular channels, War-
meund Sofffiber tragung 26, 121 - 127 (1991).
31. J. M. Huang, J. D. Lin and F. C. Chou, Combined radiation and laminar mixed convection in the thermal entrance region of horizontal isothermal rectangular channels, Numer. Heat Transfer 18, 113-125 (1990). 32. F. P. Incropera and J. A. Schutt, Numerical simulation
of laminar mixed convection in the entrance region of horizontal rectangular ducts, Numer. Heat Transfer 8, 707-729 (1985).
33. H. V. Mahaney, F. P. Incropera and S. Ramadhyani, Development of laminar mixed convection flow in a horizontal rectangular duct with uniform bottom heat- ing, Numer. Heat Transfer 12, 137-155 (1987). 34. H. V. Mahaney, F. P. Incropera and S. Ramadhyani,
Effect of wall heat flux distribution on laminar mixed convection in the entrance region of a horizontal rec- tangular duct, Numer. Heat Transfer 13, 427-450 (1988). 35. H. V. Mahaney, S. Ramadhyani and F. P. Incropera, Numerical simulation of three-dimensional mixed con- vection heat transfer from an array of discrete heat sour- ces in a horizontal rectangular duct, Numer. Heat Trans-
fer 16, 267-286 (1989).
36. J. R. Maughan and F. P. Incropera, Fully developed mixed convection in a horizontal channel heated uni- formly from above and below, Numer. Heat Transfer 17, 417-430 (1990).
37. C. C. Huang and T. F. Lin, Buoyancy induced flow transition in mixed convective flow of air through a bottom heated horizontal rectangular duct, Int. J. Heat
Mass Transfer 37, 1235-1255 (1994).
38. H. K. Moffat and K. F. Jensen, Complex flow phenom- ena in MOCVD reactors, J. Crystal Growth 77, 108-119 (1986).
39. H . K . Moffat and K. F. Jensen, Three-dimensional flow effects in silicon CVD in horizontal reactors, J. Electron-
Chem. Soc. 135, 459-471 (1988).
40. R. K. Shah and A. L. London, Laminar Flow Force
Convection in Ducts, pp. 196-198. Academic Press, New
York (1978).
41. S. J. Kline and F. A. McClintock, Describing uncer- tainties in single-sample experiments, Mech. Engng 75, 3-12 (1953).
42. T. A. Nyce, J. Ouazzani, A. Durand-Daubin and F. Rosenberger, Mixed convection in a horizontal rec- tangular channel-experimental and numerical velocity distributions, Int. J. Heat Mass Transfer 35, 1481-1494 (1992).