Transition States and Nonlinear Excitations in Chloroform
Observed with a Sub-5 fs Pulse Laser
Izumi Iwakura,†,‡Atsushi Yabushita,§and Takayoshi Kobayashi*,‡,§,|,⊥ JSPS Research Fellow, 8 Ichibancho, Chiyoda-ku, Tokyo 102-8472, Japan, Department of
Applied Physics and Chemistry and Institute for Laser Science, UniVersity of Electro-Communications, 1-5-1 Chofugaoka, Chofu, Tokyo 182-8585, Japan, Department of
Electrophysics, National Chiao-Tung UniVersity, Hsinchu 300, Taiwan, ICORP, JST, 4-1-8 Honcho, Kawaguchi, Saitama, 332-0012, Japan, and Institute of Laser Engineering, Osaka
UniVersity, 2-6 Yamada-oka, Suita, Osaka 565-0971, Japan Received March 12, 2008; E-mail: [email protected]
Abstract: Sub-5 fs pulse dynamics observed in neat chloroform (CHCl3) and the CHCl3· · · O2charge-transfer complex in oxygen-saturated chloroform (O2-CHCl3) were found to be dominated by wave packet motions in the excited state and the ground state, respectively. The time-resolved signal of CHCl3exhibits dynamics in the electronic excited state generated by a three-photon absorption process, and that of O2-CHCl3is explained in terms of the dynamics of the electronic ground state excited by the stimulated Raman process. In addition, we found that the oxidation reaction of chloroform in the charge-transfer complex of chloroform and oxygen easily proceeds via a C-H insertion process triggered by the stimulated Raman process under the irradiation of a visible laser pulse. The spectrogram analysis enabled direct observation of the real-time dynamics of the Raman-triggered oxidation process. These results demonstrate that observation of transition states by sub-5 fs time-resolved spectroscopy is applicable to “ground-state reactions” as well as “excited-state reactions” via stimulated Raman excitation in a wide variety of chemical reactions.
1. Introduction
Chloroform is formed in drinking water from chlorine dissolved for the prevention of disinfections. It is also produced in the haloform reaction with organic substances (urine, sweat, and skin particles) in swimming pools disinfected with chlorine or hypochlorous acid. Under the influence of air and sunlight, chloroform produces poisonous phosgene, hydrochloric acid, and carbon dioxide.1 Chloroform plays a significant role in organic synthesis as one of the most frequently used solvents and is also known to be carcinogenic. Therefore, it is important to understand the chloroform reaction mechanism to avoid its hazardous effects.
The technology to generate ultrashort pulses has developed rapidly since the late 1990s. In 2001-2002, our group developed the technique of noncollinear optical parametric amplifier (NOPA) and introduced pulse-front matching, angularly
dis-persed pump beam, and compressions with a prism pair, a grating pair, a chirped mirror, and a deformable mirror.2Several other groups also contributed to the development of NOPA.3 As a result of this work, the generation of stable visible-near-infrared 5-fs laser pulses became possible.2dUtilizing such short pulses, it is now possible to directly observe transition states (TS) during chemical reactions by real-time vibrational spec-troscopy with a pump-probe scheme. Typical molecular vibrations, such as carbonyl stretching modes, have periods in the 20 fs range. Therefore, structural changes in the reaction process can be traced by the real-time observation of changes in the instantaneous frequency of molecular vibrations, as has already been reported in our previous work on the real-time observations of various photochemical processes including photoisomerization in bacteriorhodopsin.4
NOPA spectra have an extremely broad spectral width of 5200 cm-1, extending from 500 to 725 nm. Therefore, the stimulated Raman process by the laser pulse can generate a thermally nonequilibrium state, in which a fraction of the †JSPS Research Fellow.
‡University of Electro-Communications. §National Chiao-Tung University. |
ICORP, JST. ⊥Osaka University.
(1) (a) Schoorl; van den Berg, Chem. Centr. 1905, II, 1623. (b) Herman, I. P.; Magnotta, F.; Buss, R. J.; Lee, Y. T. J. Chem. Phys. 1983, 94, 1789–1794. (c) Azciratet, M. L.; Quel, E. J.; Toselli, B.; Ferrero, J. C.; Staricco, E. H. J. Phys. Chem. 1988, 92, 403–408. (d) Azca´rate, M. L.; Quel, E. J. J. Phys. Chem. 1989, 93, 697–702. (e) Freytes, V. M.; Codnia, J.; Azca´rate, M. L. Photochem. Photobiol. 2005, 81, 789– 792. (f) Yu, W. H. S.; Wijnen, M. H. J. J. Chem. Phys. 1970, 52, 2736–2739. (g) Eskola, A. J.; Geppert, W. D.; Rissanen, M. P.; Timonen, R. S.; Halonen, L. J. Phys. Chem. A 2005, 109, 5376–5681. (h) Tominaga, K.; Yoshihara, K. J. Phys. Chem. A 1998, 102, 4222– 4228.
(2) (a) Shirakawa, A.; Sakane, I.; Kobayashi, T. Opt. Lett. 1988, 23, 1292– 1295. (b) Shirakawa, A.; Sakane, I.; Takasaka, M.; Kobayashi, T. Appl.
Phys. Lett. 1999, 19, 2268–2270. (c) Baltuska, A.; Kobayashi, T. Appl. Phys. B: Laser Opt. 2002, 75, 427–443. (d) Baltuska, A.; Fuji, T.;
Kobayashi, T. Opt. Lett. 2002, 27, 306–308.
(3) (a) Cerullo, G.; Nisoli, M.; De Silvestri, S. Appl. Phys. Lett. 1997,
71, 3616–3618. (b) Cerullo, G.; Nisoli, M.; Stagira, S. Opt. Lett. 1998, 23, 1283–1285. (c) Wilhelm, T.; Piel, J.; Riedle, E. Opt. Lett. 1997, 22, 1494–1497. (d) Piel, J.; Beutter, M.; Riedle, E. Opt. Lett. 2000, 25, 180–182.
(4) (a) Kobayashi, T.; Saito, T.; Ohtani, H. Nature 2001, 414, 531–534. (b) Kobayashi, T.; Wang, H.; Wang, Z.; Otsubo, T. Chem. Phys. Lett. 2006, 426, 105–110. (c) Kobayashi, T.; Yabushita, A.; Saito, T.; Ohtani, H.; Tsuda, M. Photochem. Photobiol. 2007, 83, 363–368.
688 J. AM. CHEM. SOC. 2009, 131, 688–696
tion of oxidized chloroform, easily proceeds via a C-H insertion process.
2. Experimental Section
2.1. Pump Probe Experiment. A sub-5 fs pulse laser developed in our group was used to observe the photoreaction of chloroform. Pump and probe pulses were generated by a NOPA seeded by a white-light continuum with a sub-5 fs pulse compressor system.2c,d The pump source of the NOPA was a regenerative amplifier (Spectra Physics, model Spitfire), whose pulse duration, central wavelength, and repetition rate were 100 fs, 790 nm, and 5 kHz, respectively. The spectrum of the pulse extending from 525 to 725 nm (Figure SI 1 in the Supporting Information) had a nearly constant phase. The focus areas of the pump and probe pulses were 100 and 75µm2, respectively, with a common center on a back surface of the front wall plate of a cell of 1 mm-optical path length. The polarizations of the pump and probe pulses were parallel to each other. All measurements were performed at room temperature (295 ( 1 K). Time-resolved difference transmittance ∆T at 128 wavelengths in the spectral range extending from 525 to 725 nm was measured simultaneously using a multichannel lock-in amplifier coupled to a polychromater. Dehydrated chloroform (>99.5%) was purchased from Kanto Kagaku and used without further purification to prepare the following two kinds of samples. Chloroform was bubbled with oxygen gas for 5 h to prepare oxygen-saturated chloroform as one sample, abbreviated as O2-CHCl3. In the other sample, chloroform was bubbled with nitrogen gas for 5 h to remove dissolved oxygen and prepare deoxidized chloroform, abbreviated simply as CHCl3.
2.2. Computational Methods. The Gaussian 03 program was used for the calculations. Geometry optimizations were performed with B3LYP/6-311+G**//B3LYP/6-311+G**.6For the d orbital, 5d functions were used. The calculation was performed without assuming any symmetry. The frequency calculations were per-formed for all of the obtained structures at the same level. It was confirmed that all of the frequencies were real for the ground states and there is only one imaginary frequency for the TS. Vectors of the imaginary frequencies directed the reaction mode, and intrinsic reaction coordinate calculations were further performed to confirm that the obtained TS was on the saddle points of the energy surface between the reactant and product.
3. Results and Discussion
3.1. Stationary Ultraviolet (UV) Spectroscopy. Chloroform absorbs ultraviolet light under sunlight irradiation, which causes photodissociation into CCl2and CHCl2radicals.1These radicals can easily dimerize. In the presence of oxygen, the
photoirra-diation of chloroform also generates the poisonous phosgene. We performed pump-probe experiments using the sub-5 fs pulse laser to clarify the difference in the photoreactivity between pure chloroform (CHCl3) and oxygen-containing chloroform (O2-CHCl3).
Chloroform has absorption peaks around 7.3, 8.2, and 8.7 eV.7The transition energy between n (Cl 3p) and σ* (C-Cl) in the lowest excited state is 7.3 eV (170 nm).8UV spectra in the range between 200 and 800 nm were recorded on a Shimadzu model UV-3101PC spectrophotometer. Chloroform does not absorb in the available spectral range. However, an absorption peak is found in the vicinity of 280 nm after subtracting the absorption spectrum of CHCl3 from that of O2-CHCl3(Figure 1). Because of oversubtraction due to the replacement of CHCl3, the O2-CHCl3absorbance at the shortest wavelengths shows a negative value. The peak in the vicinity of 280 nm is considered to be a CT band of chloroform and oxygen from O2-CHCl3. The ionization energy and electron affinity of chloroform are Ip ) 11.37 and Eea ) 1.76 eV, respectively. The absorption peak energy, observed at ca. 35 398 cm-1 (282.5 nm), is close to the electron transition energy reported for the CT complex of organic solvents and oxygen during the oxygen transition of A3rX3.9
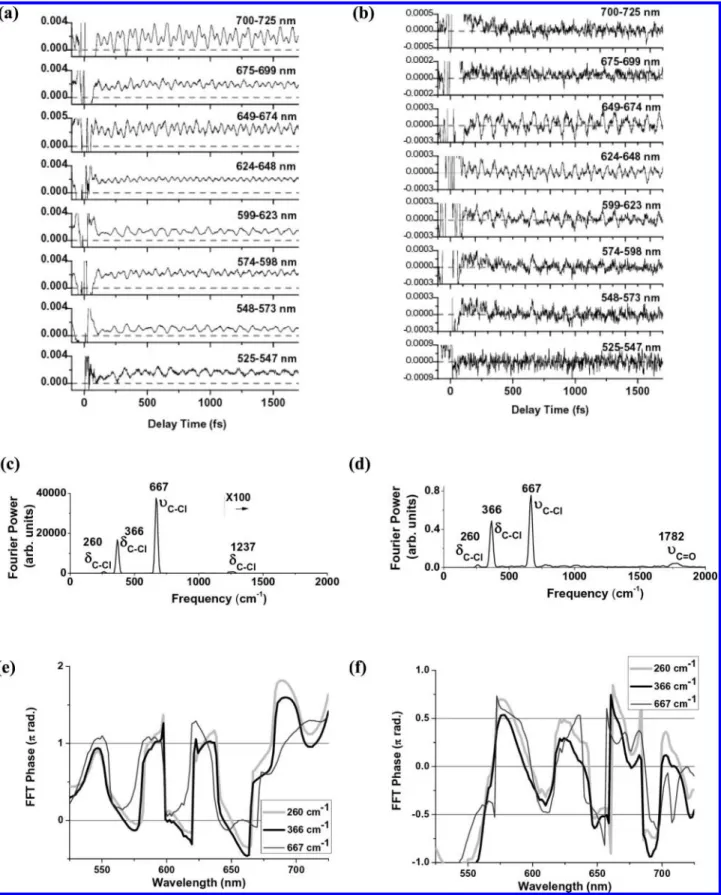
3.2. Pump-Probe Experiment. We used a sub-5 fs pulse from the NOPA to observe the real-time dynamics of each sample. The experiments were performed at intensities of the pump and probe pulses of 2200 and 480 GW cm-2, respectively. Experimental results of real-time traces (from -100 to 1700 fs) averaged over 16 probe channels are shown in Figure 2a and b. The signal of absorbance change∆A was positive in the full wavelength area between 525 and 725 nm in CHCl3as shown in Figure 2a, while an oscillatory signal of∆A appeared around∆A ) 0 in the case of the O2-CHCl3sample [Figure 2b].
Fast Fourier transform (FFT) power spectra of the real-time traces were obtained, averaged over all of the probe spectral channels (128 channels) [Figure 2c and d]. In the case of CHCl3[Figure 2c], theδC-H(δ: deformation mode) peak appeared at 1237 cm-1, which was blue-shifted by 19 cm-1 from the Raman frequency of chloroform (1218 cm-1).10This blue shift is because nonbonding (n) (Cl 3p) electrons are expected to partially flow into the C-H bond (5) (a) Shen, Y. R. The Principles of Nonlinear Optics; Wiley-Interscience:
New York, 1984. (b) Boyd, R. W. Nonlinear Optics; Academic Press Inc.: New York, 1992. (c) Mills, D. L. Nonlinear Optics; Springer: New York, 1998.
(6) (a) Frisch, M. J. Gaussian 03, revision, D.02; Gaussian, Inc.: Wallingford, CT, 2004. Details are shown in ref S1 in the Supporting Information. (b) Becke, A. D. J. Chem. Phys. 1993, 98, 5648–5652. (c) Lee, C.; Yang, W.; Parr, R. G. Phys. ReV. B 1988, 37, 785–789.
(7) Landolt-Bornstein Zahlenwerte und Funktionen aus Physik, Chemie,
Astronomie, Geophysik und Technik; 3 Teil, Molekeln II;
Springer-Verlag: New York, 1951.
(8) Ying, J. F.; Leung, K. T. Phys. ReV. A 1984, 53, 1476–1486. (9) Huber, K. P.; Herzberg, G. Constants of Diatomic Molecules; Van
Nostrand Reinhold: New York, 1979.
(10) Rothschild, W. G.; Rosasco, G. J.; Livingston, R. C. J. Chem. Phys. 1975, 62, 1253–1268.
that of the nitrogen-bubbled sample.
due to quantum mechanical resonance. TheδC-Cl (260 and 366 cm-1) andυC-Cl(υ: stretching mode) (667 cm-1) peaks observed for CHCl3 [Figure 2c] are not shifted from the Raman frequencies of chloroform (262, 367, and 669 cm-1)10
within experimental uncertainty. The reason why any shift could not be detected is because the δC-Cland υC-Clhave low frequencies and their frequency shifts are expected to be relatively small as compared to the frequency resolution
Figure 2. Real-time traces (-100 to 1700 fs) averaged over 16 probe channels obtained for (a) CHCl3and (b) O2-CHCl3. FFT power spectra of the
real-time traces were obtained over 128 probe channels. The FFT power spectra were averaged over all probe channels for (c) CHCl3and (d) O2-CHCl3.
The phases of the observed molecular vibrations are shown in (e) CHCl3and (f) O2-CHCl3.
stretching mode (υCdO). The oxidation reaction of chloroform is triggered by the visible pulse irradiation to the CT complex of chloroform and oxygen followed by the generation of phosgene.11It is thought that the peak around 1000 cm-1of O2-CHCl3is due to the reaction intermediate.
In addition, the phases of the observed molecular vibrations (260, 366, and 667 cm-1) obtained by the Fourier analysis of the real-time traces for CHCl3 and O2-CHCl3 show that molecular vibrations in CHCl3and O2-CHCl3are cosine-like and sine-like, respectively [Figure 2e and f].
By analyzing the measured real-time trace, we found that the instantaneous frequencies of molecular vibrations are modulated, although the absorption band of chloroform is completely out of the laser’s spectral range (525-725 nm). This is explained as follows. The broadband visible pump pulse excites CHCl3 to the lowest excited singlet state (7.3 eV) via a three-photon absorption process, which is detected by the probe pulse as a transition to a higher excited state. Therefore, the observed difference absorbance (∆A) has a positive sign and its oscillation is cosine-like. On the other hand, the absorbance change of O2-CHCl3 is almost 0 and its oscillation is sine-like, which indicates that the signal is induced by the stimulated Raman process in the ground state.
The reason for the difference in the relevant electronic states between the two cases is given as follows. The formation of the oxygen and chloroform complex decreases the electronic transition energy from 7.3 eV (170 nm) to 4.4 eV (280 nm) by the CT interaction. The transition energy of 4.4 eV is due to the CT band, which is expected to increase the polarizability upon excitation, resulting in an increase in the Raman cross section. The transition is still nonresonant even after lowering the electronic transition energy by the CT complex formation. The detuning energy is reduced from 4.8 eV of CHCl3to 1.9 eV, or even less, because of the dielectric stabilization by the solvent. This results in broader spectral characteristics, such as tailing to the long wavelength region, due to the properties of the CT complex. Therefore, the CHCl3· · · O2CT complex was more efficiently excited by the near-resonance enhancement effect.
The change in the instantaneous frequencies of the molecular vibrations in chloroform could be observed even though the absorption band of chloroform does not overlap with the visible laser spectrum. From the sign of ∆A and the phase of the molecular vibration, it can be concluded that the dynamics observed in CHCl3and O2-CHCl3are predominantly due to wave packet motions in the lowest excited state and the ground state, respectively. As discussed above, the time-resolved signal of CHCl3shows vibrational dynamics in the lowest excited state generated by the three-photon absorption process, and that of
O2-CHCl3shows the dynamics of the ground state vibrationally activated by the stimulated Raman process. Therefore, the vibrational amplitudes observed for CHCl3and O2-CHCl3are expected to be proportional to the third and first powers of the pump intensity, respectively. To confirm this theoretical predic-tion, the pump intensity dependence of these signals was studied experimentally.
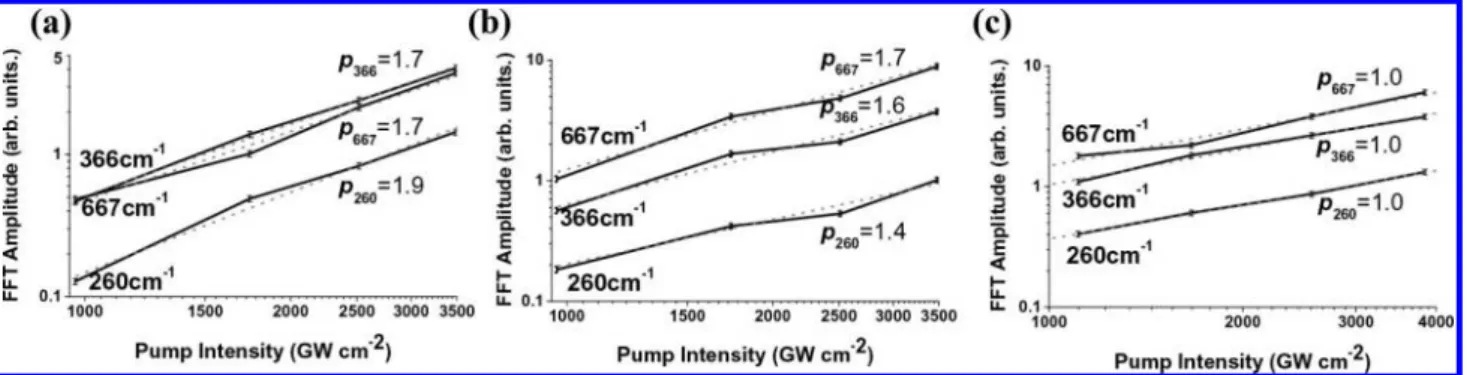
3.2.1. Pump Intensity Dependence of Vibrational Amplitude of CHCl3. The pump intensity dependence of the vibrational
amplitude of CHCl3was studied while maintaining the probe intensity at a constant value of 480 GW cm-2. Four sets of measurements were performed with pump intensities of 970, 1740, 2520, and 3480 GW cm-2. In the difference absorption spectrum, two bands appeared around 525-610 and 610-725 nm for CHCl3 as shown in Figure 3a, when the probe wavelength dependence of∆A was examined.
Figure 4a and b shows the pump intensity dependence observed for the ranges of 555-563 and 666-674 nm, respectively. In Figure 4a, the powers p(i) of the pump intensity dependence given by Ip(i)for the three most prominent modes
(260, 366, and 667 cm-1) were determined to be p(260 cm-1) ) 1.9 ( 0.1, p(366 cm-1) ) 1.7 ( 0.1, and p(667 cm-1) ) 1.7 ( 0.1. From the plots shown in Figure 4b, the powers p(i) were determined to be p(260 cm-1) ) 1.4 ( 0.1, p(366 cm-1) ) 1.6 ( 0.1, and p(667 cm-1) ) 1.7 ( 0.1. The power averaged over these six modes is 1.7 ( 0.25, indicating that the vibrational (11) Iwakura, I.; Yabushita, A.; Kobayashi, T. Chem. Phys. Lett. 2008,
457, 421–426.
Figure 3. Difference absorption spectra ∆A at 2200 GW cm-2 pump
intensity for (a) CHCl3and (b) O2-CHCl3. The difference spectra at different
time ranges were obtained by averaging for 100 fs in each time range of 100-200 fs (100), 200-300 fs (200), 300-400 fs (300), 400-500 fs (400), 500-600 fs (500), 600-700 fs (600), and 700-800 fs (700).
amplitudes are approximately proportional to the square of the pump intensity at all probe wavelengths in the case of CHCl3 even though the powers are slightly smaller than two. This result may imply that CHCl3was excited by a two-photon absorption process. However, as already mentioned, the measured absorp-tion spectrum suggests that the sample can be excited not by a two-photon absorption but by a three-photon absorption process. Possible explanations for the signal being proportional not to the third but to the square power of the pump intensity were examined. The first possible mechanism is a three-photon excitation by a fifth-order nonlinear process. The quasi-square dependence of the pump power of the signal amplitude instead of the third power may be due to the saturation effect. To clarify the mechanism, the pump intensity dependence of the vibrational amplitude in CHCl3was further studied, keeping the pump and probe intensities lower than in the previous case. The results show that the signal is proportional to the third power of the pump intensity in the short wavelength area [Figure SI 2a and c in the Supporting Information], reflecting that three-photon excitation is taking place although the signal can be saturated under high pump intensity. However, the results also show that the signal is proportional to the square power of the pump intensity in the long wavelength area [Figure SI 2b and d in the Supporting Information]. Therefore, it is difficult to prove the three-photon excitation mechanism definitively.
The second possible mechanism is a two-photon excitation caused by a slight overlap between the higher energy edge of the laser spectrum and the lower energy tail of the two-photon absorption band. The chloroform has an absorption peak at 169 nm, and its tail extends up to about 350 nm;12therefore, two-photon absorption is possible by irradiation of the laser pulse, whose spectral range is 525-725 nm.
The third possible explanation is the fifth overtone of the C-H stretching mode (3020 cm-1) of the electronic ground state.
It is difficult to distinguish whether only one of the two or three photon excitations is observed or if both of them are contributing to the signal. However, we can confidently state that in the current measurements the excited state is generated via nonlinear excitation.
3.2.2. Pump Intensity Dependence of Vibrational Amplitude of O2-CHCl3.The pump intensity dependence of the vibrational
amplitude of O2-CHCl3 was studied while maintaining the probe intensity at a constant value of 480 GW cm-2. Four sets of measurements were performed with pump intensities of 1110,
1665, 2560, and 3840 GW cm-2. The difference absorption spectrum has a peak around 610 nm as shown in Figure 3b. Figure 4c shows that the vibrational amplitude (δ∆A) of ∆A averaged within the 603-611 nm range is proportional to the pump intensity. In Figure 4c, the powers p(i) of the pump intensity dependence Ip(i)for three modes (260, 366, and 667
cm-1) were determined to be p(260 cm-1) ) 1.0 ( 0.03, p(366 cm-1) ) 1.0 ( 0.07, and p(667 cm-1) ) 1.0 ( 0.12. The linear pump intensity dependence suggests that the observed oscillation of absorbance change is predominantly due to the wave packet generated in the ground state through the stimulated Raman process.
Chloroform does not absorb the laser by a one-photon process, but the sub-5 fs pulses excited vibrational levels in the ground state by the stimulated Raman process, triggering oxidation of the CT complex. In addition, FFT amplitude of the absorbance change of O2-CHCl3 is linearly proportional to the pump intensity [Figure 4c], which shows that the observed state does not consist of electronic excited states excited by multiphoton absorption, but is the lowest excited vibrational level of V ) 1 in the electronic ground state.
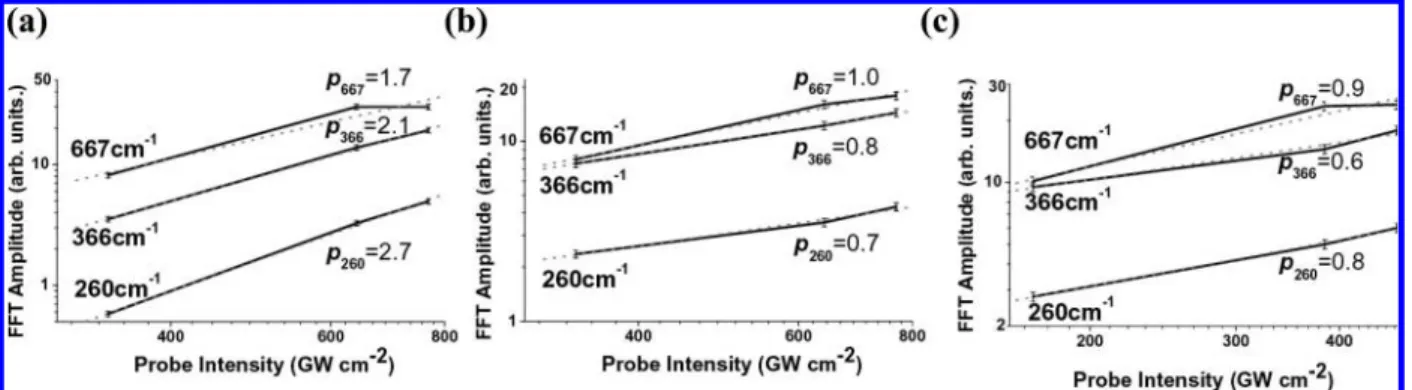
3.2.3. Probe Intensity Dependence of Vibrational Amplitude. The probe intensity dependence of the FFT amplitude of∆T of CHCl3was also studied under the same pump intensity condition of 2200 GW cm-2. Three sets of measurements were performed with probe intensities of 340, 640, and 770 GW cm-2. The pump intensity dependences observed at probe wavelength regions of 555-563 and 666-674 nm are shown in Figure 5a and b, respectively. In Figure 5a, the powers p(i) of the probe intensity dependence Ip(i)for three modes (260, 366, and 667 cm-1) were determined to be p(260) ) 2.7 ( 0.1, p(366 cm-1) ) 2.1 ( 0.1, and p(667 cm-1) ) 1.7 ( 0.1. In Figure 5b, the powers p(i) were determined to be p(260 cm-1) ) 0.7 ( 0.1, p(366 cm-1) ) 0.8 ( 0.1, and p(667 cm-1) ) 1.0 ( 0.1. The results show that the FFT amplitudes of ∆T are proportional to the probe intensity and its square at the probe wavelength regions of 666-674 and 555-563 nm, respectively. The different probe intensity dependences in these two probe wavelength regions show that two different transitions are involved. The difference between these two probe ranges can be induced by the following two possible mechanisms.
In the first possible mechanism, the broadband pump pulse excites the sample into two different excited states, which are probed by different probe wavelength ranges with different probe intensity dependences due to different nonlinearity in the probing transitions.
In the other case, the initial state excited by the pump pulse is common, but the transition mechanisms to the higher excited (12) He, G. S.; Zhemg, Q.; Yong, K.-T.; Urban, A. Appl. Phys. Lett. 2002,
90, 181108.
Figure 4. Pump intensity dependence of vibrational amplitude of CHCl3at the same probe intensity of 480 GW cm-2for (a) CHCl3(555-563 nm), (b)
CHCl3(666-674 nm), and (c) O2-CHCl3(603-611 nm).
state excited by probe pulses are different depending on probe ranges. The following analysis clarifies that the former one is the case.
The lifetime of the electronic excited-state was longer than 2 ps at a pump intensity of 2200 GW cm-2[Figures 2a and 3a]. On the other hand, the lifetime of the electronic excited state was shortened probably by the Auger process when the pump intensity was increased to about 3480 GW cm-2. There is a difference in the electronic excited-state lifetimes between the short wavelength range (about 250 fs) and the long wavelength range (about 350 fs).
According to a single-exciton configuration-interaction excited-state calculation by Ying et al.,11the transition between n (Cl 3p) and σ* (C-Cl), whose transition energy is 7.2 eV (170 nm), consists of four transitions, that is, four nonbonding 3p orbitals in Cl (2a2) HOMO, 9e, 9a1, and 8e) to a C-Clσ* antibonding orbital (10a1 ) LUMO). Two mechanisms can account for this. (1) The transition 2a2f10a1, whose energy was calculated as 7.219 eV, is dipole forbidden. Therefore, the transition 8ef10a1, of which transition energy was calculated as 7.953 eV, can be attributed to the 525-610 nm band. The electron transitions 9a1f10a1 and 9ef10a1 (the calculated energies were 7.516 and 7.592 eV, respectively) are thought to be the observed band of 610-725 nm. (2) The 2a2f10a1 electron transition is not dipole allowed but is magnetic-dipole allowed, and the Cl 3p nonbonding orbitals oriented perpen-dicularly to the C-Cl bond out of the sVplane are the main components of the 2a2orbital. Therefore, the transition overlap for the 2a2f10a1transition can be found at the Cl sites, which makes it similar to that of an atomic pfp quadrupole transition in a Cl atom. Therefore, the 610-725 nm band can be assigned to the 2a2f10a1 transition. The dominant Cl 3p orbitals are perpendicular to the C-Cl bond in the sVplane, which means that the 9e, 9a1, and 8e orbitals consist of minor C 2p components. Hence, the observed dipole components are considered to be contributions of the overlaps between the minor C 2p components in these three orbitals and the C 2s component in the 10a1orbital. On the other hand, the 8ef10a1, 9a1f10a1, and 9ef10a1transitions are assigned to the 525-610 nm band. Observed frequencies in the present work are lower than those reported in a previous paper11because the sample used in this experiment was a solution, whereas gas-phase data were presented previously.
Next, the probe intensity dependence of the FFT amplitude of∆T of O2-CHCl3was studied while maintaining the pump intensity constant at 2200 GW cm-2. Three sets of measurements were performed with probe intensities of 170, 384, and 470 GW cm-2. Figure 5c shows the observed probe intensity dependence
of the FFT amplitude of∆T at the probe wavelength of 603-611 nm. In Figure 5c, powers p(i) of the probe intensity dependence Ip(i)for three modes (260, 366, and 667 cm-1) were determined to be p(260 cm-1) ) 0.8 ( 0.1, p(366 cm-1) ) 0.6 ( 0.1, and p(667 cm-1) ) 0.9 ( 0.1. This result implies that the FFT amplitude of ∆T of O2-CHCl3 is proportional to the probe intensity, and the oscillation of the absorbance change is caused by stimulated Raman scattering.
3.2.4. Spectrogram Analysis. The above pump and probe intensity dependencies of the FFT amplitudes of the molecular vibration modes show that the results of CHCl3and O2-CHCl3 reflect the excited-state dynamics via a three-photon excitation process and the ground-state dynamics via the stimulated Raman process, respectively. From analysis of the spectrogram, we have detected that the Fourier power spectrum gradually changes from the beginning of the reaction (around 250 fs) to 1300 fs after the photoexcitation. The spectrogram was calculated from the ∆A trace probed at 666 nm using the Blackman window function, whose fwhm (full width at half-maximum) is 240 fs. The frequency resolution of the spectrogram was estimated as 30 cm-1. The data in the vicinity of 0 fs are contaminated because of the interference between the scattered pump pulse and the probe pulse, and hence the results were calculated from 250 to 1300 fs where the effect of interference is negligibly small, as shown in Figure 6.
Figure 6a depicts the spectrogram of CHCl3, which shows only a small red shift of theδC-Haround 1237 cm-1with an exponential shifting time of 357 ( 5 fs. The red shift can be explained by two possible mechanisms. (1)∆A grows with a time constant of 360 ( 40 fs. This∆A growth has nearly the same time constant as the red shift and corresponds to the relaxation from the Franck-Condon state (SFC) to the geo-metrically relaxed state (SR). Therefore, the frequency of the C-H bending mode can be red-shifted during the process of SFCfSR. (2) The frequency component around 1237 cm-1 is composed of two modes of frequencies with a small frequency
Figure 5. Probe intensity dependence of FFT amplitude of∆T of CHCl3was studied at the same pump intensity of 2200 GW cm-2for (a) CHCl3(555-563
nm), (b) CHCl3(666-674 nm), and (c) O2-CHCl3(603-611 nm).
Figure 6. Spectrograms calculated from the∆A trace probed at 666 nm
(1.86 eV) using the Blackman window function whose fwhm is 240 fs for (a) CHCl3and (b) O2-CHCl3.
difference corresponding to a low frequency mode of∼30 cm-1. The two modes are coupled through this low frequency mode. In this case, the δC-H mode frequency is expected to be modulated following the vibration period (∼1.1 ps) of the low frequency mode (∼30 cm-1). It is thought that the frequency modulation starts with a red shift followed by a blue shift. However, if the vibrational coherence disappears much faster than the vibration period of the low frequency mode, only the red shift of theδC-Hcan be observed. The blue shift that follows the red shift cannot be observed because of the fast disappear-ance of the vibrational coherence.
In sharp contrast to the small change in the spectrogram of CHCl3, the spectrogram of O2-CHCl3exhibits a peak around 1755-1785 cm-1 at 600 fs after photoexcitation [see Figure 6b]. The frequency of 1755-1785 cm-1can be assigned toυCdO and implies that chloroform and oxygen react with each other and the phosgene generated about 600 fs after the photoexcitation. The transfer of such vibrational coherence or even the aeration of coherence by chemical reaction has been discussed by Jean and Fleming.13This kind of transfer and/or creation of coherence has been found in complex molecules such as hemoglobin,14 the photosynthetic reaction center, and bacteriorhodopsin.15The condition required for the coherence transfer is that the vibration period is shorter than the vibrational dephasing and reaction time. The vibrational dephasing time seems to be longer than 100 fs, which can be estimated from the data shown in Figure 6b. Some photodissociation processes can generate products without molecular vibrations when the reaction rate is too fast to be measured by real-time spectroscopy. However, because the reaction time discussed in the present work is on the order of several femtoseconds, the vibration is not overdamped and the molecule vibrates several times.
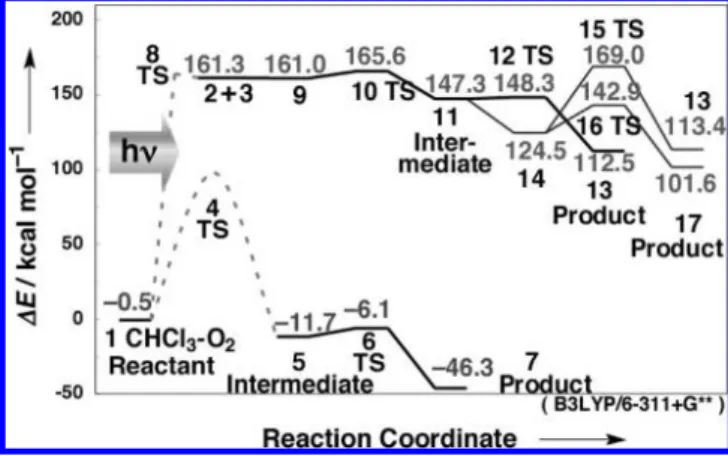
3.3. DFT Calculation. Various signals appearing from 250 to 600 fs after photoirradiation reflect the progress of the oxidation reaction of chloroform as follows. When the chloro-form and oxygen CT complex CHCl3· · · O21 is photoexcited, there are two possible reactions: (1) the photooxidation of chloroform through a C-H insertion process and (2) the reaction of CCl22 with oxygen 3. The unrestricted Becke three-parameter hybrid exchange functional combined with the Lee-Yang-Parr correlation functional (B3LYP) was used with 6-311+G** basis sets for geometry optimizations and vibrational analyses of all ground-state reactions.6Figure 7 and the Supporting Information show the calculated results. The energies (including zero point energy corrections and Gibbs energies) are given in the Supporting Information. Under light irradiation, the photon energy is converted to chemical reaction energy, resulting in radical dissociation. Molecular structures of TSs for these reactions could not be estimated because of the complexity in the calculations. Therefore, the images of activation energy barriers of these TSs are shown with broken curves.16
CHCl3· · · O2 1 f CCl3OOH 5 f CCl2O · · · HO 7 + Cl (1)
CHCl3· · · O2 1 f CCl2 2 +
O2 3 f CCl2· · · O2 9 f CCl2OO 11 f CCl2O 13 + O (2)
The oxidization mechanism of chloroform (eq 1 and Figure 7) can be explained as follows. The solubility constant of oxygen in chloroform is 9.8 mM atm-1.17 The coordinated complex CHCl3· · · O21, in which oxygen is coordinated to the hydrogen atom of chloroform, is generated (-0.5 kcal mol-1). About 16% of the dissolved oxygen is coordinated in complex 1.18Under light irradiation, the photon energy is absorbed and converted into chemical reaction energy, resulting in C-H bond dissocia-tion. C-H insertion proceeds via the C-H inserted TS 4, and a reaction intermediate CCl3OOH 5 (-11.7 kcal mol-1) is generated. Next, OH and the chlorine atom are dissociated from intermediate 5 with an activation energy of 5.6 kcal mol-1via TS 6, producing CCl2O 7 to which the hydrogen atom of the dissociated OH is coordinated. The imaginary frequency of TS 6 indicates the existence of a barrier along the O-OH rotation motion. Calculations of intrinsic reaction coordinates were further performed to confirm that the TS 6 is on the saddle points of the energy surface between the intermediate 5 and the product
7. Because the OH of CCl3O-OH 5 rotates in such a way that
OH approaches Cl within the distance of the van der Waals radii of OH and Cl, these two start to dissociate from Cl-CCl2O-OH 5.
Under the photodissociation of chloroform, the generated CCl2 2 reacts with triplet state oxygen 3 (eq 2 and Figure 7, reactants
2 + 3, 161.3 kcal mol-1), and CCl2· · · O2complex 9 is formed
(161.0 kcal mol-1, triplet state). Complex 9 changes into reaction intermediate CCl2OO 11 (147.3 kcal mol-1, triplet state) in series via TS 10 with 4.6 kcal mol-1. Next, CCl2O 13 is produced via oxygen atom-dissociated TS 12 with 1.1 kcal mol-1. This is higher than the reactant energy of chloroform and oxygen by 100 kcal mol-1or more because the photodissociation products •H and •Cl have high energies.
If the triplet-state intermediate 11 is converted to a singlet-state intermediate 14 through the intersystem crossing, this can be followed by a reaction that generates TS 15 during oxygen (13) (a) Jean, J. M.; Fleming, G. R. J. Chem. Phys. 1995, 103, 2092–2101.
(b) Rosca, F.; Kumar, A. T. N.; Ye, X.; Sjodin, T.; Demidov, A. A.; Champion, P. M. J. Phys. Chem. A 2000, 104, 4280–4290. (14) (a) Vos, M. H.; Rappaport, F.; Lambry, C.; Breton, J.; Martin,
J.-L. Nature 1993, 363, 320–325. (b) Stsnley, R. J.; Boxer, S. G. J. Phys.
Chem. 1995, 99, 859–863. (c) Wang, Q.; Schoenlein, R. W.; Peteanu,
L. A.; Mathies, R. A.; Shank, C. V. Science 1994, 266, 422–426. (15) Kobayashi, T.; Saito, T.; Ohtani, H. Nature 2001, 414, 531–534. (16) Black, K. A.; Wilsey, S.; Houk, K. N. J. Am. Chem. Soc. 2003, 125,
6715–6724.
(17) Monroe, B. M. Photochem. Photobiol. 1982, 35, 863–865. (18) Tsubomura, H.; Mulliken, R. S. J. Am. Chem. Soc. 1960, 82, 5966–
5974.
Figure 7. Oxidization pathway of chloroform (B3LYP/6-311+G**). 1,
Coordinated complex CHCl3· · · O2; 2, CCl2; 3, O2; 4, C-H inserted TS; 5,
intermediate CCl3OOH; 6, OH and Cl dissociated TS; 7, coordinated
complex CCl2O · · · OH Cl; 8, photodissociation TS; 9, coordinated complex
CCl2· · · O2; 11, CCl2OO (triplet state); 12, O dissociated TS (triplet state); 13, CCl2O; 14, CCl2OO (singlet state); 15, O dissociated TS (singlet state); 16, conformer changed TS (singlet state); 17, dichlorocarbon peroxide (singlet state).
insertion and generates the intermediate CCl3OOH 5. The intermediate 5 gives the signals ofυO-O,υC-O, andδO-Haround 910, 1025, and 1400 cm-1, respectively. Next, 5 is converted to the TS 6, which dissociates OH and Cl, and the frequencies ofυC-OandδO-Hare observed at 1090 cm-1(blue-shifted) and 1435 cm-1(blue-shifted), respectively.υO-Othen becomes an imaginary frequency mode of the TS 6 and vanishes. Finally, product CCl2dO 7 gives the new signal ofυCdOaround 1770 cm-1. As forυCdO, our calculated frequencies were rescaled to compare them with the experimental results.19The scaling factor ofυCdOis 0.96 (details are shown in the Supporting Information as Figure SI 2).
In the reaction between CCl22 and oxygen 3 (eq 2), the frequencies of theυC-ClandδC-Clof the first complex CCl2· · · O2 9 are blue-shifted from those of 2. The OdO double bond in 9 changes into a O-O single bond in 11 via TS 10, and theυO-O peak of TS 10 appears around 1435 cm-1. In the CCl2OO intermediate 11, the appearance ofυC-Oaround 1050 cm-1and the symmetry of 11 cause the disappearance ofυO-O. As a result, no peak appears higher than 1050 cm-1. In the same way, the frequency ofυC-O(1180 cm-1) is also the highest frequency in TS 12. A final product CCl2dO 13 shows the signal ofυCdO around 1810 cm-1(scaling factor ofυCdOis 0.96).
Comparing these calculation results with the results of the spectrogram previously shown in Figure 6b, we found that the signal corresponding to υOdO (1635 cm-1) of the CCl2· · · O2 complex 9, whose life is longer than that of intermediate 12, did not appear in Figure 6b, which rules out the possibility shown in eq 2. Moreover, the existence of a mode whose frequency is higher than 1180 cm-1 in the spectrogram also verifies that the pathway depicted in eq 2 does not take place. Therefore, the change observed around 600 fs after photoex-citation in the experimental result is most likely due to the C-H insertion process (eq 1).
Referring to the calculated results of eq 1, the experimentally observed spectrograms can be explained as follows. At 250 fs after photoexcitation, peaks at 923, 1050, 1220, and 1330 cm-1 were assigned toυO-Oin 5,υC-Oin 5,δC-Hin 1, andδO-Hin
5, respectively. After that, the signal of 923 cm-1 (νO-O)
vanished and the signals of 1050 (νC-O) and 1330 (δO-H) cm-1 were blue-shifted as predicted by the calculation. At about 600 fs after the photoexcitation, a new peak appeared at 1755 cm-1 (νCdO), and then it was gradually blue-shifted. This is because the frequency ofυCdOincreased as the O-H moves farther from
5. The peaks of δC-Cl (307 cm-1) and υC-Cl (578 cm-1) of
product 7 were not observed because the signal strengths were (19) (a) Schno¨ckel, H.; Eberlein, R. A.; Plitt, H. S. J. Chem. Phys. 1992,
97, 4. (b) Joo, D. L.; Clouthier, D. J.; Merer, A. J. J. Chem. Phys.
1994, 101, 31–38. (c) Wade, E. A.; Reak, K. E.; Parsons, B. F.; Clemes, T. P.; Singmaster, K. A. Chem. Phys. Lett. 2002, 365, 473–
479. Table 1. Calculated Results of Molecular Vibrational Frequencies, IR Intensities, and Raman Intensities of Eight Important Vibrational Modes of Molecular Systems molecular vibration frequency, cm -1 [IR intensity] (Ramanintensity) compound υC d O a υO d O δO -H δC -H υC -O υO -O CHCl 3 1247 [27.45] (4.87) 662 1 1634 [0.18] (24.32) 1254 [29.86] (4.59) 662 3 1636 [0.00] (17.88) 5 1397 [56.31] (7.73) 1025 [147.79] (11.50) 912 [41.64] (38.96) 546 6 1435 [59.17] (4.10) 1089 [186.79] (25.89) 528 7 1773 [550.27] (28.23) 574 2 659 9 1634 [0.10] (19.74) 708 10 1436 [294.31] (124.83) 658 11 1051 [92.90] (2.58) 12 1182 [97.54] (3.54) 13 1809 [442.72] (19.22) 554 aScaling factor of υC d O is 0.96.
quite weak and they were overlapped with the strong broad signal of chloroform.
The lifetime of ∆A signal is about 190 fs in O2-CHCl3 [Figure 3b], while CHCl3has a much longer lifetime [Figure 3a]. The reason for the short lifetime of O2-CHCl3is because O2-CHCl3disappears and generates the CCl3OOH intermediate 5 at about 200 fs after photoirradiation. Figure 3b shows that the sign of∆A becomes negative around 600 fs after photoex-citation when the reaction generates phosgene, observed as a signal peak at 1780 cm-1in Figure 6b. This implies that the observed lifetime of ∆A in O2-CHCl3 does not reflect the electronic lifetime but the reaction time.
4. Conclusion
Using sub-5 fs pulses, it was concluded that the dynamics observed in CHCl3and O2-CHCl3are due predominantly to wave packet motions in the excited state and the ground state, respectively. The time-resolved signal of CHCl3 shows the dynamics of the electronic excited state generated by a three-photon absorption process, and that of O2-CHCl3shows the dynamics of the ground state excited by the stimulated Raman process. In addition, we found that in the oxidation of chloroform, the CHCl3· · · O2charge-transfer complex is
gener-ated via the C-H insertion process being excited by the stimulated Raman process by the sub-5 fs pulse visible laser. The analysis of the spectrogram enabled direct observation of the real-time dynamics of the oxidation process from the time-dependent vibrational frequencies of the relevant modes. These results demonstrate that the observation of transition states by sub-5 fs time-resolved spectroscopy is applicable to “ground-state reactions” via the stimulated Raman process as well as to “excited-state reactions”. This opens the door to studying “dark” chemical reactions by a visible laser.
Acknowledgment. This work was partially supported by a Grant-in-Aid for JSPS Fellows to I.I., a grant from the Ministers of Education in Taiwan under the ATU Program at the National Chiao-Tung University to A.Y. and T.K., and the 21st Century COE program on “Coherent Optical Science” to T.K. We are grateful to the Information Technology Center of the University of Electro-Communications for their assistance with DFT calculations.
Supporting Information Available:Laser spectra and calcula-tion results. This material is available free of charge via the Internet at http://pubs.acs.org.
JA801829N