1
Evaluating triggering and causative factors of
1landslides in Lawnon River Basin, Taiwan
2 Meng-Chia Weng1 Min-Hao Wu1, * Shu-Kuang Ning1 Yeun-Wen Jou2 3 1Department of Civil and Environmental Engineering, National University of Kaohsiung, 4
Kaohsiung, Taiwan. 5
2
Kaohsiung Division, China Engineering Consultants, Inc., Taiwan. 6
*
23
Corresponding author, [email protected]; Tel/Fax: +886 7 5919 750 7
Abstract
8
This study evaluates triggering and causative factors of landslides by comparing 9
their occurrence in the Lawnon River Basin prior to and after rainfall and earthquake 10
events over a five-year period (2005-2009). The landslide ratio in the study area was 11
low (less than 4%) before 2007, and significantly increased in the wake of Typhoon 12
Morakot in 2009. The high accumulation of rainfall was the major triggering factor. 13
In addition, the major seismic activity of March 4, 2008 also contributed to landslide 14
occurrence. The combined influence of rainfall and the earthquake is evaluated based 15
on multi-variable regression analysis. Though no significant co-seismic landslides 16
were found after the March 4, 2008 earthquake, its influence on slope stability has 17
been observed from the apparent growth of landslide ratio in the four rainfall events 18
following the quake. Causative factors include the higher landslide ratios occurring in 19
sedimentary rock zones (especially sandstone formations with intercalations of shale), 20
and dip slopes, which are demonstrably prone to plane failures. 21
Keywords: Lawnon River, landslide, rainfall, earthquake. 22
2
1. Introduction
1
Taiwan is an island with abundant rainfall. The torrential rainfall accompanying 2
typhoons frequently causes slope failures such as landslides and debris flows. 3
Moreover, as the island is located in the Circum-Pacific Seismic Belt, an active 4
mountain-building region, there are frequent earthquakes. The dynamic effects of 5
earthquakes also degrade slope stability. Therefore, slope-land disasters are major 6
natural hazards and threaten both human lives and environmental ecology in Taiwan. 7
One of the most important watersheds on the island, the Lawnon River Basin in 8
southern Taiwan, was selected for study. Previous studies have rarely shown this 9
basin as susceptible to landslides and debris flows. In early August 2009, Typhoon 10
Morakot attacked Taiwan, causing significant loss of lives and property and an 11
economic loss of over US $5 billion (Ling et al., 2009).. It was the most damaging 12
typhoon to make rainfall in southern Taiwan in half a century. The administration 13
system identified 675 dead and twenty-four persons missing. Along with the typhoon, 14
the southwest monsoon brought torrential rains primarily concentrated in southern 15
Taiwan. Accumulated rainfall in the Lawnon River Basin was up to 2500 mm (Fig. 1). 16
As one of the largest river basins in southern Taiwan, it suffered from the severest 17
slope disasters during this event (Chen et al., 2009). About 1218 landslides occurred 18
and the cumulative landslide area exceeded 133.7 km2
According to previous studies (Keefer, 1984; Schuster et al., 1996; Crosta, 2004; 24
Lee et al., 2008a, 2008b), rainfall and earthquakes are two of the principal 25
, 6.6% of the entire basin’s area, 19
damaging infrastructure and transportation systems. However, before typhoon 20
Morakot, large landslides were rarely observed in this area. Consequently, the 21
potential and triggering factors of landslides in the Lawnon River Basin have seldom 22
been studied or emphasized. 23
3
mechanisms inducing landslides. Precipitation data such as accumulative precipitation 1
and rainfall intensity are usually applied to establish the thresholds of rainfall-induced 2
landslides (Caine, 1980; Vandine, 1985, Wieczorek, 1987; Keefer et al., 1987; Chen 3
et. Al., 2005). On the other hand, several studies have identified characteristics of 4
co-seismic landslides, particularly those caused by large-scale earthquakes (Keefer, 5
1984; Harp et al., 1991; Jibson et al., 1994; Harp and Jibson, 1996; Khazai and Sitar, 6
2004). Co-seismic landslides may not often accompany quakes, especially those of 7
limited scale. Nevertheless, some seismic activities influence slope stability for a long 8
period of time. In recent years, more and more researchers have paid attention to 9
landslides triggered by heavy rainfall in a region that has suffered a catastrophic 10
earthquake (Lin et al., 2004; Lin et al., 2006; Ku et al., 2006; Chiou et al., 2007, Chen, 11
2008). In addition to the triggering factors of landslides, it has been generally 12
accepted that slope failures are related to causative factors such as geomorphology, 13
lithology, geological structure and land cover (Radbruch et. al.,1976; Carrara,1983; 14
Varnes, 1978; Varnes, 1984; Hansen, 1984; Cruden,1993). Quantitative analysis of 15
the landslide record, with triggering and causative factors, is fundamental in digitally 16
investigating landslide hazards. Introduction of the Geographical Information System 17
(GIS) into landslide research has greatly enhanced the ability to collect and analyze 18
landslide data (Wang and Unwin, 1992; Hansen et. al.,1995; Mark and Ellen, 1995; 19
Dikau et. al., 1996; Dai and Lee, 2002). The relationship between landslides and the 20
various factors causing them not only provides an insight into our understanding of 21
landslide mechanisms, but can also form a basis for predicting future landslides and 22
assessing the landslide hazard. 23
This paper aims to clarify the effects of rainfall and earthquakes on landslide 24
occurrence. In addition, causative factors including lithology and topography prone to 25
4
slope failures are explored. The study area is the Lawnon River Basin, one of the 1
largest river basins in southern Taiwan. Sixteen satellite images of landslides between 2
2005–2009 differentiate the variations of landslide occurrence prior to and after the 3
typhoon and storm events. 4
2. Study Area
5The Lawnon River is 137 km long with a basin area of 1373 km2. The upstream 6
of the Lawnon River is typical valley topography, formed along a major thrust fault in 7
southern Taiwan, the Lawnon Fault. The downward and lateral erosion has resulted in 8
riverbank scouring, bank collapse, valley widening and riverbank retreating. The 9
topographic characteristics of this section include river terraces, alluvial fans and 10
steep riverbank slopes. 11
The study area of this research is located upstream of the Lawnon River Basin, 12
around the Bao-Lai hot spring area with ambit of 130.4 km2(Fig. 2). The Bao-Lai hot 13
spring region, the most populous area in the neighborhood, suffered a severe flood 14
and landslides during Typhoon Morakot. Geology in the study area contains four rock 15
formations, including Tangenshan Sandstone (Tn), Changchikeng Fm. (Cc), Chaujou 16
Fm. (Co), and Mt. Bilu Fm. (Ep). Among them, Tangenshan Sandstone (Tn) and 17
Changchikeng Fm.(Cc) belong to sedimentary rock areas, and Chaujou Fm.(Co) and 18
Mt. Bilu Fm.(Ep) belong to metamorphic rock areas (Fig. 3). The Lawnon Fault is the 19
boundary line between the sedimentary rock and the metamorphic rock. In addition, 20
there are many hot spring sites within the study area, mostly located in Chaujou Fm. 21
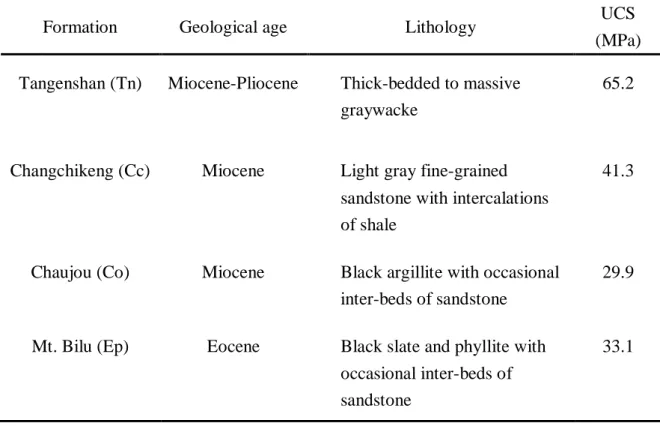
(Co). Table 1 shows the geological ages, lithologies and rock compressive strengths 22
corresponding to the geological formations. 23
3. Methodology
245
3.1 Data sources and database
13.1.1 Rainfall 2
The Water Resource Agency (WRA) and Central Weather Bureau (CWB) in 3
Taiwan supplied digital files of hourly rainfall data for twelve rain observation 4
stations (auto-gauges) in the study area. Extremely heavy rainfall data (those with 5
twenty-four-hour accumulative rainfall over 130 mm) from 2005 to 2009 were 6
collected from rainfall observation stations within 15 kilometers of the Bao-Lai area. 7
Through pre-analysis of the rainfall data, ten significant typhoon and storm events 8
with heavy rainfall from 2005 to 2009 were selected to evaluate effects on landslides 9
for this study (Table 2), and corresponding rainfall data were collected for further 10
statistical and spatial isohyet analyses. 11
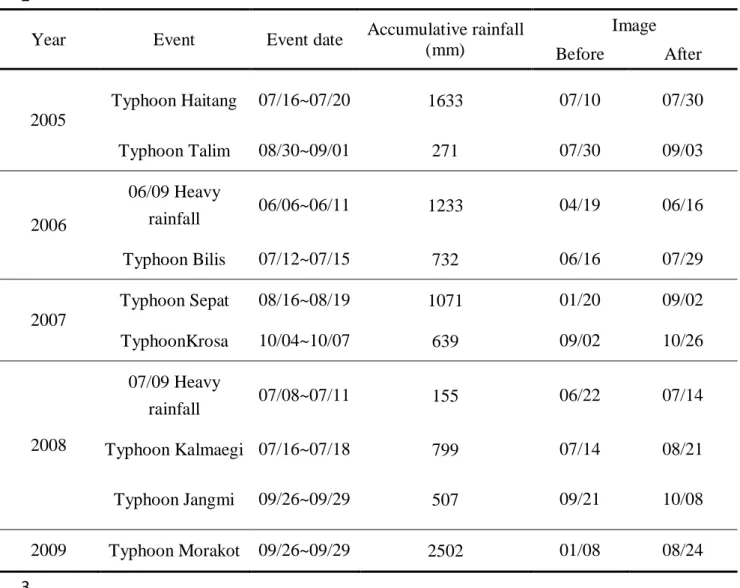
3.1.2 Satellite images 12
This study uses sixteen images from the FORMOSAT-II satellite (Table 2) from 13
before and after the ten significant typhoon and storm events of 2005 to 2009. 14
FORMOSAT-II satellite is a sun-synchronous satellite with orbital height of 891 km. 15
It has high-resolution and daily-revisit imagery and four bands with 8-m resolution 16
color mode and 2-m resolution panchromatic mode. Color imaging includes blue, 17
green, red and near-infrared bands corresponding to the wavelengths of 0.45~0.52m, 18
0.52 ~ 0.60m, 0.63 ~ 0.69m and 0.76 ~ 0.90m, respectively. Since the images 19
identified landslide areas within the study domain, they had to be cloud-free. 20
Following the selection of satellite images, preprocessing tasks including geometric 21
correction and radiometric correction were carried out before analysis of the images. 22
3.1.3 Earthquakes 23
Records of seismic activities from 2005 to 2009 were collected from Jiasian 24
seismic station (maintained by CWB), the closest seismic monitoring station to the 25
6
study area. Ten events with detected seismic intensity larger than 2 (larger than 8 gals) 1
were selected. Magnitudes and induced peak ground accelerations at the study area 2
were analyzed. 3
3.1.4 Geological and Topographical data 4
1:25,000 paper maps published by the Central Geological Survey (CGS) in 5
Taiwan provided geological and topographical data. The data were stored in vector 6
format within the Arc/info GIS software through manual digitization. A digital 7
elevation model (DEM) of 40×40 m, obtained from Aerial Survey Office, Forestry 8
Bureau, was constructed from the topographical dataset, and maps of slope-inclination 9
angle and aspect distribution were then derived from the DEM. River networks, roads, 10
and other basic geographical data were also digitized from the basic topographic 11
maps. 12
3.2 Data digitization and mapping
13The accumulative rainfall of each rain observation station was calculated by 14
summarizing hourly records within the whole storm event. The accumulative rainfall 15
data of twelve observation stations within the study area was processed to create the 16
isohyets for ten typhoon and storm events. The spatial analyst function of the GIS was 17
adopted to conduct this work. 18
Satellite images identified the landslides, and landslide areas were manually 19
digitized with Arc/info GIS software. Comparing pre-event and post-event satellite 20
images, event-based landslide maps could be obtained. Reconnaissance works and 21
in-situ observations were executed in the study area to understand geological and 22
topographical conditions unseen in the satellite images. Since this study focuses on 23
landslide areas, debris flows were not analyzed. To separate transportation and 24
deposition segments of debris flows from the study area, this study only considered 25
7
land with slope gradient larger than 25 degrees. Figure 4 illustrates the post-event 1
landslide maps of all storm events for later analysis. 2
3.3 Landslide categorization
3To better determine landslide characteristics, landslides recognized in each 4
satellite image were firstly classified into existing landslides and incremental 5
landslides. The difference in images before and after a storm event, showing 6
landslides caused by a specific event between images, indicates incremental 7
landslides. Existing landslides represent overlap in landslide images before and after 8
the storm event. In order to assess how many landslides are expanded from existing 9
ones, incremental landslides are further classified into new landslides and enlarged 10
landslides. New landslides can only be observed in the new image, and enlarged 11
landslides have expanded from existing landslides in the previous image. Figure 5 12
illustrates the distribution of existing landslides, enlarged landslides and new 13
landslides caused by rainfall during Typhoon Morakot. 14
3.4 Attribute assignment and combined database of landslides
15Assigning various attributes to individual digitized landslides is critical to 16
quantitative analysis of the relationship between landslides and their causative factors. 17
Gathering and handling various attributes of landslides is a time-consuming task, 18
usually requiring much field reconnaissance work. GIS makes managing digital 19
databases faster and more accurate. Connecting the landslide database with other 20
internal or external databases is an efficient way of assigning causative factor values 21
to individual landslides. 22
3.5 Regression analysis of landslides and the triggering factors
23In this study, the spatial overlay function of the GIS helps understand the 24
relationship between landslides and triggering factors (rainfall and earthquake) and 25
8
causative factors (lithology, geological structure and topography). Furthermore, it is 1
relevant to evaluate the associated influence of the triggering factors on the landslides. 2
Since landslides are affected by both storm events and earthquakes, a multi-variable 3
regression analysis proposed by Jeng et al. (2004) was used in this research. 4
As landslides were inter-affected by several triggering factors (e.g, x1, x2, …, xn
) ..., , , (x1 x2 xn f F = ) 5
such that a function F exists, this function could be expressed as: 6
(1) 7
The function form of F was unknown; however, for the sake of simplicity, it was 8
assumed that F has the following form: 9
1( )1 2( 2) ... n( n)
F ≅ f x f x f x (2)
10
Each function on the right-hand side of Eq. 2 represents the magnitude of the 11
influence of each factor. Empirical functions of f(xi) could possibly be determined one
12
by one using a single-variable regressive analysis of actual data. The degree of 13
influence varies from one factor to another. The goal was to find the most influential 14
function, followed by the second-most-influential function, and so on. Determination 15
of the influential functions continued until the remaining factors had no meaningful 16
influence, meaning the increase of r2 < 0.05 when more factors are considered. Then 17
the function forms of f(x1), f(x2), …, f(xn
4. Analysis results
23) needed to be further modified by the 18
iteration process until the coefficient of correlation stopped increasing. 19
Using the aforementioned regressive process, accumulative rainfall and peak 20
ground acceleration (PGA) are selected as the major triggering factors in this 21
research. 22
4.1 Influence of rainfall on landslides
249
Rainfall, especially from storms, is the dominant factor inducing landslides. 1
Combining the accumulative rainfall data and landslide ratio of each storm event(Fig. 2
6), landslide regions of the study area are observably growing in the past five years, 3
though some small recovery appeared between two consecutive events. Herein, 4
landslide ratio is expressed as a percentage, yielded from total landslide area divided 5
by overall area within a specific geological zone. Before 2008, the variation of rainfall 6
within the study area was not obvious, so that the variation of landslide areas was not 7
significant (Fig. 6). The extreme rainfall brought by Typhoon Morakot in 2009 8
remarkably increased the scale of landslides. Comparing rainfall data among events, 9
Typhoon Morakot has the highest accumulative precipitation (2502 mm on average), 10
followed by Typhoon Haitang (1882 mm on average). However, it is significant that 11
the average landslide ratio induced by Typhoon Haitang was only 1.29 %, much less 12
than those induced by Typhoons Jangmi and Kalmaegi in 2008. 13
4.2 Influence of seismic activities on landslides
14In order to investigate the influence of other landslide-triggering factors, further 15
examination of the seismic events around the study area is warranted. 16
Seismic activity records were collected from Jiasian seismic station (Fig. 7b). 17
From 2005 to 2009, ten earthquake events with detected seismic intensity larger than 18
2 (PGA ≧ 8 gals) were selected. The peak ground acceleration of each event is 19
plotted in Fig. 7(a) and the distributions of the epicenters with magnitudes for the 20
events are shown in Fig. 7(b). As observable from Fig. 7(a), a remarkable earthquake 21
with PGA near 140 gals occurred on March 4, 2008, which is much larger than the 22
other quakes. Looking back at Fig. 6, we can see that the landslide ratio increases 23
since 2008. The seismic event might play an important role in this transition. 24
Therefore, to evaluate the combined influence of the rainfall and the earthquake, a 25
10
multi-variable regression analysis is conducted in the following section to identify the 1
relationship between landslides and their triggering factors. 2
4.3 Combined effect of triggering factors on landslides
3In the procedures in section 3.5, it was assumed the landslide ratio (R), could be 4
approximately expressed as: 5 ) ( ) ( ) , (AR PGAm f1 AR f2 PGAm f R= ≅ (3) 6
where AR represents the accumulative rainfall and the unit is mm; PGAm
) (
1 AR
f
7
represents the recorded maximum PGA within one year and the unit is gal. 8
The functions and f2(PGAm) could be determined by iterations of the
9
regression analysis and are found to be: 10 0.7 + (AR) 10 5.58 -(AR) 10 3.03 AR f1( )= × -7 2 × -5 (4) 11 ) PGA exp(0.012 1.3 PGA f2( m)= ∗ m (5) 12
Substituting Eqs. 4 and 5 into Eq. 3, the landslide ratio (R) could be expressed in 13
terms of AR and PGAm
) PGA exp(0.012 0.7] + (AR) 10 5.58 -(AR) 10 3.03 1.3 PGA f R A f R= 1( ) 2( m)= ∗[ × -7 2 × -5 ∗ ∗ m as: 14 15 (6) 16
where the accumulative rainfall (AR) ranges from 150 mm to 2500 mm and the 17
PGAm
If the landslide ratio expressed by Eq. 6 represented the empirical landslide ratio, 19
it could be compared to the actual ratio (Fig. 8a). In general, the actual R and the 20
empirical R were closely related, with a correlation coefficient square (r ranges from 13 gals to 140 gals.
18
2
) of 0.955. As 21
a result, Eq. 6 provided a practical relationship for evaluating the influence of the 22
rainfall and the earthquake. Moreover, Fig. 8b illustrates the variation of landslide 23
ratio with two triggering factors, and the contour lines indicate the empirical landslide 24
11
ratio and numbers near each symbol mark the actual ratio. Before the earthquake of 1
March 4, 2008 (PGA close to 140 gals), the landslide ratios under various 2
accumulative rainfall conditions fell below 4% (Fig. 8b). After the earthquake, the 3
landslide ratios increase remarkably. Therefore, the combined effect of triggering 4
factors on landslides is significant. 5
4.4 Influence of lithology on landslides
6In addition to triggering factors, Fig. 9 shows the variations of landslide ratio 7
with respect to each geological zone, and the corresponded accumulative precipitation 8
record is also plotted. The incremental landslide ratio of each geological zone 9
generally remained below 2% before 2008 (Fig. 9a). The landslides frequently 10
occurred in formation Co. However, after the 2008 earthquake the landslide ratios of 11
sedimentary formations (Cc and Tn) surpassed those of metamorphic rock areas (Co 12
and Ep) (Fig. 9b). Figure 10 illustrates the variations of enlarged and new landslides 13
with respect to different geological formations. No matter the lithology, the failure 14
ratios of enlarged landslides is larger than those of new landslides, which means most 15
landslides came from regeneration and expansion of existing landslides. In other 16
words, as a landslide occurs, it will precipitate subsequent failure nearby. 17
4.4 Influence of dip slope on landslides
18A dip slope means a topographic surface where the dip is consistent with that of 19
the underlying strata. Dip slopes are commonly found in cuesta and vale topography. 20
Usually, dip slopes are quite prone to landslides, due to plane failure along 21
persistently weak planes. In the Lawnon River Basin, dip-slope topography is 22
commonly seen in the slope land. According to the definition of Central Geological 23
Survey (CGS) of Taiwan, dip slopes are the slopes with difference of slope direction 24
and dip direction of weak planes being less than twenty degrees. The distribution of 25
12
dip slopes in the study area was digitized on the GIS platform (Fig. 11). Figure 12 1
illustrates the variations of landslide ratios in the dip-slope zone, and it indicates that 2
dip-slope areas indeed possess higher landslide ratios, whether before or after the 3
earthquake in 2008. 4
5. Conclusion
5This study investigates the triggering and causative factors of the storm-induced 6
landslides in the Lawnon River Basin from 2005 to 2009. The analysis led to the 7
following conclusions: 8
1. From 2005 to 2009, the landslide events and scales increased year by year and 9
reached the peak value at the storm event of Typhoon Morakot 2009, which 10
aroused attention to the landslide behavior in this area. Undoubtedly, rainfall is 11
one of the primary triggering factors causing the slides. However, in comparison 12
to rainfall data among the events except Typhoon Morakot, while Typhoon 13
Haitang in 2005 had higher cumulative rainfall (1882 mm in average) than the 14
other storm events, its landslide area is smaller. The patterns of landslide scale 15
variation and rainfall record seem to be identical after 2008, which implies the 16
existence of other factor(s) triggering the transition of landslide sensitivity. 17
2. Based on the results of multi-variable regression analysis, the combined influence 18
of the rainfall and the earthquake is evaluated. Before the earthquake of March 4, 19
2008 (PGA close to 140 gals), the landslide ratios under various accumulative 20
rainfall conditions fell below 4%. After the earthquake, the landslide ratios 21
increase remarkably. Therefore, the combined effect of triggering factors on 22
landslides is significant. 23
3. The lithological effect on landslide sensitivity is not apparent before the March 4, 24
2008 earthquake. After the quake, the sedimentary formations (Cc and Tn) are 25
13
more prone to the increment of landslide ratios than the metamorphic rock areas 1
(Co and Ep). 2
4. Existing landslide areas are more sensitive to landslide enlargement or 3
development. The failure ratios of enlarged landslides is larger than those of new 4
landslides, which indicates as a landslide occurs, it will more easily precipitate 5
subsequent failure nearby. 6
5. The results of this study proves that dip slopes have more pronounced landslide 7
ratios compared to other slope land both before and after the earthquake in 2008. 8
6. Acknowledgement
9
The research is supported by the National Science Council of Taiwan, Grant No.
10
NSC 7 97-2221-E-390 -019 and China Engineering Consultants, Inc., Plan No. 99925.
11
Reference
12
Caine, N., 1980. The rainfall intensity-during control of shallow landslides and debris 13
flows. Geografiska Annaler, 62, 23–27. 14
Carrara, A. 1983. Multivariate models for landslide hazard evaluation. Math. Geol. 15
153, 403–427. 16
Chen, C.Y., 2008. Sedimentary impacts from landslides in the Tachia River Basin, 17
Taiwan. Geomorphology, doi:10.1016/j.geomorph.2008.10.009. 18
Chen, C.Y., Chen, T.C., Yu, F.C., Yu, W.H., Tseng, C.C., 2005. Rainfall duration and 19
debris-flow initiated studies for real-time monitoring. Environmental Geology, 47, 20
715–724. 21
Chen, T.C., Wu, C.C, Weng, M.C., Hsieh, K.H., Wang, C.C., 2009. Slope failure of 22
Lawnon basin induced by Typhoon Morakot. Sino-Geotechnics 122, 13–20. (in 23
Chinese) 24
14
Chiou, S.J., Cheng, C.T., Hsu, S.M., Lin, Y.H., Chi, S.Y., 2007. Evaluating landslides 1
andsediment yields induced by the Chi-Chi Earthquake and following heavy 2
rainfalls along the Ta-Chia River. Journal of GeoEngineering 2, 73–82. 3
Crosta, G.B., 2004. Introduction to the special issue on rainfall triggered landslides 4
and debris flows. Engineering Geology 73, 191–192. 5
Cruden, D.M., 1993. A simple definition of a landslide. Bull. Assoc. Eng. Geol. 43, 6
27–29. 7
Dai, F.C. and Lee, C.F., 2002. Landslide characteristics and slope instability modeling 8
using GIS, Lantau Island, Hong Kong. Geomorphology 42, 213–228. 9
Hansen, A., 1984. Engineering geomorphology: the application of an evolutionary 10
model of Hong Kong's terrain. Z. Geomorphol., Suppl. 51, pp. 39–50. 11
Hansen, A., Franks, C.A.M., Kirk, P.A., Brimicombe, A.J., Fung, T., 1995. 12
Application of GIS to hazard assessment with particular reference to landslides in 13
Hong Kong. In: A. Carrara and F. Guzetti, Editors, Geographical Information 14
Systems in Assessing Natural Hazards, Kluwer Academic Publishing, Dordrecht, 15
273–298. 16
Harp, E.L., Jibson, R.W., 1996. Landslides triggered by the 1994 Northridge, 17
California earthquake. Bulletin of the Seismological Society of America 86, 18
319–332. 19
Harp, E.L., Schmidt, K.,Wilson, R., Keefer, D.K., Jipson, R.W., 1991. Effects of 20
landslides coseismic fractures triggered by the 17 October 1989 Loma Prieta, 21
California Earthquake. Landslide News 5, 18–22. 22
Jeng, F.S., Weng, M.C., Lin, M.L., Huang, T.H., 2004. Influence of petrographic 23
parameters on geotechnical properties of Tertiary sandstones from Taiwan. 24
Engineering Geology 73, 71–91. 25
15
Jibson, R.W., Prentice, C.S., Borissoff, B.A., Rogozhin, E.A., Langer, C.L., 1994. 1
Some observations of landslides triggered by the 29 April 1991 Racha earthquake, 2
Republic of Georgia. Bulletin of the Seismological Society of America 84, 964–973. 3
Keefer, D.K., 1984. Landslides caused by earthquakes. Bulletin of Geological Society 4
of America 95, 406–421. 5
Keefer, D.K., Wilson, R.C., Mark, R.K., Brabb, E.E., Brown III, W.M., Ellen, S.D., 6
Harp, E.L., Wieczorek, G.F., Alger, C.S., Zatkin, R.S, 1987. Real-time landslide 7
warning during heavy rainfall, Science, 238, 921–925. 8
Khazai, B., Sitar, N., 2004. Evaluation of factors controlling earthquake-induced 9
landslides caused by Chi-Chi earthquake and comparison with the Northridge and 10
Loma Prieta events. Engineering Geology 71, 79–95. 11
Ku, C.Y., Cheng, C.T., Chi, S.Y., Yu, S.S., Yang, S.D., Chiao, C.H., 2006. Impact of 12
Chi-Chi earthquake on the occurrence of debris flows: example from the Da-Chia 13
river watershed. Sino-Geotechnics 100, 83–94 (in Chinese). 14
Lee, C.T., Huang, C.C., Lee, J.F., Pan, K.L., Lin, M.L., Dong, J.J., 2008a. Statistical 15
approach to earthquake-induced landslide susceptibility. Engineering Geology 16
100(1-2), 43–58. 17
Lee, C.T., Huang, C.C., Lee, J.F., Pan, K.L., Lin, M.L., Dong, J.J., 2008b. Statistical 18
approach to storm event-induced landslide susceptibility. Natural Hazard and Earth 19
System Sciences, 8, 941-960. 20
Lin, C. W., Shieh, C.L., Yuan, B.D., Shieh, Y.C., Liu, S.H., Lee, S.Y., 2004. Impact 21
of Chi-Chi earthquake on the occurrence of landslides and debris flows: example 22
from the Chenyulan River watershed, Nantou, Taiwan. Engineering Geology 71, 23
49–61. 24
Lin, C.W., Liu, S.H., Lee, S.Y., Liu, C.C., 2006. Impacts of the Chi-Chi earthquake 25
16
on subsequent rainfall-induced landslides in central Taiwan. Engineering Geology 1
86, 87–101. 2
Ling, H.I., Menq, F.Y., Wu, M.H., Huang, Y.C., Hsu, C.W., 2009. Reconnaissance 3
report of the august 8, 2009 typhoon morakot; Taiwan. GEER Association Report 4
No. GEER-018, New York. 5
Mark, R.K. and Ellen, S.D., 1995. Statistical and simulation models for mapping 6
debris-flow hazard. In: A. Carrara and F. Guzetti, Editors, Geographical Information 7
Systems in Assessing Natural Hazards, Kluwer Academic Publishing, Dordrecht, 8
93–106. 9
Radbruch-Hall, D.H., Varnes, D.J. and Savge, W.Z. 1976. Gravitational speeding of 10
steep-sided ridges (“sacking”) in Western United States. Bull. Int. Assoc. Eng. Geol. 11
14, 23–35. 12
Schuster, R.L., Nieto, A.S., O'ouke, T.D., Crespo, E., Plaza-Nieto, G., 1996. Mass 13
wasting triggered by the 5 March 1987 Ecuador earthquakes. Engineering Geology 14
42, 1–23. 15
Vandine, D.F., 1985. Debris flows and debris torrents in the Southern Canadian 16
Cordillera. Canada Geotechnique Journal 22, 44–68. 17
Varnes, D.J., 1978. Slope movement types and processes. In: Schuster, R.L., Krizek, 18
R.J. (Eds.), Landslides: An Analysis and Control, Special Report 176, 19
Transportation Research Board, National Research Council, National Academy of 20
Sciences, Washington, DC, 11–33. 21
Varnes, D.J., 1984. Landslide hazard zonation: a review of principles and practice, 22
UNESCO, Paris, 63. 23
Wang, S. and Unwin, J., 1992. Modeling landslide distribution on losses soil in China. 24
IJ Geogr. Inf. Syst. 6 (1992), 391–405. 25
17
Wieczorek, G.F. 1987. Effect of rainfall intensity and during on debris flows in 1
central Santa Cruz Mountains, California, Flows/Avalanches: Process, Recognition 2
and Mitigation. Geological Society of America, Reviews in Engineering Geology 7, 3
93–104. 4
18
Table 1 Lithological characteristics of the rock in the study area 1
2
Formation Geological age Lithology UCS
(MPa) Tangenshan (Tn) Miocene-Pliocene Thick-bedded to massive
graywacke
65.2
Changchikeng (Cc) Miocene Light gray fine-grained sandstone with intercalations of shale
41.3
Chaujou (Co) Miocene Black argillite with occasional inter-beds of sandstone
29.9
Mt. Bilu (Ep) Eocene Black slate and phyllite with occasional inter-beds of sandstone
33.1
3 4
19
Table 2 Formosat- II satellite images used in the study area 1
2
Year Event Event date Accumulative rainfall (mm) Image Before After 2005 Typhoon Haitang 07/16~07/20 1633 07/10 07/30 Typhoon Talim 08/30~09/01 271 07/30 09/03 2006 06/09 Heavy rainfall 06/06~06/11 1233 04/19 06/16 Typhoon Bilis 07/12~07/15 732 06/16 07/29 2007 Typhoon Sepat 08/16~08/19 1071 01/20 09/02 TyphoonKrosa 10/04~10/07 639 09/02 10/26 2008 07/09 Heavy rainfall 07/08~07/11 155 06/22 07/14 Typhoon Kalmaegi 07/16~07/18 799 07/14 08/21 Typhoon Jangmi 09/26~09/29 507 09/21 10/08 2009 Typhoon Morakot 09/26~09/29 2502 01/08 08/24 3 4
20
List of figure captions
1
Figure 1 Rainfall record of Lawnon river Basin during Typhoon Morakot 2009.
Figure 2 Domain of study area.
Figure 3 Geological mapping of study area.
Figure 4 Post-event landslide maps of all storm events.
Figure 5 Classification and distribution of landslides (during Typhoon Morakot, 2009).
Figure 6 Variation of landslide ratio in different rainfall events.
Figure 7 Measured peak ground accelerations (PGA) and distribution of seismic events from 2005 to 2009.
Figure 8 Comparison of actual landslide ratio with predicted landslide ratio. The contour curves in (b) represent the empirical function of landslide ratio defined by Eq. 6, and the actual value of landslide ratio is marked near each symbol.
Figure 9 Comparison of incremental landslide ratio with respect to different geological formations.
Figure 10 Variation of landslide ratios for enlarged and new landslides with respect to different geological formations.
Figure 11 Distribution of dip slopes in study area.
Figure 12 Variation of dip-slope landslide ratios in different geological formations. 2