市場狀態與基金投資人對報紙新聞報導的
反應
Market States and Fund Investors’ Reaction to News
Coverage
劉海清
1Hai-Ching Liu
傅英芬
2Ying-Fen Fu
南台科技大學財務金融學系 台南應用科技大學財務金融學系 1
Department of Finance, Southern Taiwan University and
2Department of Finance,
Tainan University of Technology
(Received July 21, 2010; Final Version February 14, 2011)
摘要:本文以台灣的基金資料為樣本,研究投資人對基金消息見報的反應。其貢獻在於同時探 討了投資人在市場狀態不同時對好消息與壞消息的不同反應。事件研究法與 piecewise 迴歸的 研究結果顯示投資人會申購好消息的基金,而當好消息基金同時為績效贏家時則特別受到投資 人的青睞。而對於贖回壞消息的基金,則在多頭時期較空頭時期有較多的贖回。在多頭時期好 消息與壞消息基金之間其贖回率的差異很大;而在空頭時期好消息與壞消息基金之間其申購率 的差異很大。也就是說在多頭時期贖回率相對於申購率對消息的好壞反應較敏感,而在空頭時 期則變成申購率對消息的好壞較敏感。在消息見報基金之事後績效方面,本文的研究結果顯示 好 (壞) 消息基金其事後績效明顯高 (低) 於全體股票型基金的平均值,隱含基金好壞消息的 報導具資訊內涵,另一方面亦顯示基金的消息見報提供了投資人所需要的資訊。 關鍵字:消息、多頭時期、空頭時期、申購率、贖回率
Abstract: This study aims to investigate Taiwan’s fund investors’ reaction to the fund news. This
research contributes to the literature by combining the issues of market states and the investors’
本文之通訊作者為傅英芬,e-mail:t90002@mail.tut.edu.tw。
reaction to fund news. By adopting the event study method and the piecewise regression method, we find that investors purchase more good news funds especially when the news funds perform well. Moreover, investors redeem more bad news funds in the bull market than in the bear market. In the bull (bear) market, the redemption (purchase) rate difference between good and bad news funds is large. That is, the redemption rate is more sensitive to the character of fund news than is the purchase rate in the bull market, while in the bear market the purchase rate is more sensitive to news than is the redemption rate. The post-news return of the good (bad) news funds is significantly higher (lower) than that of the average of the equity fund, indicating the information-contented character of fund news. That is, the news coverage in the newspaper provides fund investors with the information they need.
Keywords: News, Bull Market, Bear Market, Purchase Rate, Redemption Rate
1. Introduction
How investors’ decision making is influenced by news release is a key issue both in the stock market (Chan, 2003) and the fund market (Sirri and Tufano, 1998). This issue is important in that with the rising numbers of funds, however, the investment decision becomes difficult for fund investors1. As what Brennan (1995) claims, we can not suppose individual investors are equipped with the same techniques and knowledge as are the disciplined economists. Moreover, the individual investors’ information sources for investment are not as comprehensive as those of professional institutions. Most households are not so professionally disciplined as to timely update their information for investment (Sirri and Tufano, 1998). Their choice of funds is limited owing to their incompetent judgments and inadequate resources. Thus for individual investors the report of fund news in the media is often served as an important reference when they are making fund investment decisions.
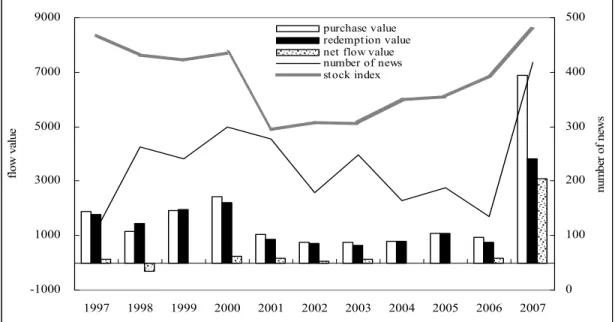
In fact, the market state also plays a role in investors’ decision making when they are informed by the news release. Figure 1 is the purchase, redemption and net flow value of the funds with news
1 Take Taiwan for example, the individual ownership decreases from 97% in 1990 to 67% in 2007. This phenomenon points out that the increasing funds from institutional investors (ex: the mutual funds) converged in Taiwan’s stock market at that time. Yet, this phenomenon also stands out the investing difficulties of individual fund investors in Taiwan when they face the large numbers of funds.
-1000 1000 3000 5000 7000 9000 1997 1998 1999 2000 2001 2002 2003 2004 2005 2006 2007 fl ow va lue 0 100 200 300 400 500 num be r of ne ws purchase value redemption value net flow value number of news stock index
Figure 1 The purchase, redemption, net flow value and the number of news of funds and the stock market index
Notes: The stock index which is the average of monthly closing index of year i is shown on the left axis. The purchase, redemption and net flow value per unit is one million US dollars, displayed on the left axis. The right axis denotes the number of fund news.
reported in the newspaper in Taiwan from 1997 to 2007. We can also observe from Figure 1 the number of fund news reported in the newspaper and the trend of the stock market index. We find that the number of fund news and the purchase (redemption) value is positively correlated. The correlation coefficient for the number of fund news and the purchase (redemption) value is 0.74 (0.71). Moreover, the stock market index is positively related to the purchase (redemption) value. The correlation coefficient of the stock market index and the purchase (redemption) value is 0.65 (0.79). It is obvious that the fund investment is influenced by the condition of the stock market. Thus it is important to consider the condition of the stock market when we investigate whether fund news affects investors’ decisions. Figure 1 also presents the importance to observe the fund investors’ behavior through the purchase and redemption value rather than through the net flow value. The correlation coefficient of the stock index and the purchase (redemption) value is 0.65 (0.79), while that of the stock index and the net flow value is only 0.43. Although most flow studies employ net flow data, it is not sufficient for us to observe investors’ reaction to fund news in the bull and bear markets if only depending on the fund net flow information.
Past literature (Barber and Odean, 2008; Du, 2002; Siganos and Chelley-Steeley, 2006) has indicated that investors’ behavior differs between bull and bear markets. Given, its importance, nevertheless, the question of whether the condition of market matters to the investors’ reaction to the news of individual funds remains under-researched. Generally, in the bull market the fund investors’ interest in funds increases as the market index increases (Warther, 1995). When investors want to collect the fund information, they may read the fund news in the newspaper. The flow of news funds2 will be more subject to change than other funds. Moreover, the fund investors’ purchase behavior may be more obvious than their redemption behavior in the bull market. On the other hand, the condition of the bear market retards the interest of investors in funds. Under such circumstances, the effect of the news report on the flows should be more imperceptible in the bear market than in the bull market. Nevertheless, the fund news may work more conspicuously on the redemption than the purchase behavior in the bear market.
This research contributes to the literature by focusing on four neglected issues: (1) the differential reactions between purchase and redemption behavior of fund investors when they are informed by the fund news coverage, (2) the differential impacts of good and bad news on fund investors’ reaction, (3) the impact of market states on the fund flows when fund news is released, (4) the future performance of news funds. The first issue addresses whether fund investors make their purchase and redemption decision separately. Since Olsen (1998) indicates that investor preferences and methods of decision-making vary with the investment being considered, we expect fund investors have different mental accounts, one is for purchase account and the other is for redemption account. This issue is important and related to behavioral finance. The second issue specifies the news character which can influence fund investors’ reaction. The third issue combines the influence of market states and the news coverage. Although the literature has indicated that the states of the market affect the fund investors’ trading sentiment (Warther, 1995) and investing behavior (Shrider, 2009) and that the media report may be an important factor affecting the fund investors’ choices (Sirri and Tufano, 1998), there has not yet a study exploring the two issues simultaneously. It is interesting to replenish the literature through the combination of these two issues by employing the data of fund purchase and redemption to investigate the fund investors’ reactions to news. The last issue is to clarify whether the information content of news is an important reference for investors when they are making investment decisions. We focus on analyzing whether the following performance of the news funds is related to the information provided by the news. This issue is worthy of reference for
fund managers and investors, which remains unclear yet.
The remainder of the paper is organized as follows. Section 2 is the literature review. Section 3 is the methodology and the summary statistics. Section 4 presents the empirical result. This study treats the fund news exposed in the newspaper as an event. Event Study is proposed to investigate the abnormal flows before and after the news is reported. Then we employ the multiple regression analysis to control for other factors which may affect the fund flows to investigate the influence of news on fund flows in the bear and bull markets. Finally, section 5 presents conclusions.
2. Literature Review
2.1 Investors’ Reaction to the Information
Many past studies have investigated the reaction of investors to the information. However, most of them focus on the stock investors. Odean (1999) indicates that investors have no evaluating instrument for picking stocks. Thus they tend to buy stocks which are often reported in the newspaper or media. Regarding fund investors, Detzler (2002) demonstrates that most investors spend little time looking into all kinds of funds. Thus, investors will make their decisions based on what are spotlighted funds in the newspaper. The above literature has consistently concluded that the media report provides important information for investors and affects their investment decisions. However, the following literature indicates that the influence of the media report on investors’ decision is limited. Chan (2003) investigating the reaction of each stock price to the firm specific news on the headlines finds that investors react slowly to the public news. The reason mainly comes from the obstacle to understanding information instead of that to obtaining information. Moreover, stock investors react more slowly to bad news than good news. Barber and Odean (2008) propose that although investors indeed have the attention-driven buying behavior, they react slowly to the news. Merton (1987) demonstrates that investors only trade some stocks which they are familiar with. Investors do not buy or sell stocks which they are not familiar with even though these stocks come with profitable news. If what Barber and Odean (2008) and Merton (1987) claim is true, news reported has not much attraction to stock investors or stock investors are indeed attracted by the news, but they react slowly. Do fund investors have the same reaction behavior to the information as the stock investors? Sirri and Tufano (1998) find that the search cost is a vital factor influencing fund investors’ reaction. The media coverage is one of the sources with which investors reduce the search cost. The investigation of Sirri and Tufano (1998) shows that there exists a significantly
positive relationship between fund flows and the current year’s media coverage while it shows little correlation between fund flows and the previous year’s media coverage. This indicates that the effect of exposed fund news in the media is greater in the current year than in the next year. Sirri and Tufano interpret that this result may be linked with the very short half-life of media attention coming from the ephemeral memories of fund investors towards the fund news. Based on the point of Sirri and Tufano (1998), this study will employ shorter data frequency (monthly) than what Sirri and Tufano employed (annually).
2.2 Investors’ Reaction in the Bull and Bear Markets
Past literature has indicated that investors’ reactions differ between the bull and bear markets. Du (2002) demonstrates that traders are short of confidence when they have a loss in the bear market. Thus they are hesitant to make investment decisions. Consistent with the conclusion of Du (2002), Siganos and Chelley-Steeley (2006) indicate that after realizing the profit in the bull market, investors tend to overreact to the information of stocks, while they tend to underreact to information in the bear market. In fact, the whole flows of funds are related to fund investors’ sentiments. And their sentiments (Warther, 1995) or behavior (Shrider, 2009) is affected by the performance of the market. Warther (1995) demonstrates that when the stock index increases to a large extent, the performance of funds gets better. The current good performance of the stock market attracts more flows into the fund market in the following period. On the other hand, the flows of funds decrease when the stock market index decreases. However, the magnitude of net fund inflows in the bull market is greater than that of the net fund outflows in the bear market. Moreover, the flow of well-performing funds in the bull market is asymmetrically exceeding that of other funds. Barber and Odean (2008) argue that in the bull period investors will buy stocks which attract their attention, while in the bear period investors have less choices because the limit of short-selling. Being subject to the constraint of short-selling, investors can sell stocks which attract them to sell only if they have held these stocks. That is, both institutional and individual investors buy stocks which draw their attention in the bull market, while institutional investors alone sell those stocks in the bear market. Individual investors become ‘net buyers’ of stocks with abundant news exposure simply because they can only buy these stocks but can not sell them. The nature of funds just corresponds to what Barber and Odean (2008) propose because fund investors can not short-sell funds. Thus it is interesting to investigate whether the market states matter to the fund investors’ behavior when the funds’ news is reported.
3. Research Design
3.1 The Data
The data of the fund flows and other control variables such as fund returns, expense and turnover rates…etc. were obtained from the Taiwan Economic Journal (TEJ). The fund news reported was obtained from the database of “Newspapers in Taiwan”. The sources of newspapers included 5 newspapers with the greatest volume in Taiwan. We obtained the news report by keying in the keyword “fund” and then sieve out the news about equity funds from the original database. The study period includes 11 years ranging from Jan. 1997 to Dec. 2007. The classification of good or bad news was based on the explicit classification rule of Patell and Wolfson (1982) and that of Yu and Li (2001). Thus the good news included the report of funds’ good performance, the prize awarded to funds or fund managers, the trust or the purchase from institutional investors, the great growth of assets, and the fund managers interviewed in the media due to their excellent performance. The bad news included funds’ bad performance, the enormous shrink of assets, the job-hopping of star managers, and the funds’ being corrected by the authorities concerned for violating the Securities and Exchange Law. The remaining part of news neither good nor bad, was classified as neutral news. Following the study of Jain and Wu (2000), we excluded the regional and foreign funds.
3.2 Summary Statistics of News Funds
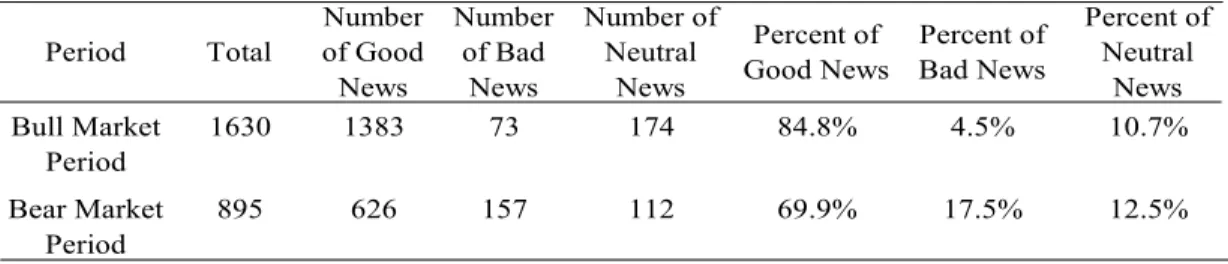
Table 1 lists the number of the fund news in the newspaper in the sample period. Table 1 shows that except 1997, the number of funds with news reported is ranging from 60 to 100. Most of the news (80%) is good news. Table 2 lists the statistics of good, bad and neutral news during the periods of the bull and bear markets. Following the definition of Fabozzi and Francis (1979), the bull (bear) market period begins when the stock index increases (decreases) from the trough (peak) for a lasting period of three months. The statistics in Tables 2 show that there are 1383 pieces of good news reported in the bull market, while there are 73 pieces of bad news. The good news comes to 626 in the bear market, while the bad news 157. Generally, the fund news appears more often in the bull market than in the bear market. Of all the news coverage, the number of good news is more than that of bad news either in the bull or bear market. The asymmetric coverage ratios of good and bad news in Tables 1 and 2 are consistent with the argument of Hong et al. (2000) who indicate that the managers of firms prefer the higher stock price of their companies. They are willing to release the good news of their companies, while they are reluctant to inform investors when their company is faced with bad news. Although the above argument is based on the general firm,
Table 1 Summary statistics of news funds Year Number of Funds with News Number of Fund News Number of Good News Number of Bad News Number of Neutrual
News Most News
a 1997 39 112 71 21 20 13 1998 76 262 164 64 34 17 1999 85 241 171 28 42 18 2000 85 300 230 27 43 23 2001 91 277 221 31 25 21 2002 71 179 130 4 45 11 2003 92 248 213 12 23 13 2004 65 165 146 1 18 11 2005 70 188 163 13 12 16 2006 70 135 125 1 9 7 2007 97 418 375 28 15 21 Average 76 230 183 21 26 Percent of Sample 80% 9% 11%
a. the frequency of the highest-media-attention funds’ being reported
Table 2 Good, Bad and Neutral News of Funds in the Bull and Bear Markets Period Total Number of Good News Number of Bad News Number of Neutral News Percent of Good News Percent of Bad News Percent of Neutral News Bull Market Period 1630 1383 73 174 84.8% 4.5% 10.7% Bear Market Period 895 626 157 112 69.9% 17.5% 12.5%
the point seems to fit the funds as well since we observe that the amount of goods news is greater than that of bad news both in the bull and bear markets3.
3 In conversations with the marketing executives of the large fund companies in Taiwan, they indicated that fund companies are one of news sources for news coverage in the newspaper. Generally, the fund companies maintain a good relationship with newspaper offices, and this is especially true of financial newspaper offices. The fund companies are proactive in providing the newspaper offices with detailed positive information of their funds. When an investment symposium is held by a newspaper office, the fund companies will try to maintain a cooperative relationship with the newspaper office by assigning staffers to attend the symposium in order to raise the opportunity of media exposure. Meanwhile, when the funds have negative information, the fund companies adopt the attitude of hiding or ignoring the information. They try their best to desalinate the impact of the negative news. Under such circumstances, we see the amount of good news of funds is greater than that of funds’ bad news.
3.3 The Fund Investors’ Reaction to News
Several past empirical studies have found that investors invest in funds based on fund past return or past risk-adjusted return (e.g., Cohen et al., 2005; Green and Hodges, 2002; Keswani and Stolin, 2008; O’Neal, 2004; Sirri and Tufano, 1998; Zheng, 1999). However, other factors such as fund size, turnover rate and expense rate (e.g., O’Neal, 2004; Sapp and Tiwari, 2004) and the previous period flow (Jain and Wu, 2000; Kempf and Ruenzi, 2006; 2008) may also influence fund flows. Thus the regression model subsumes the above factors as control variables to investigate the investors’ reaction to fund news4. The regression models are as follows:
BUYi,t =a1 + b1Di,t-1+ b2BUYi,t-1 + b3PERFLOWi,t-1 + b4PERFMIDi,t-1 + b5PERFHIGHi,t-1 + b6Di,t-1*PERFLOWi,t-1 + b7Di,t-1*PERFMIDi,t-1 + b8Di,t-1*PERFHIGHi,t-1 +
b9TURNi,t-1 +b10EXPi,t-1 +b11LNSIZEi,t-1+εit (1) SELLi,t=a2+b12Di,t-1 + b13SELLi,t-1 + b14PERFLOWi,t-1 + b15PERFMIDi,t-1 + b16PERFHIGHi,t-1
+ b17Di,t-1*PERFLOWi,t-1 + b18Di,t-1*PERFMIDi,t-1 + b19Di,t-1*PERFHIGHi,t-1 +
b20TURNi,t-1 +b21EXPi,t-1 +b22LNSIZEi,t-1+εit (2) FLOWi,t=a3+b23Di,t-1 + b24FLOWi,t-1 + b25PERFLOWi,t-1 + b26PERFMIDi,t-1 +
b27PERFHIGHi,t-1 + b28Di,t-1*PERFLOWi,t-1 + b29Di,t-1*PERFMIDi,t-1 +
b30Di,t-1*PERFHIGHi,t-1 + b31TURNi,t-1+ b32EXPi,t-1 +b33LNSIZEi,t-1+εit (3) where the dependent variables BUYi,t (the purchase rate), SELLi,t (the redemption rate) and FLOWi,t (the net flow rate) denote the ratio for purchase, redemption, and the net flow value of fund i in month t to net asset value of funds i in month t-1, respectively. BUYi,t-1, SELLi,t-1, and FLOWi,t-1 denote the previous month purchase rate, redemption rate, and net flow rate, respectively. Di,t-1 is a dummy variable. In Tables 5, 6, and 7, Di,t-1 equal to 1 represents that the funds have news (Dnews), good (Dgood) and bad news (Dbad) coverage in the previous month, and equal to 0, otherwise. In Tables 8, 9 and 10, Di,t-1 equal to 1 represents that the period is in the bull market (Dbull) when the funds have news (good news, bad news) coverage. TURNi,t-1 denotes the turnover rate of the fund in the previous month, EXPi,t-1 denotes the fund expense rate during the previous month, LNSIZEi,t-1 denotes the logarithmic value of fund net assets for the previous month. RERFi,t-1 represents the performance of funds. This study employs two definitions for fund performance. One is the raw
4 The purpose of this study is to examine the reaction of fund investors to the fund news, which focuses on observing the change of the flow rates when the good (bad) news is announced. As for the influence of the control variables on the fund flows, please refer to the literature which is mentioned in Section 3.3.
return of funds of previous month (RETi,t-1) and the other is four-factor risk-adjusted return of Carhart (1997). The equation is as follows:
Ri,t - Rf,t=α + β(Rm,t- Rf,t) + sSMBt + hHMLt + mMOMt + εt (4) where Ri,t is the monthly return of fund i in month t, Rf,t is the risk-free interest, Rm,t denotes the monthly return of the market index in month t, SMBt is the return on a portfolio of small-size (bottom 50%) stocks minus that on a portfolio of large-size (top 50%), HMLt is the return on a portfolio of high book-to-market (top 30%) stocks minus that on a portfolio of low book-to-market (bottom 30%) stocks, MOMt is the return on a portfolio of return winners (top 30%) minus that on a portfolio of return losers (bottom 30%), and α represents the abnormal return after considering the four risk factors: the market, the size, the B/M ratio and the momentum. We employ the interaction of Dnews (Dgood, Dbad) and fund performance as another proxy for the fund news release. Due to the non-linear relation between fund flow and fund performance, this study follows Sirri and Tufano (1998) to adopt the piecewise method to group performance into high-, medium- and low- performance groups. The variables RETLOW and α4LOW represent the low-performance group, RETMIT and α4MID represent the mid-performance group, and RETHIGH andα4HIGH represent the high-performance group. Taking the raw return division as an example, the ranks of the three groups are as follows:
RETLOW = min [fund percentile rank, 20%] (5) RETMID = min [(fund percentile rank - RETLOW), 60%] (6) RETHIGH = [fund percentile rank – (RETLOW +RETMID)] (7)
4. Empirical Results
4.1 The Event Study of News Coverage
As what Sirri and Tufano (1998) present, the fund flow is positively related to the current media exposure. They also find that the half-life of the media attention is very short. However, they do not investigate the different reactions of fund investors when they are informed of bad and good news in the gain and loss cases. Kahneman and Tversky (1979) propose the prospect theory, demonstrating that investors do not realize their losses. Instead, they keep holding the stocks with paper loss. Such behavior of investors reflects that they are afraid of regret, which results in the
phenomenon of the disposition effect (Shefrin and Statman, 1985). Frazzini (2006) indicates that investors’ reactions drift in the case of capital losses (gains) with bad (good) news. Laakkonen and Lanne (2010) also indicate that the effect of negative news is greater in good times than in bad times. The above literature indicates that investors’ reactions differ between the gain and loss cases when they are informed of different news. In most cases, fund investors are in the gain (loss) states in the bull (bear) market. Thus, it is important to investigate the speed of fund investors’ reactions to the difference tones of fund news in the newspaper in the bull and bear markets.
The statistics in Tables 1 and 2 demonstrate that the amount of funds’ good news is greater than that of bad news both in the bull and bear markets. Under such circumstances, the mental shock may be greater for investors when they receive bad news than when they receive good news. However, the above literature demonstrates that investors may stop realizing losses and react slowly to the bad news when they have losses in the bear market, even though the bad news may shock the fund investors. The reactions of fund investors may drift when they face the bad news in the bear market. Thus the hypothesis is as follows:
H1: The reactions of fund investors drift when they are informed of bad news in the bear market. Moreover, Frazzini (2006) has indicated that the reactions of stock investors drift when their gain positions have good news. Whether fund investors react slowly when they face good news in the bull market is an interesting issue worthy of further investigation. Our second hypothesis is therefore as follows:
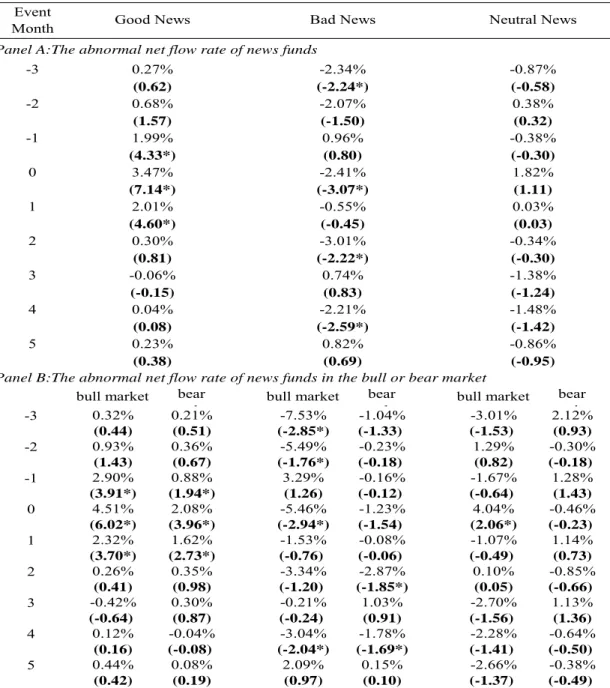
H2: The reactions of fund investors drift when they are informed of good news in the bull market. The event study is often used to observe the effect of an event. This study treats the fund news coverage as an event affecting the fund flow. The purpose is to observe whether the fund information is obtained by fund investors before the news coverage and to observe the lasting period of reaction since the release of the fund news. We investigate the abnormal net flow rate of funds with news from the previous three months to the next five months of the fund news exposed in the newspaper in Table 3, so we are able to analyze both the extent and the time length of investors’ reactions. Panel A of Table 3 presents the abnormal flow rate of fund news. The Market-adjusted model is employed to calculate the abnormal flow rate which is the net flow rate of the news funds minus that of the average of all stock funds in the same month. The numbers in parentheses are t-statistics which are calculated based on the ordinary cross-sectional method (e.g., Charest, 1978; Penman, 1982). The result in Panel A of Table 3 presents that the abnormal net flow rate of good news funds is significantly positive (1.99%) a month before the fund news is released (month -1).
In addition, the abnormal net flow rate is still significantly positive and reaches to the top (3.47%) when the fund news is released (month 0). Although the abnormal net flow rate remains positive (2.01%) a month after the fund news is released (month 1), it is lower than that of the event month. And the abnormal net flow rate of good news funds is no longer significantly positive from the next two months of the event months. Generally, the influence period of good news starts from the previous month. The significantly positive influence does not disappear until it is two months after the release of good news. Regarding bad news funds, we find that the net flow rate of these funds falls between -3% and 0% during most of the event months. The abnormal flow rate changes from positive (0.96%) in the previous month (month -1) of the bad news coverage to significantly negative (-2.41%) in the news-release month (month 0). This result indicates that fund investors do not favor bad news funds in and after the month of the news coverage. Regarding the neutral news funds, we can investigate the effect of sheer media coverage on fund flows through observing the abnormal net flow rate of neutral news funds because the neutral news does not contain slanted information. Although the statistics in Panel A of Table 3 show that the abnormal net flow rate of neutral news funds is not significant, Panel A of Table 3 reveals some information of fund investors’ reaction to the neutral news. The abnormal net flow rate of neutral news funds is negative in the previous month of the neutral news coverage (month -1), while that increases to a large extent of 1.82% in the neutral news exposure month. The abnormal net flow rate becomes insignificantly positive or negative for the rest of the event month. This result indicates some influence of sheer media coverage on fund flows in the news release month. In fact, the funds with neutral news coverage in the bull market receive significantly positive abnormal net flow rate in the news coverage month (month 0), which is shown in Panel B of Table 3.
Panel B of Table 3 further divides the sample period into bull and bear markets. The statistics in Panel B of Table 3 show that the positive reaction to good news is evident in the month before the news coverage. This result may be due to the fact that the positive information tends to be released in advance of the news coverage (Frazzini, 2006). Regarding the reaction drift of fund flows, this study finds that the abnormal net flow rate of bad news funds shows a considerable drift. The abnormal net flow rate (-1.23%) of bad news funds is not significantly negative in the news coverage month in the bear market. Most of the fund investors are in losses in the bear market. Thus, according to the disposition effect, fund investors tend to stop realizing losses when the bad news comes. However, in the bear market the abnormal net flow rate of the bad news funds is significantly negative in the months following the bad news coverage (Months 2 and 4). This result
Table 3 The abnormal net flow rate of news funds before and after the news coverage Event
Month
Panel A:The abnormal net flow rate of news funds
Panel B:The abnormal net flow rate of news funds in the bull or bear market
bull market bear
k bull market bear k bull market bear k 0.32% 0.21% -7.53% -1.04% -3.01% 2.12% (0.44) (0.51) (-2.85*) (-1.33) (-1.53) (0.93) 0.93% 0.36% -5.49% -0.23% 1.29% -0.30% (1.43) (0.67) (-1.76*) (-0.18) (0.82) (-0.18) 2.90% 0.88% 3.29% -0.16% -1.67% 1.28% (3.91*) (1.94*) (1.26) (-0.12) (-0.64) (1.43) 4.51% 2.08% -5.46% -1.23% 4.04% -0.46% (6.02*) (3.96*) (-2.94*) (-1.54) (2.06*) (-0.23) 2.32% 1.62% -1.53% -0.08% -1.07% 1.14% (3.70*) (2.73*) (-0.76) (-0.06) (-0.49) (0.73) 0.26% 0.35% -3.34% -2.87% 0.10% -0.85% (0.41) (0.98) (-1.20) (-1.85*) (0.05) (-0.66) -0.42% 0.30% -0.21% 1.03% -2.70% 1.13% (-0.64) (0.87) (-0.24) (0.91) (-1.56) (1.36) 0.12% -0.04% -3.04% -1.78% -2.28% -0.64% (0.16) (-0.08) (-2.04*) (-1.69*) (-1.41) (-0.50) 0.44% 0.08% 2.09% 0.15% -2.66% -0.38% (0.42) (0.19) (0.97) (0.10) (-1.37) (-0.49) -0.86% (-0.95) -0.34% (-0.30) -1.38% (-1.24) 1.82% (1.11) 0.03% (0.03) (-2.59*) 0.82% (0.83) -2.21% -1.48% (-1.42) (0.69) Neutral News -0.87% (-0.58) 0.38% (0.32) -0.38% (-0.30) (-2.22*) 0.74% 0.23% (0.38) (-1.50) 0.96% (0.80) -2.41% (-3.07*) -0.55% (-0.45) -3.01% -0.06% (-0.15) 0.04% (0.08) 2.01% (4.60*) 0.30% (0.81) 4 5 Good News 0.27% (0.62) 0.68% (1.57) 0 3.47% (7.14*) 1 2 3 -3 -2 -1 4 5 0 1 2 3 -3 -2 -1 1.99% (4.33*) Bad News -2.34% (-2.24*) -2.07%
Notes: This table employs the event study method to analyze the abnormal net flow rate of news coverage funds from the previous three months to the next five months of the news coverage from 1997 to 2007. The statistics in this table are the abnormal net flow rates calculated by the market-adjusted method. The numbers in parentheses are t-statistics based on the ordinary cross-sectional method (e.g., Charest, 1978 and Penman, 1982).*significantly at 0.05 level.
demonstrates that investors’ reactions to the bad news drift, which is consistent with the arguments of Chan (2003), Frazzini (2006), and Hong et al. (2000). In the bull market, the abnormal net flow rate of bad news funds is significantly negative in the news coverage month (-5.46% with t-value -2.94). The different reaction of net flow rate on the bad news funds between the bull and bear markets is consistent with Laakkonen and Lanne (2010). They indicate that the effect of negative information is greater in good times than in bad times. Regarding the good news funds, the impact of good news on the fund news flow lasts only to the next month of the good news coverage either in the bull or bear market. This result indicates that although the reaction to good news drifts to the next month of the good news release, the drift period is shorter for good news than for bad news. That is, fund investors in Taiwan react more speedily to good news than to bad news. This is consistent with the result of Chan (2003), who demonstrated that American stock investors’ reactions drift less to good news stocks.
4.2 The Flow Analysis of Funds with News Coverage in the Bull and Bear Markets
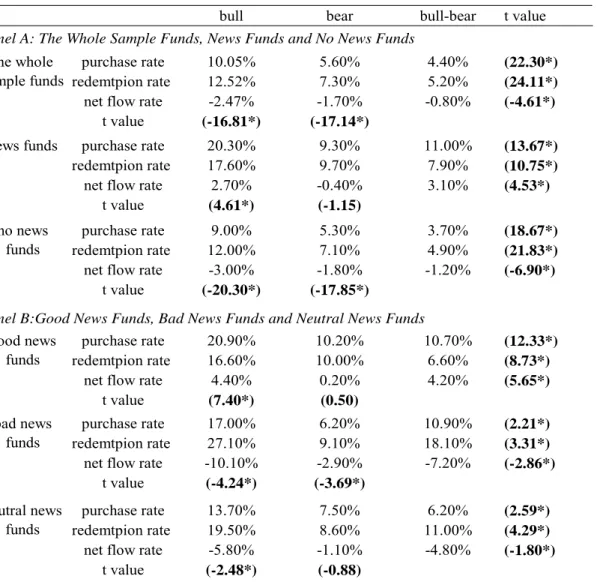
The result of Table 3 has revealed that the abnormal net flow of funds is significantly affected by the fund news coverage especially in the news release month. Panel A in Table 4 is the statistics of flows of the whole equity funds, the funds with news and without news coverage in the news release month. Table 4 shows that the net flow rate is significantly negative for the whole stock funds and the no-news funds either in bull or bear markets. This result indicates that the purchase rate is significantly smaller than the redemption rate for these two groups of funds. However, the statistics of the news funds are different from the other two groups in Panel A. During the bull market period, the net flow rate of news funds is significantly positive (2.7% with t value 4.61), while during the bear market period, the net flow rate is insignificantly different from zero (-0.4% with t value -1.15). We group news funds into good, bad and neutral news funds in Panel B of Table 4. The purpose is to investigate whether different kinds of news have different effects on fund flows. The statistics in Panel B show that the net flow rate of good news funds is significantly positive during the bull market period (4.40% with t value 7.40) but is insignificantly different from zero during the bear market period (0.20% with t value 0.50). Regarding the bad news funds, the news coverage effect makes their redemption rate very high (27.1%) in the bull market and their net flow rate is significantly negative either in bull or bear markets (-10.10% with t value -4.24 and -2.90% with t value -3.69, respectively). Regarding the neutral funds, their net flow rate is significantly negative during the bull market period (-5.80% with t value -2.48), while insignificant negative during the bear
Table 4 The Flow Analysis of News Coverage Funds in the Bull and Bear Markets
bull bear bull-bear t value
purchase rate 10.05% 5.60% 4.40% (22.30*)
redemtpion rate 12.52% 7.30% 5.20% (24.11*)
net flow rate -2.47% -1.70% -0.80% (-4.61*)
t value (-16.81*) (-17.14*)
purchase rate 20.30% 9.30% 11.00% (13.67*)
redemtpion rate 17.60% 9.70% 7.90% (10.75*)
net flow rate 2.70% -0.40% 3.10% (4.53*)
t value (4.61*) (-1.15)
purchase rate 9.00% 5.30% 3.70% (18.67*)
redemtpion rate 12.00% 7.10% 4.90% (21.83*)
net flow rate -3.00% -1.80% -1.20% (-6.90*)
t value (-20.30*) (-17.85*)
purchase rate 20.90% 10.20% 10.70% (12.33*)
redemtpion rate 16.60% 10.00% 6.60% (8.73*)
net flow rate 4.40% 0.20% 4.20% (5.65*)
t value (7.40*) (0.50)
purchase rate 17.00% 6.20% 10.90% (2.21*)
redemtpion rate 27.10% 9.10% 18.10% (3.31*)
net flow rate -10.10% -2.90% -7.20% (-2.86*)
t value (-4.24*) (-3.69*)
purchase rate 13.70% 7.50% 6.20% (2.59*)
redemtpion rate 19.50% 8.60% 11.00% (4.29*)
net flow rate -5.80% -1.10% -4.80% (-1.80*)
t value (-2.48*) (-0.88)
neutral news funds
Panel B:Good News Funds, Bad News Funds and Neutral News Funds
the whole sample funds
news funds
no news funds
Panel A: The Whole Sample Funds, News Funds and No News Funds
good news funds
bad news funds
Notes: This table presents the purchase rate, redemption rate and net flow rates of news, no-news, good news, bad news and neutral news funds during the bull and bear markets. The sample period is from 1997 to 2007.*significantly at 0.05 level.
market period. During the bull market period, we find that not only is the purchase rate of good news funds (20.9%) far higher than that of no news funds (9%) but also the purchase rate of bad and neutral news funds (17% and 13.7%) far higher than that of no news funds. The same phenomenon also occurs during the bear market period. This result implies that for one thing, the negative news results in more redemption, but the media coverage, on the other hand, attracts unexpected inflows of investors who think that the circumstances will get better. We further analyze how the conditions of
the market influences the fund flows. The statistics show that the purchase and the redemption rates of all the groups of funds in the bull market are significantly higher than those in the bear market. The net flow rate in the bull market is significantly higher than that in the bear market only in the news fund group of Panel A and in the good news fund group of Panel B. However, the conclusion reverses in other groups.
Table 4 also compares the reaction of fund investors to the good news and to the bad news in the bull and bear markets by observing the purchase and redemption rates. In the bull market, the purchase rate difference between good and bad news funds is 3.9% (20.9%-17%), while the redemption rate difference between good and bad news funds is 10.5% (27.1%-16.6%). That means in the bull market the influence of news character on the fund flows is revealed in the redemption rate difference between good and bad news funds.
In the bear market, the purchase rate difference between good and bad news funds is 4% (10.2%-6.2%), while the redemption rate difference between good and bad news funds is only 0.9% (10%-9.1%). That is, in the bear market, the impact of news character is appeared in the purchase rate difference between the two kinds of news. Apparently, the redemption rate is more sensitive to the character of fund news than is the purchase rate in the bull market, while in the bear market the purchase rate is more sensitive to news than is the redemption rate. This result indicates that in the bull market, investors especially need information as the reference for their redemption decision, while in the bear market investors demand the fund information as the reference for their purchase decision.
In general, Table 4 presents two main results. Firstly, the notable difference exists between funds with news and without news either in purchase, redemption or net flow rates. Moreover, the marked difference of flow rates also exists between good and bad news funds. Secondly, the difference of the flow rate between the bull and bear markets is very significant. These two results indicate that the fund news coverage indeed attracts investors’ attention and the effect differs substantially between the bull and bear markets.
4.3 Multiple Regressions
4.3.1 The Influence of Fund News Coverage on Fund Flows
The results of Tables 3 and 4 are based on the uni-variable analysis of fund flows. This section adopts the multiple regression analysis to analyze the influence of fund news coverage on fund flows by controlling for other variables (ex: previous month flow rate, fund performance, turnover rate,
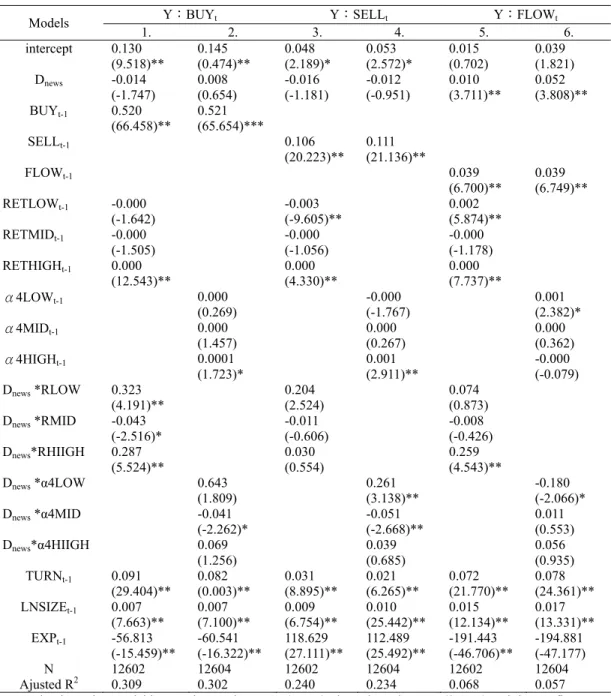
Table 5 The Influence of Fund News Coverage on Fund Flows
Models Y:BUYt Y:SELLt Y:FLOWt
1. 2. 3. 4. 5. 6. intercept 0.130 (9.518)** 0.145 (0.474)** 0.048 (2.189)* 0.053 (2.572)* 0.015 (0.702) 0.039 (1.821) Dnews -0.014 (-1.747) 0.008 (0.654) -0.016 (-1.181) -0.012 (-0.951) 0.010 (3.711)** 0.052 (3.808)** BUYt-1 0.520 (66.458)** 0.521 (65.654)*** SELLt-1 0.106 (20.223)** 0.111 (21.136)** FLOWt-1 0.039 (6.700)** 0.039 (6.749)** RETLOWt-1 -0.000 (-1.642) -0.003 (-9.605)** 0.002 (5.874)** RETMIDt-1 -0.000 (-1.505) -0.000 (-1.056) -0.000 (-1.178) RETHIGHt-1 0.000 (12.543)** 0.000 (4.330)** 0.000 (7.737)** α4LOWt-1 0.000 (0.269) -0.000 (-1.767) 0.001 (2.382)* α4MIDt-1 0.000 (1.457) 0.000 (0.267) 0.000 (0.362) α4HIGHt-1 0.0001 (1.723)* 0.001 (2.911)** -0.000 (-0.079) Dnews *RLOW 0.323 (4.191)** 0.204 (2.524) 0.074 (0.873) Dnews *RMID -0.043 (-2.516)* -0.011 (-0.606) -0.008 (-0.426) Dnews*RHIIGH 0.287 (5.524)** 0.030 (0.554) 0.259 (4.543)** Dnews *α4LOW 0.643 (1.809) 0.261 (3.138)** -0.180 (-2.066)* Dnews *α4MID -0.041 (-2.262)* -0.051 (-2.668)** 0.011 (0.553) Dnews*α4HIIGH 0.069 (1.256) 0.039 (0.685) 0.056 (0.935) TURNt-1 0.091 (29.404)** 0.082 (0.003)** 0.031 (8.895)** 0.021 (6.265)** 0.072 (21.770)** 0.078 (24.361)** LNSIZEt-1 0.007 (7.663)** 0.007 (7.100)** 0.009 (6.754)** 0.010 (25.442)** 0.015 (12.134)** 0.017 (13.331)** EXPt-1 -56.813 (-15.459)** -60.541 (-16.322)** 118.629 (27.111)** 112.489 (25.492)** -191.443 (-46.706)** -194.881 (-47.177) N 12602 12604 12602 12604 12602 12604 Ajusted R2 0.309 0.302 0.240 0.234 0.068 0.057
Notes: The dependent variables are the purchase rate (BUYt), the redemption rate (SELLt) and the net flow rate (FLOWt), respectively. Dnews equal to 1 represents the funds with news coverage in the previous month. The performance proxy used in the regression model includes the previous month return (RETi,t-1) and the four factor risk-adjusted return (α4). We rank the fund performance into low-, mid- and high performance groups (RETLOWt-1, RETMIDt-1 and RETHIGHt-1; α 4LOWt-1, α 4MIDt-1 and α 4HIGHt-1) by using the piecewise method (Sirri and Tufano, 1998). Dnews*RLOW, Dnews*RMID, Dnews*RHIIGH, Dnews*α4LOW, Dnews *α4MID and Dnews *α4HIIGH denote the interaction between news and performance rank. Please refer to Section 3.3 for description of the other independent variables. The numbers in parentheses are t-statistics. * significant at 0.05 level, **significant at 0.01 level.
fund size and expense rate) that may affect fund flows. The purpose of Table 5 is to adopt panel data regression analysis5 by employing all the equity funds to analyze whether the previous fund news coverage matters to the fund flows6. The dummy variable Dnews equal to 1 represents the funds with news coverage in the previous month. The result of Table 5 shows that the coefficients of Dnews in Models 1~4 are not significant, but they are significantly positive in Models 5 and 6, indicating the positive influence of fund news on the net flow rate. The result of the three ranked performance groups shows that the flow responses are less significant to middle performance group than to other two performance groups. The investors of high-performance group (RETHIGHt-1 and α4HIGHt-1) purchase and redeem more funds simultaneously when the performance gets better. We employ the interaction of Dnews and fund performance as another proxy for the fund news release. Generally, the interaction positively influences the purchase and redemption rates in the low- and high-performance groups. The investors in the middle performance group, however, are less passionate than investors in the other two performance groups. Other variables show that investors prefer to buying and selling funds with high turnover rate and large asset value. They buy funds with low expense rate, while they sell funds with high expense rate. Generally, consistent with the observation of American stock investors of Barber and Odean (2008), the net flow rate shows that compared with no news funds the reported funds have higher net flow rates.
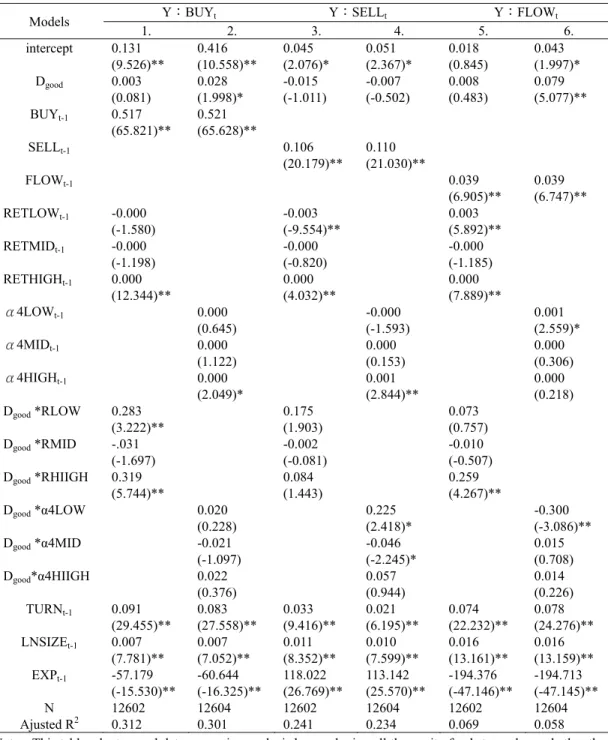
We do not separate the news into good and bad news in Table 5. Tables 6 and 7 further investigate the influence of good and bad news on fund flows. The sample is the whole equity funds in Tables 6 and 7. The dummy variables Dgood in Table 6 and Dbad in Table 7 equal to 1 represent good and bad news, respectively. The coefficient of Dgood is significantly positive in Model 2 of Table 6. The result demonstrates that fund investors buy more good-news funds when the performance is measured as risk-adjusted returns, which increases net flow rate of the reported funds (Model 6). The result of the interaction between good news and the performance shows that purchase incentives are boosted when the high return and good news come at the same time. The coefficients of (Dgood *α4HIIGH) in Models 2 and 6 are both positive. Moreover, the coefficients of (Dgood *RHIIGH) in Models 1 and 5 are significantly positive. However, the investors of the
5 For robustness, this study also adopts the regression method of Fama and MacBeth (1973). Thismethod employs the cross-sectional regression analysis every month. Then we average the coefficients of the regression model of each month. The unlisted report shows that the result of Fama and MacBeth (1973) is similar to that of panel data regression.
6 Due to the possibility of endogenous relation between current flow rate and current news coverage, this study does not list the result of current fund news coverage’s influence on the current fund flow. The unreported result implies that the reported funds indeed attract investors in the current month.
Table 6 The Influence of Good News Coverage on Fund Flows
Models Y:BUYt Y:SELLt Y:FLOWt
1. 2. 3. 4. 5. 6. intercept 0.131 (9.526)** 0.416 (10.558)** 0.045 (2.076)* 0.051 (2.367)* 0.018 (0.845) 0.043 (1.997)* Dgood 0.003 (0.081) 0.028 (1.998)* -0.015 (-1.011) -0.007 (-0.502) 0.008 (0.483) 0.079 (5.077)** BUYt-1 0.517 (65.821)** 0.521 (65.628)** SELLt-1 0.106 (20.179)** 0.110 (21.030)** FLOWt-1 0.039 (6.905)** 0.039 (6.747)** RETLOWt-1 -0.000 (-1.580) -0.003 (-9.554)** 0.003 (5.892)** RETMIDt-1 -0.000 (-1.198) -0.000 (-0.820) -0.000 (-1.185) RETHIGHt-1 0.000 (12.344)** 0.000 (4.032)** 0.000 (7.889)** α4LOWt-1 0.000 (0.645) -0.000 (-1.593) 0.001 (2.559)* α4MIDt-1 0.000 (1.122) 0.000 (0.153) 0.000 (0.306) α4HIGHt-1 0.000 (2.049)* 0.001 (2.844)** 0.000 (0.218) Dgood *RLOW 0.283 (3.222)** 0.175 (1.903) 0.073 (0.757) Dgood *RMID -.031 (-1.697) -0.002 (-0.081) -0.010 (-0.507) Dgood *RHIIGH 0.319 (5.744)** 0.084 (1.443) 0.259 (4.267)** Dgood *α4LOW 0.020 (0.228) 0.225 (2.418)* -0.300 (-3.086)** Dgood *α4MID -0.021 (-1.097) -0.046 (-2.245)* 0.015 (0.708) Dgood*α4HIIGH 0.022 (0.376) 0.057 (0.944) 0.014 (0.226) TURNt-1 0.091 (29.455)** 0.083 (27.558)** 0.033 (9.416)** 0.021 (6.195)** 0.074 (22.232)** 0.078 (24.276)** LNSIZEt-1 0.007 (7.781)** 0.007 (7.052)** 0.011 (8.352)** 0.010 (7.599)** 0.016 (13.161)** 0.016 (13.159)** EXPt-1 -57.179 (-15.530)** -60.644 (-16.325)** 118.022 (26.769)** 113.142 (25.570)** -194.376 (-47.146)** -194.713 (-47.145)** N 12602 12604 12602 12604 12602 12604 Ajusted R2 0.312 0.301 0.241 0.234 0.069 0.058
Notes: This table adopts panel data regression analysis by employing all the equity funds to analyze whether the good news coverage matters to the fund flows. The dummy variable Dgood equal to 1 represents the funds with good news coverage in the previous month. Please refer to Table 5 and Section 3.3 for a complete description of the dependent and other independent variables. The numbers in parentheses are t-statistics. *significant at 0.05 level, **significant at 0.01 level.
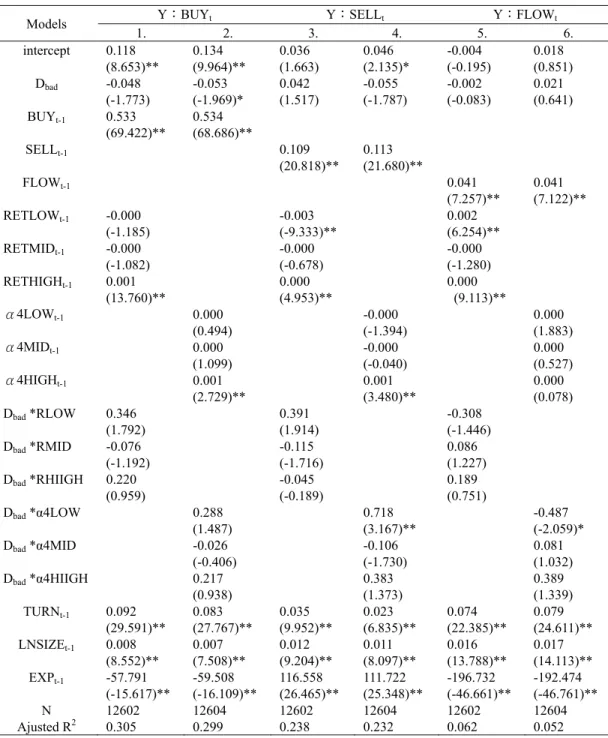
Table 7 The Influence of Bad News Coverage on Fund Flows
Models Y:BUYt Y:SELLt Y:FLOWt
1. 2. 3. 4. 5. 6. intercept 0.118 (8.653)** 0.134 (9.964)** 0.036 (1.663) 0.046 (2.135)* -0.004 (-0.195) 0.018 (0.851) Dbad -0.048 (-1.773) -0.053 (-1.969)* 0.042 (1.517) -0.055 (-1.787) -0.002 (-0.083) 0.021 (0.641) BUYt-1 0.533 (69.422)** 0.534 (68.686)** SELLt-1 0.109 (20.818)** 0.113 (21.680)** FLOWt-1 0.041 (7.257)** 0.041 (7.122)** RETLOWt-1 -0.000 (-1.185) -0.003 (-9.333)** 0.002 (6.254)** RETMIDt-1 -0.000 (-1.082) -0.000 (-0.678) -0.000 (-1.280) RETHIGHt-1 0.001 (13.760)** 0.000 (4.953)** 0.000 (9.113)** α4LOWt-1 0.000 (0.494) -0.000 (-1.394) 0.000 (1.883) α4MIDt-1 0.000 (1.099) -0.000 (-0.040) 0.000 (0.527) α4HIGHt-1 0.001 (2.729)** 0.001 (3.480)** 0.000 (0.078) Dbad *RLOW 0.346 (1.792) 0.391 (1.914) -0.308 (-1.446) Dbad *RMID -0.076 (-1.192) -0.115 (-1.716) 0.086 (1.227) Dbad *RHIIGH 0.220 (0.959) -0.045 (-0.189) 0.189 (0.751) Dbad *α4LOW 0.288 (1.487) 0.718 (3.167)** -0.487 (-2.059)* Dbad *α4MID -0.026 (-0.406) -0.106 (-1.730) 0.081 (1.032) Dbad *α4HIIGH 0.217 (0.938) 0.383 (1.373) 0.389 (1.339) TURNt-1 0.092 (29.591)** 0.083 (27.767)** 0.035 (9.952)** 0.023 (6.835)** 0.074 (22.385)** 0.079 (24.611)** LNSIZEt-1 0.008 (8.552)** 0.007 (7.508)** 0.012 (9.204)** 0.011 (8.097)** 0.016 (13.788)** 0.017 (14.113)** EXPt-1 -57.791 (-15.617)** -59.508 (-16.109)** 116.558 (26.465)** 111.722 (25.348)** -196.732 (-46.661)** -192.474 (-46.761)** N 12602 12604 12602 12604 12602 12604 Ajusted R2 0.305 0.299 0.238 0.232 0.062 0.052
Notes: This table adopts panel data regression analysis by employing all the equity funds to analyze whether the bad news coverage matters to the fund flows. The dummy variable Dbad equal to 1 represents the funds with bad news coverage in the previous month. Please refer to Table 5 and Section 3.3 for a complete description of the dependent and other independent variables. The numbers in parentheses are t-statistics. * significant at 0.05 level, **significant at 0.01 level.
low-performance funds seem to take the opportunity to sell their badly performing funds when there is good news reported. The evidence comes from the significantly positive coefficient of (Dgood *α4LOW) of Model 4 in Table 6 with the coefficient 0.225 and t value 2.418.
The purpose of Table 7 is to investigate fund investors’ reactions to bad news. The significantly negative coefficient of Dbad in Model 2 of Table 7 demonstrates that investors buy less bad news funds. When we observe the net flow reaction in Models 5 and 6 of Table 7, we find that investors do not punish bad news funds severely. We also find the interaction between bad news and performance differs among the performance groups. The statistics in Model 4 of Table 7 show that the interaction between bad news and low performance (Dbad * α4Low) significantly and positively affects the redemption rate (the coefficient is 0.718 with t value 3.167). This result indicates that for funds in the low-performance group, the better they perform, the more they are redeemed when these funds have bad news coverage in the newspaper. In other words, when the funds in the low-performance group perform worse, they are redeemed less. Lee et al. (2010) indicate that at herding redemption times, fund investors redeem actively the funds which are a little inferior to the market, while they redeem inactively the funds which perform much worse than the market. The funds in the low-performance group shown in Table 7 seem to have the same phenomenon as what Lee et al. (2010) indicate.
Generally, the result of Table 6 demonstrates that investors react to good news especially when the news funds perform well. The coefficients of Dgood*RHIGH of Models 1 and 5 in Table 6 are significantly positive. The coefficient of Dgood *RHIGH of Model 1 in Table 6 is 0. 319 with t value 5.744 and that of Dgood *RHIGH of Model 5 in Table 6 is 0.259 with t value 4.267. At the same time, investors redeem more bad news funds especially when the news funds perform better in the low-performance groups. The coefficient of Dbad * α4LOW of Model 4 in Table 7 is significantly positive (0.178 with t value 3.167). Barber and Odean (2008) present that no matter what kind of news the investors are informed investors are net buyers in the days when the stocks are highly noticed. Unlike the reaction of stock investors, this study focusing on the fund news finds that after considering other variables, when funds are noticed due to the exposure of bad news, investors are not net buyers7.
7 To consider the impact of reported times of mutual funds, this study further investigates whether more reported times can attract more fund flows. The unreported tables show that the reported times of bad news has no significant impact on the fund flows. However, the flow rates of the funds with more good news coverage in the newspaper are higher than those with less good news coverage. Therefore, if we do not consider the tones of the news, the more frequently the fund is reported in the newspaper, the higher the purchase, redemption, and net flow rates the funds have.
4.3.2 Market States and the Reaction of Fund Investors to News Coverage
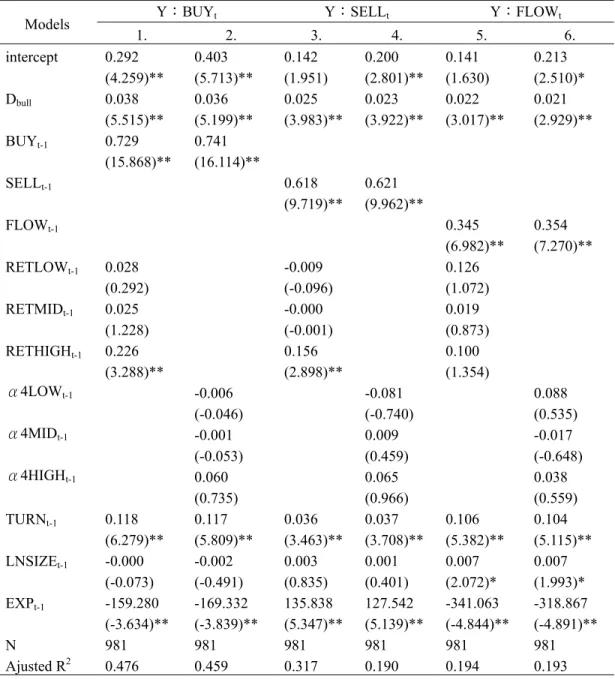
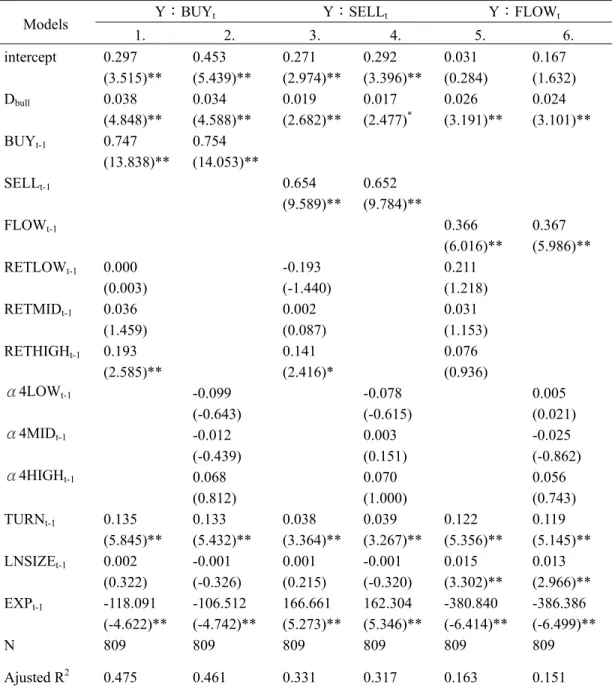
This study further investigates whether fund investors’ reaction to the news coverage differs between the bull and bear markets. The samples in Table 8 are the funds with news coverage. Dbull is equal to 1 when the fund news is covered in the bull market and is equal to zero when the news is covered in the bear market. The result of Table 8 demonstrates that investors’ decisions for purchase and redemption are different between the bull and bear markets (Models 1, 2, 3 and 4). The significant positive coefficient of Dbull indicates that investors react to the news more strongly during the bull market than during the bear market. This result implies that for reported funds, the fund news appears in the bull market can attract more purchase flows than that appears in the bear market. Moreover, the results of Models 3 and 4 also demonstrate that the reported funds are redeemed more in the bull market than in the bear market. Regarding the net flow rate of the reported funds which fund companies are concerned about, we find the net flow rate of news funds in the bull market is significantly greater than that in the bear market.
Table 9 employs the good news funds as the sample in the regression model to investigate whether the condition of the market matters when the good news is reported in the newspaper. The result is similar to that in Table 8. Dbull is equal to 1 (0) when the funds’ good news is covered in the bull (bear) market. The significant positive coefficients of Dbull indicate that investors react to good news more strongly during the bull market than during the bear market. It is obvious that fund investors pay more attention to the good news funds in the bull market than in the bear market, making the good news funds bought more and sold more in the bull market than in the bear market. Regarding the net flow rate of the good news funds, we find the net flow rate of good news funds in the bull market is significantly greater than that in the bear market.
Table 10 employs the bad news funds as the regression sample to investigate whether the condition of the market matters when the bad news is reported in the newspaper. Dbull is equal to 1 when the bad news is covered in the bull market and is equal to zero when the bad news is covered in the bear market. The coefficient of Dbull is significantly positive in Models 3 and 4 of Table 10. This result indicates that investors redeem more bad news funds in the bull market than in the bear market after they consider other factors. The reason may come from that in the bull market fund investors have more other investment opportunities than in the bear market. Thus they are more willing to redeem the bad news funds and transfer their money into other better investment opportunities in the bull market. This result is consistent with the flow analysis of Tables 3 and 4 and
Table 8 The Influence of Market States on the Fund Investors’ Reactions to the Fund News
Models Y:BUYt Y:SELLt Y:FLOWt
1. 2. 3. 4. 5. 6. intercept 0.292 (4.259)** 0.403 (5.713)** 0.142 (1.951) 0.200 (2.801)** 0.141 (1.630) 0.213 (2.510)* Dbull 0.038 (5.515)** 0.036 (5.199)** 0.025 (3.983)** 0.023 (3.922)** 0.022 (3.017)** 0.021 (2.929)** BUYt-1 0.729 (15.868)** 0.741 (16.114)** SELLt-1 0.618 (9.719)** 0.621 (9.962)** FLOWt-1 0.345 (6.982)** 0.354 (7.270)** RETLOWt-1 0.028 (0.292) -0.009 (-0.096) 0.126 (1.072) RETMIDt-1 0.025 (1.228) -0.000 (-0.001) 0.019 (0.873) RETHIGHt-1 0.226 (3.288)** 0.156 (2.898)** 0.100 (1.354) α4LOWt-1 -0.006 (-0.046) -0.081 (-0.740) 0.088 (0.535) α4MIDt-1 -0.001 (-0.053) 0.009 (0.459) -0.017 (-0.648) α4HIGHt-1 0.060 (0.735) 0.065 (0.966) 0.038 (0.559) TURNt-1 0.118 (6.279)** 0.117 (5.809)** 0.036 (3.463)** 0.037 (3.708)** 0.106 (5.382)** 0.104 (5.115)** LNSIZEt-1 -0.000 (-0.073) -0.002 (-0.491) 0.003 (0.835) 0.001 (0.401) 0.007 (2.072)* 0.007 (1.993)* EXPt-1 -159.280 (-3.634)** -169.332 (-3.839)** 135.838 (5.347)** 127.542 (5.139)** -341.063 (-4.844)** -318.867 (-4.891)** N 981 981 981 981 981 981 Ajusted R2 0.476 0.459 0.317 0.190 0.194 0.193 Notes: This table investigates whether fund investors’ reaction to news coverage differs between bull and bear
markets. The sample is the funds with news coverage. Dbull is equal to 1 (0) when the fund news is covered in the bull (bear) market. Please refer to Table 5 and Section 3.3 for a complete description of the dependent and other independent variables. The numbers in parentheses are t-statistics. *significant at 0.05 level, **significant at 0.01 level.
Table 9 The Influence of Market States on the Fund Investors’ Reactions to Good News
Models Y:BUYt Y:SELLt Y:FLOWt
1. 2. 3. 4. 5. 6. intercept 0.297 (3.515)** 0.453 (5.439)** 0.271 (2.974)** 0.292 (3.396)** 0.031 (0.284) 0.167 (1.632) Dbull 0.038 (4.848)** 0.034 (4.588)** 0.019 (2.682)** 0.017 (2.477)* 0.026 (3.191)** 0.024 (3.101)** BUYt-1 0.747 (13.838)** 0.754 (14.053)** SELLt-1 0.654 (9.589)** 0.652 (9.784)** FLOWt-1 0.366 (6.016)** 0.367 (5.986)** RETLOWt-1 0.000 (0.003) -0.193 (-1.440) 0.211 (1.218) RETMIDt-1 0.036 (1.459) 0.002 (0.087) 0.031 (1.153) RETHIGHt-1 0.193 (2.585)** 0.141 (2.416)* 0.076 (0.936) α4LOWt-1 -0.099 (-0.643) -0.078 (-0.615) 0.005 (0.021) α4MIDt-1 -0.012 (-0.439) 0.003 (0.151) -0.025 (-0.862) α4HIGHt-1 0.068 (0.812) 0.070 (1.000) 0.056 (0.743) TURNt-1 0.135 (5.845)** 0.133 (5.432)** 0.038 (3.364)** 0.039 (3.267)** 0.122 (5.356)** 0.119 (5.145)** LNSIZEt-1 0.002 (0.322) -0.001 (-0.326) 0.001 (0.215) -0.001 (-0.320) 0.015 (3.302)** 0.013 (2.966)** EXPt-1 -118.091 (-4.622)** -106.512 (-4.742)** 166.661 (5.273)** 162.304 (5.346)** -380.840 (-6.414)** -386.386 (-6.499)** N 809 809 809 809 809 809 Ajusted R2 0.475 0.461 0.331 0.317 0.163 0.151 Notes: This table investigates whether fund investors’ reaction to good news coverage differs between bull and
bear markets. The sample is the funds with good news coverage. Dbull is equal to 1 (0) when the funds’ good news is covered in the bull (bear) market. Please refer to Table 5 and Section 3.3 for a complete description of the dependent and other independent variables. The numbers in parentheses are t-statistics. *significant at 0.05 level, **significant at 0.01 level.
Table10 The Influence of Market States on the Fund Investors’ Reactions to Bad News
Models Y:BUYt Y:SELLt Y:FLOWt
1. 2. 3. 4. 5. 6. intercept 0.143 (0.766) 0.168 (1.277( -0.130 (-1.620) -0.068 (-0.601) 0.387 (2.132)* 0.365 (2.433)* Dbull 0.041 (1.825) 0.043 (1.773) 0.064 (3.040)** 0.069 (3.113)** 0.009 (0.297) 0.023 (0.551) BUYt-1 0.599 (3.419)* 0.652 (4.233)** SELLt-1 0.514 (2.793)** 0.442 (3.159)** FLOWt-1 0.153 (0.699) 0.014 (0.054) RETLOWt-1 -0.022 (-0.137) 0.086 (0.509) -0.082 (-0.469) RETMIDt-1 0.005 (0.065) 0.057 (0.652) -0.035 (-0.500) RETHIGHt-1 0.367 (1.067) 0.273 (0.807) 0.054 (0.178) α4LOWt-1 0.002 (0.008) -0.093 (-0.312) 0.205 (0.582) α4MIDt-1 -0.004 (-0.072) -0.046 (-0.716) 0.065 (0.699) α4HIGHt-1 0.208 (0.767) 0.512 (2.111)* -0.324 (-1.074) TURNt-1 0.037 (0.949) 0.032 (0.937) 0.035 (0.089) 0.031 (0.757) -0.003 (-0.127) -0.004 (-0.163) LNSIZEt-1 -0.010 (-0.976) -0.010 (-1.046) -0.003 (-0.592) -0.002 (0.495) -0.013 (-1.045) -0.016 (-1.173) EXPt-1 4.609 (0.194) 1.367 (0.012) 104.851 (2.538)** 99.002 (2.334)** -91.090 (-1.593) -80.601 (-1.271) N 60 60 60 60 60 60 Ajusted R2 0.203 0.177 0.235 0.189 0.136 0.028 Notes: This table investigates whether fund investors’ reaction to bad news coverage differs between bull and
bear markets. The sample is the funds with bad news coverage. Dbull is equal to 1 (0) when the fund news is covered in the bull (bear) market. Please refer to Table 5 and Section 3.3 for a complete description of the dependent and other independent variables. The numbers in parentheses are t-statistics. * significant at 0.05 level, **significant at 0.01 level.
Laakkonen and Lanne (2010)8.
4.4 The Future Performance of News and Good (Bad) News Funds after the News Reported
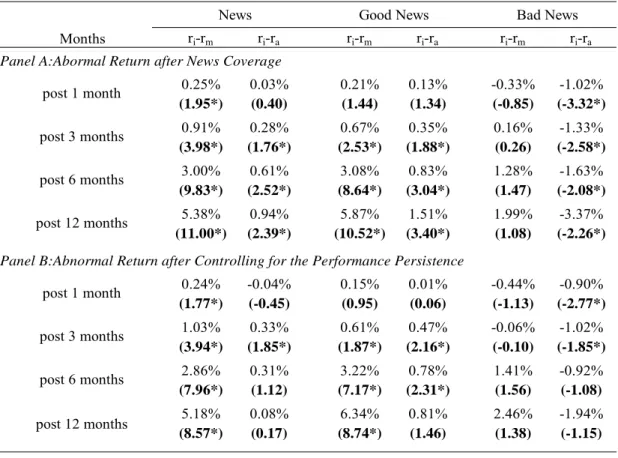
Our results of Tables 6 and 7 show that fund investors in Taiwan buy more good news funds, while they buy less bad news funds. Are their decisions precise? This study further investigates the abnormal return of reported funds a year after the news coverage. The purpose is to investigate whether investors can make wise decisions when they receive the fund news. Panel A of Table 11 is the abnormal return of reported funds within one year of the news coverage. This study analyzes the abnormal returns in two aspects; the reported fund return minus the stock market return (ri-rm); and the reported fund return minus the average return of the whole equity funds in Taiwan (ri-ra). Regarding the good news funds, Panel A shows that the abnormal returns in the post 3, 6 and 12 months are significantly positive whether employing the stock market return or the average return of the whole equity funds as the benchmark. The abnormal return of the news funds is similar to that of the good news funds. The return of bad news funds is not significantly different from the market in 1, 3, 6 and 12 months after the bad news is reported, while the return of bad news funds is significantly lower than the average of all funds after 1, 3, 6 and 12 months of the news release. This result implies that the fund news coverage contains the information content. The report of the fund news can help fund investors make proper decisions. That is, according to the following abnormal returns of the reported funds, the investment decision is right if investors buy (sell) good (bad) news funds when they receive the fund information from the newspaper. The results of Tables 6, 7 and 11 suggest that fund investors at least make the precise purchase decision based on the positive and negative information from the newspaper. The better (worse) post abnormal return of good (bad) news shown in Panel A of Table 11 may come from the performance persistence9. Thus Panel B of Table 11 further investigates whether there exists better (worse) post abnormal return of
8 In unreported results, we investigate the interaction effect of the news release and market condition. The sample of the unreported table is all the equity funds in Taiwan. The dummy variables added into the models include Dbull (bull market), Dnews (funds with news coverage), Dgood (funds with good news coverage), Dbad (funds with bad news coverage) and the interactions Dbull * Dnews, Dbull * Dgood, Dbull * Dbad, and other variables mentioned in Section 3.3. The result shows the interaction of (good) news and the bull market makes the net flow rate significantly positive. Meanwhile, the net flow rate of bad news funds in the bull market is significantly negative. This may be due to the better other investing opportunities in the bull market, which leads to the significantly lower net flow rate of bad news funds in the bull market. And this result is consistent with Tables 3,4, 9 and Laakkonen and Lanne (2010).
9 The evidence of the performance persistence of mutual funds is mixed. Please refer to Brightman and Haslanger (1980) and Elton et al. (1990) for the non-persistence of fund performance and refer to Brown and Goetzmann (1995) and Jan and Hung (2004) for the persistence of fund performance. As for the performance persistence of Taiwan’s mutual funds, please refer to Kao et al. (2005) and Lin and Hsu (2010).
good (bad) news funds after controlling for the performance persistence. Following the model of Jain and Wu (2000), which investigates the performance persistence of ads funds, we adopt the following model to investigate whether the abnormal return is still significantly positive (negative) after controlling for the persistence of the abnormal return. The model is as follows:
POSTRET = α1+β1*PRERET (8) where POSTRET is the postnews abnormal return and PRERET is the prenews abnormal return. The significantly positive (negative) coefficient of α1 means the remarkable positive (negative) performance of news funds after controlling for the performance persistence, indicating the information-contented character of fund news. The statistics in Panel B of Table 11 demonstrate a similar result to Panel A. The post abnormal returns of good news are still significantly positive after controlling for the performance persistence factor. That is, the good news reported contains information content. Moreover, the returns of bad news funds are significantly lower than the average of the whole equity funds after 1 and 3 months of the news release. That is, the bad news reported also contains information content. The results of Table 4 demonstrate that investors need the fund information as a reference when they are making redemption (purchase) decisions in the bull (bear) markets. The statistics in Table 11 further reveal that the news coverage in the newspaper provides fund investors with the information they need.
5. Conclusions
When the reaction of American stock investors to the exposure of firm news (e.g., Barber and Odean, 2008; Chan, 2003) and the reaction of American fund investors to the exposure of fund news (Sirri and Tufano, 1998) are investigated in the previous literature, little research examines the reaction of fund investors to the fund news in developing countries. However, the investing behavior of developed and developing country investors is not exactly the same (Shu et al., 2005). The turnover rate of Taiwan’s stock market is much higher than that of America, indicating the rapid trading behavior of Taiwan’s investors (Fu and Liu, 2010). Thus it better to investigate whether the fund news attracts Taiwan’s investors’ attention by employing the monthly data rather than the annual data. We contribute to the literature in that we investigate the influence of market states on the fund investors’ reaction to the fund news. Moreover, we separate the news into good and bad news to investigate whether the character of fund news also plays a role when fund investors are making investment decisions.
Table 11 The Abnormal Returns of Good, Bad and Neutral News Funds within a Year After the News Reported
Months ri-rm ri-ra ri-rm ri-ra ri-rm ri-ra
Panel A:Abormal Return after News Coverage
0.25% 0.03% 0.21% 0.13% -0.33% -1.02% (1.95*) (0.40) (1.44) (1.34) (-0.85) (-3.32*) 0.91% 0.28% 0.67% 0.35% 0.16% -1.33% (3.98*) (1.76*) (2.53*) (1.88*) (0.26) (-2.58*) 3.00% 0.61% 3.08% 0.83% 1.28% -1.63% (9.83*) (2.52*) (8.64*) (3.04*) (1.47) (-2.08*) 5.38% 0.94% 5.87% 1.51% 1.99% -3.37% (11.00*) (2.39*) (10.52*) (3.40*) (1.08) (-2.26*)
Panel B:Abnormal Return after Controlling for the Performance Persistence
0.24% -0.04% 0.15% 0.01% -0.44% -0.90% (1.77*) (-0.45) (0.95) (0.06) (-1.13) (-2.77*) 1.03% 0.33% 0.61% 0.47% -0.06% -1.02% (3.94*) (1.85*) (1.87*) (2.16*) (-0.10) (-1.85*) 2.86% 0.31% 3.22% 0.78% 1.41% -0.92% (7.96*) (1.12) (7.17*) (2.31*) (1.56) (-1.08) 5.18% 0.08% 6.34% 0.81% 2.46% -1.94% (8.57*) (0.17) (8.74*) (1.46) (1.38) (-1.15)
Good News Bad News
post 1 month post 3 months post 6 months post 12 months post 1 month post 3 months post 6 months post 12 months News
Notes: This table lists the abnormal returns of reported funds within one year after news coverage. The statistics in Panel A are the abnormal returns of news funds, good and bad news funds in 1, 3, 6 and 12 months after the fund news is reported. The statistics in Panel B are the abnormal returns of news, good, and bad news funds after considering the performance persistence, which is calculated based on regression Model (5). We use two measures of the abnormal return of reported funds; (ri-rm) denoting the return of the reported funds minus the return of the stock market index, (ri-ra) denoting the return of the reported funds minus the average return of all the equity funds. The numbers in parentheses are t-statistics. *significantly at 0.05 level
We find that the net flow rate of good and bad news funds (especially the good news funds) is markedly influenced by the news coverage in the news release month. The influence which the good news coverage has on fund flows does not last for a long time. Moreover, the market state matters to fund investors’ reaction to the news coverage. Fund investors pay more attention to the good news funds in the bull market than in the bear market. That is, investors not only buy more good news funds but also sell more good news funds in the bull market than in the bear market. Regarding bad news funds, investors redeem more bad news funds in the bull market than in the bear