國 立 交 通 大 學
生 物 資 訊 研 究 所
博 士 論 文
蛋白激酶與受質磷酸化網路之建構
Discovery of Protein Kinase-Substrate
Phosphorylation Networks
研 究 生:李宗夷
指導教授:黃憲達 博士
蛋白激酶與受質磷酸化網路之建構
Discovery of Protein Kinase-Substrate Phosphorylation
Networks
研 究 生:李宗夷
Student:Tzong-Yi Lee
指導教授:黃憲達 博士
Advisor:Hsien-Da Huang
國 立 交 通 大 學
生 物 資 訊 研 究 所
博 士 論 文
A Thesis
Submitted to Institute of Bioinformatics
College of the Biological Science & Technology
National Chiao Tung University
in partial Fulfillment of the Requirements
for the Degree of
Ph.D.
in
Bioinformatics
July 2008
Hsinchu, Taiwan, Republic of China
蛋白激酶與受質磷酸化網路之建構
學生:李宗夷 指導教授:黃憲達 博士
國立交通大學 生物資訊研究所
摘要
透 過 蛋 白 激 酶 (protein kinase) 所 催 化 的 蛋 白 質 磷 酸 化 (protein phosphorylation) 機制是一種常見可逆的蛋白質轉譯後修飾作用,扮演著訊息 傳遞路徑上的重要角色。Manning 等作者在 2002 年發現了 518 個人類蛋白激酶 基因,也提供了一個蛋白質磷酸化網路研究的切入點。隨著高通量的質譜儀蛋白 質體學技術,實驗驗證的蛋白質磷酸化資料也快速的增加,但是,只有 20%的磷 酸化位置有註解是被哪個蛋白激酶催化的。為了完整地探討蛋白激脢如何調控細 胞內的機制,需要詳盡且精確的方法來辨識受質 (substrate) 上面的磷酸化位 置是被哪個特定蛋白激酶所催化。因此我們發展了一個叫作 RegPhos 的方法,整 合了電腦模型與蛋白質相關性(包含蛋白質交互作用、功能相關性以及細胞內位 置)來辨識某個磷酸化位置被哪個蛋白激酶催化。為了評估 RegPhos 方法的效能, 四個已知的蛋白激酶 (CDK、PKC、PIKK 和 INSR) 的磷酸化資料被用來測試是否 能正確的預測作用的蛋白激酶,RegPhos 跟單純用電腦模型的方法比起來,可以 改善 5 到 10%的準確度。這些完整且準確被分析預測蛋白激酶與受質的交互作用 可以被用來建構細胞內從細胞膜上的受體蛋白激酶 (receptor kinase) 到細胞 核內的轉錄因子 (transcription factor) 的磷酸化網路,並且用實驗表現證據 (如:基因微陣列資料) 來檢視蛋白激酶跟受質是否有統計上顯著的相似表現行 為。
Discovery of Protein Kinase-Substrate
Phosphorylation Networks
Student: Tzong-Yi Lee Advisor : Dr. Hsien-Da Huang
Institute of Bioinformatics, National Chiao Tung University
Abstract
Protein phosphorylation, catalyzed by protein kinases, is a ubiquitous reversible post-translational modification (PTM) and plays a crucial role in signaling pathway. Manning et al. have identified 518 human kinase genes, the so-called “kinome", that provides a starting point for comprehensive analysis of protein phosphorylation networks. With the high-throughput mass spectrometry (MS) proteomics, the number of in vivo phosphorylation sites is increasing rapidly. However, only 20% of the experimentally verified phosphorylation sites have the annotation of catalytic kinases. To understand how protein kinases regulate their substrates in intracellular processes, it is necessary to link these sites to specific kinases. Therefore, we propose an approach that incorporates machine learning method with protein associations (protein-protein interactions, functional associations, and subcellular localization) for identifying the catalytic kinase for each experimental phosphorylated site. Four well-annotated kinase families, such as CDK, PKC, PIKK, and INSR, are used to test the ability to correctly predict which kinases are responsible for catalyzing them. The presented approach can improve 5 - 10% predictive accuracy more than purely using machine learning method. The identified kinase-substrate interactions are used to construct the intracellular phosphorylation network starting from receptor kinases to transcription factors. Moreover, the experimental expression evidence such as time-series microarray gene expression profiles is adopted to validate the syn-expression of kinase and substrate with statistical significance.
Table of Contents
Abstract ... iv
Table of Contents ... v
List of Figures ... viii
List of Tables ... xi
Chapter 1 Introduction ... 1
1.1 Biological Background ... 1
1.1.1 Protein Post-Translational Modifications (PTMs) ... 1
1.1.2 Protein Phosphorylation ... 3
1.1.3 Signal Transduction Pathway ... 6
1.1.4 Mass Spectrometry-based Identification of Protein Phosphorylation .. 8
1.1.5 Phosphoproteomics ... 10
1.2 Motivation ... 12
1.3 Research Goals... 13
1.3.1 Management of Heterogeneous Phosphorylation Databases and Related Information ... 13
1.3.2 Identification of Kinase-Specific Phosphorylation Sites ... 14
1.3.3 Discovery of Protein Kinase-Substrate Phosphorylation Networks ... 14
1.4 Organization of This Dissertation ... 15
Chapter 2 Information Repository of Protein Post-Translational Modifications 16 2.1 Introduction ... 16
2.1.1 Protein Solvent Accessibility ... 17
2.1.2 Protein Intrinsic Disorder ... 17
2.1.3 Subcellular Localization ... 22
2.2 Related Works ... 23
2.3 Motivation and the Specific Aim ... 32
2.4 Materials and Methods ... 33
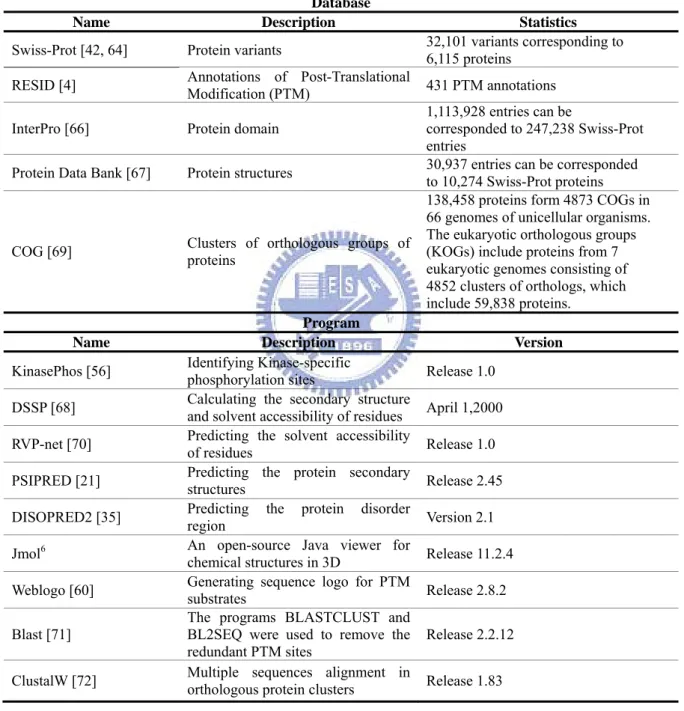
2.4.1 Integration of External PTM Databases ... 34
2.4.2 Computational Annotation of PTM Sites ... 35
2.4.3 Structural and Functional Annotations ... 41
2.4.4 Benchmark of PTM Prediction ... 43
2.5 Results ... 46
2.5.1 Performance of PTM Computational Models ... 46
2.5.2 Data Statistics... 49
2.5.3 Data Access ... 51
2.6 Summary ... 56
Chapter 3 Identification of Kinase-Specific Phosphorylation Sites ... 58
3.1 Introduction ... 58
3.2 Related Works ... 63
3.2.1 Machine Learning Methods ... 63
3.2.2 Phosphorylation Site Prediction ... 70
3.3 Motivation and The Specific Aim ... 76
3.4 Materials and Methods ... 77
3.4.1 Data Preprocessing... 77
3.4.2 Feature Extraction and Coding ... 82
3.4.3 Model Learning and Evaluation ... 83
3.4.4 Independent Test ... 84
3.5 Results ... 85
3.5.1 Structural Investigation of Phosphorylation Sites... 85
3.5.2 Predictive Performance ... 91
3.5.3 Predictive Performance of Independent Test ... 94
3.5.4 Web-based Prediction Tool ... 95
3.6 Discussions ... 96
3.6.1 Kinase-specific Groups with Similar Consensus Motif ... 96
3.6.2 Comparison with Other Phosphorylation Prediction Tools ... 98
3.7 Summary ... 100
Chapter 4 Discovery of Protein Kinase-Substrate Phosphorylation Networks . 101 4.1 Introduction ... 101
4.2 Related Works ... 104
4.2.1 Discovery of Human Phosphorylation Networks ... 105
4.2.2 Human Kinase Interactome Resource ... 106
4.2.3 Modeling of Signal Transduction Networks ... 107
4.3 Motivation and Specific Aim ... 109
4.4 Materials ... 110
4.4.1 Protein Kinase and Phosphorylation Site Resource ... 110
4.4.2 Protein-Protein Interaction Databases ... 114
4.4.3 Functional Association Databases ... 115
4.4.4 Protein Subcellular Localization Databases ... 116
4.4.5 Gene Expression Database ... 119
4.5 Method ... 120
4.5.1 Identification of Kinase-Substrate Interactions ... 121
4.5.2 Construction of Phosphorylation Network ... 129
4.6 Results ... 135
4.6.1 Protein Kinases, Phosphoproteins, and Interacting Proteins ... 135
4.6.2 Subcellular Localization of Protein Kinases and Substrates ... 138
4.6.3 Expression Analysis of Kinase and Substrate ... 142
4.6.4 Predictive Performance ... 146
4.6.5 Statistics of Discovered Kinase-specific Substrate Interactions ... 147
4.7 Case Study ... 148
4.8 Web-based System of RegPhos ... 152
4.9 Summary ... 155
Chapter 5 Discussions ... 156
5.1 Characteristics ... 156
5.2 Limitations ... 158
5.2.1 How Reliable are Protein-Protein Interaction? ... 158
5.2.2 Time Complexity and Path Length of Signaling Pathway Construction ... 158
5.2.3 Visualization of Complex Phosphorylation Network ... 159
5.3 Perspectives... 161
5.3.1 Phosphorylation Sites on Various Protein Isoforms ... 161
5.3.2 Downstream Genes of Transcription Factors ... 162
5.3.1 Dephosphorylation and Phosphatase ... 162
Chapter 6 Conclusion ... 164
References ... 166
List of Figures
Figure 1.1 Schematic representation of several common post-translational
modifications. ... 2
Figure 1.2 Schematic representation of protein phosphorylation. ... 4
Figure 1.3 Chemical formula of serine, threonine, and tyrosine (Lehninger et al., 2005). ... 4
Figure 1.4 Activation of the insulin-receptor Tyr kinase by autophosphorylation (Lehninger et al., 2005). ... 5
Figure 1.5 Overview of signal transduction pathways. ... 7
Figure 1.6 Insulin-induced signal transduction (Lehninger et al., 2005). ... 8
Figure 1.7 Generic mass spectrometry (MS)-based proteomics experiment (Aebersold et al., 2003). ... 9
Figure 1.8 Example of phosphopeptide MS/MS spectra. ... 10
Figure 1.9 Combined large-scale approaches to unravel phosphorylation driven signaling networks (Bentem et al., 2007). ... 11
Figure 1.10 Schematic representation of dissertation organization ... 15
Figure 2.1 Measurement of protein solvent accessibility. ... 17
Figure 2.2 Disorder in Calcineurin. ... 18
Figure 2.3 Example of a binding region and its positions relative to the regions of PONDR predicted disorder score (Garner, et al., 1999). ... 19
Figure 2.4 Eukaryotic cellular compartments. ... 22
Figure 2.5 Different forms of ubiquitin and ubiquitin-modified proteins (Chernorudskiy, et al., 2007). ... 29
Figure 2.6 A list of instances for the PDB file 1A52 (Zanzoni, A., et al., 2007). ... 30
Figure 2.7 System flow for constructing dbPTM. ... 33
Figure 2.8 An example of 9-mer (window length n is set to 4) phosphorylated peptides and sequence logo. ... 35
Figure 2.9 System flow of KinasePhos-like method. ... 36
Figure 2.10 A 5x5 contingency table between two positions in PTM site. ... 38
Figure 2.11 The optimization of the threshold of the HMM bit score in the model of phosphorylated serine which is catalyzed by PKA. ... 40
Figure 2.12 Flowchart of constructing PTM benchmark dataset. ... 43
Figure 2.13 The profile hidden Markov model of N-linked (glcNAc) asparagine. .... 47
Figure 2.14 Search interface of dbPTM. ... 52
Figure 2.15 Browse interface of dbPTM. ... 53
Figure 2.17 Example post-translational modification reactions and structures of ... 57
Figure 3.1 Consensus sequences for protein kinases (Lehninger et al., 2005). ... 58
Figure 3.2 Structural environment of reversible modifications (Pang et al., 2007).... 59
Figure 3.3 Phosphorylated insulin-receptor Tyr kinase (PDB: 1IR3) (Lehninger et al., 2006). ... 60
Figure 3.4 An example of decision tree. ... 64
Figure 3.5 A schematic diagram of artificial neural network. Each circle in the hidden and output layer is a computation element known as a neuron (Haykin et al., 1999). ... 66
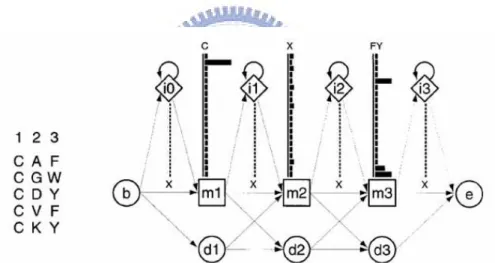
Figure 3.6 An example of small profile HMM representing a short multiple alignment of five sequences with three consensus columns (Eddy et al., 1998). ... 67
Figure 3.7 Basic concept of support vector machine. ... 68
Figure 3.8 Principle of hyperplane in support vector machine. ... 69
Figure 3.9 The system flow of KinasePhos 1.0. ... 74
Figure 3.10 The system flow of KinasePhos 2.0. ... 75
Figure 3.11 The system flow of kinase-specific phosphorylation site prediction. ... 77
Figure 3.12 Comparison of flanking amino acids between phosphorylated and non-phosphorylated sites. ... 86
Figure 3.13 Predictive accuracy of PKA, PKC, CK2, CDK, Src and EGFR models trained with different training features, based on various window sizes. ... 91
Figure 3.14 Web interface of KinasePhos. ... 95
Figure 4.1 Kinase distribution by major groups in human and model systems (Manning et al., 2002). ... 102
Figure 4.2 Phylogenetic tree of human kinome (Manning et al, 2002). ... 104
Figure 4.3 Effects of including network context (Linding et al., 2007). ... 106
Figure 4.4 Annotation and visualization of PhosphoPOINT (Yang et al., 2008). .... 107
Figure 4.5 MAPK signal transduction pathways in yeast (Roberts et al., 2000). ... 108
Figure 4.6 System architecture of RegPhos. ... 121
Figure 4.7 System flow of identification of kinase-substrate interactions. ... 122
Figure 4.8 Pseudocode of breadth-first search (BFS) algorithm. ... 125
Figure 4.9 Schematic representation of Cosine similarity between two vectors. ... 126
Figure 4.10 Schematic representation of phosphorylation network... 129
Figure 4.11 Comparison of clustering results between Euclidean distance and Pearson correlation distance strategies. ... 132
Figure 4.12 The schematic representation of kinase, interacting proteins, and phosphoproteins. ... 135
Figure 4.13 Subcellular localization preference of kinase family and their substrates. ... 140
Figure 4.14 Comparison of Pearson correlation coefficient distribution between background gene pairs and kinase-substrate pairs. ... 142 Figure 4.15 Distribution of Pearson correlation coefficients of PKA-substrate pairs,
CDC2-substrate pairs, and EGFR-substrate pairs based on 98 microarray series. ... 143 Figure 4.16 Distribution of Pearson correlation coefficients of PKA-substrate pairs,
CDC2-substrate pairs, and EGFR-substrate pairs based on time-coursed
microarray data. ... 144 Figure 4.17 Effects of including protein associations. ... 147 Figure 4.18 Example of the discovered phosphorylation networks. ... 148 Figure 4.19 Example of RegPhos-identified kinase-specific phosphorylation sites. 149 Figure 4.20 Validation of the RegPhos-identified kinase-specific phosphorylation
sites using HPRD annotation. ... 150 Figure 4.21 Graphical visualization of substrate protein with catalytic kinases. ... 152 Figure 4.22 The expression profile of kinase and substrate genes. ... 153 Figure 4.23 Example of insulin signaling network in the construction of
phosphorylation network. ... 154 Figure 5.1 Comparison of network visualization between pure interactions and
complex interactions. ... 160 Figure 5.2 Schematic representation of phosphorylation site located in alternatively
List of Tables
Table 1.1 Some common and important post-translational modifications (Mann, M.
and O.N. Jensen, 2003). ... 3
Table 2.1 Summary of the web servers offering prediction of intrinsically disordered proteins. ... 21
Table 2.2 Summary of PTM resource. ... 24
Table 2.3 Data statistics of the integrated PTM resource. ... 34
Table 2.4 Comparisons between KinasePhos, NetPhos, DISPHOS and rBPNN. ... 35
Table 2.5 The amino acids group used in MDD. ... 37
Table 2.6 List of the integrated external databases and programs for structural and functional annotations. ... 42
Table 2.7 Several representative PTM prediction servers. ... 44
Table 2.8 Parameters and predictive performance of the PTM computational models. ... 48
Table 2.9 Data statistics of dbPTM. ... 49
Table 2.10 The statistics of the putative phosphorylation sites, sulfation sites, and glycosylation sites with different thresholds of the Accessible Surface Area (ASA) of residues. ... 50
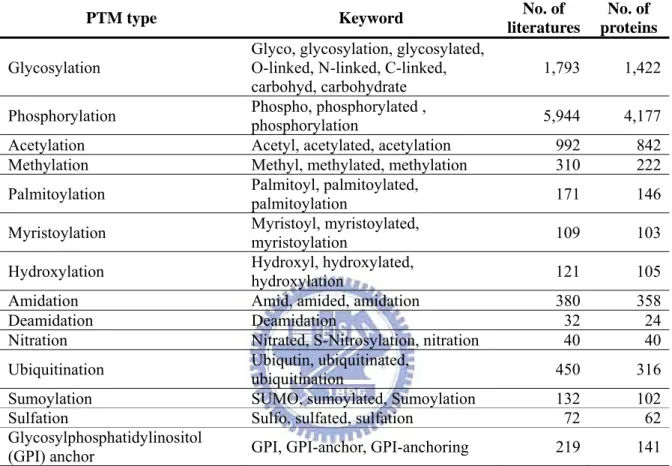
Table 2.11 The statistics of literatures extracted from release 55.0 of Swiss-Prot knowledgebase in several common PTMs. ... 51
Table 2.12 Advances and improvements in current dbPTM. ... 55
Table 3.1 The statistics of structural information in phosphorylated serine, threonine and tyrosine. ... 62
Table 3.2 List of the previously developed phosphorylation site prediction tools. ... 72
Table 3.3 The statistics of phosphorylation sites obtained from Phospho.ELM and Swiss-Prot. ... 78
Table 3.4 Statistics of non-redundant kinase-specific phosphorylation sites in Swiss-Prot and Phospho.ELM. ... 79
Table 3.5 Structural features of kinase-specific groups. ... 88
Table 3.6 Average cross-validation performance of several common kinase-specific groups with training features which reach highest accuracy. ... 93
Table 3.7 Performance of independent test in several common kinase-specific groups. ... 94
Table 3.8 The cross predictive specificity of the kinase-specific models with similar substrate motif. ... 97 Table 3.9 Comparison of KinasePhos 3.0 with PredPhospho, GPS, PPSP,
MetaPredictor, KinasePhos 1.0, and KinasePhos 2.0. ... 99
Table 4.1 Statistics of integrated experimental protein phosphorylation site databases. ... 111
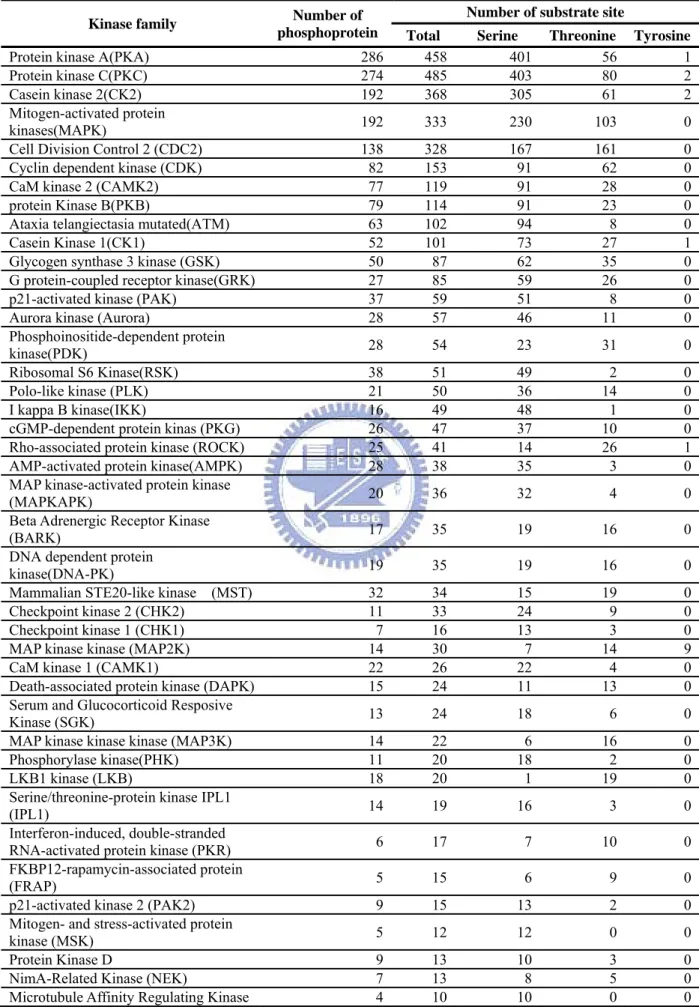
Table 4.2 List of representative kinase families containing more than 10 substrates. ... 112
Table 4.3 Statistics of integrated protein-protein interaction databases. ... 114
Table 4.4 Statistics of integrated functional association databases. ... 116
Table 4.5 List of public databases of protein subcellular localization. ... 117
Table 4.6 List of human gene microarray platform of GEO used in this work. ... 119
Table 4.7 Statistics of integrated experimental protein phosphorylation sites. ... 135
Table 4.8 Statistics of kinases and their interacting proteins. ... 136
Table 4.9 Statistics of kinases and their interacting proteins and functionally associated proteins. ... 136
Table 4.10 The protein interacting neighbor of several representative human kinase families. ... 137
Table 4.11 Subcellular localization of human proteins, kinases and substrates. ... 139
Table 4.12 Subcellular localization of human kinase-specific substrates. ... 141
Table 4.13 Predictive performance of purely SVM-based prediction (KinasePhos).145 Table 4.14 Cross classifying specificity among PKC, CDK, PIKK, and INSR families based on KinasePhos method. ... 146
Chapter 1 Introduction
Protein phosphorylation catalyzed by protein kinase is a ubiquitous reversible post-translational modification (PTM) found in eukaryotes as well as prokaryotes. With the increasing number of in vivo phosphorylation sites have been identified, the desire of map the network of protein kinase and substrate has motivated. To understand how protein kinases regulate their substrates in intracellular processes, it is necessary to link these sites to specific kinases. In this dissertation, we focus on the integration of heterogeneous phosphorylation site databases (Chapter 2 ), identification of kinase-specific phosphorylation sites (Chapter 3), and systematic discovery of kinase-substrate interactions in protein phosphorylation networks (Chapter 4). The comprehensive kinase-substrate interactions are used to construct the intracellular phosphorylation network starting from receptor kinases to transcription factors. Moreover, the experimental expression evidence such as time-series microarray gene expression profiles is adopted to validate the syn-expression of kinase and substrate with statistical significance.
1.1 Biological Background
Protein post-translational modifications (PTMs), involving several chemical groups such as acetyl, methyl, phosphoryl, hydorxyl, glycans, and lipids covalently attach to individual amino acid, alter protein’s biochemical natures significantly and play key roles in a wide variety of cellular processes. Studies suggest that one-third to one-half of all proteins are modified by phosphorylation [1]. In signal transduction pathways, reversible phosphorylation is essential for the maintenance of signaling amplitude, duration and specificity. Until recently, high-throughput mass spectrometry-based method is widely used to identify the phosphopeptides with specific phosphorylated site. Therefore, the increasing number of experimentally verified phosphorylation sites can be adopted to investigate the systems biology of kinase and substrate in detail.
1.1.1 Protein Post-Translational Modifications (PTMs)
mech confo chem attac and p of pr acids half-the m incor post-three proce attac hydr disul datab and i diffe hanism bec formation d mical groups h to individ play key ro rotein modi s for mem life, targeti modification rporated in -translationa Figure 1.1 PTMs arise e categories essing, ini hment of c oxyl, to mo lphide, thio base, there a important p rence, mod cause it m istribution, s such as ac dual amino oles in a wid ifications in mbrane anch ng substrat n of amino nto proteins al modificat 1 Schematic r e from the s based on itiator met chemical g ore comple ether, and are more tha post-translat dified residu may alter p stability, a cetyl, methy acids (Figu de variety o nclude phos horing and tes, and pro
acids does s by ribos tions. representatio cleaving or the follow thionine re groups from ex entities s thioester bo an 400 type tional modif ues, occurr proteins’ p activity, and yl, phospho ure 1.1), alte of cellular p sphorylation association omoting cel occur befor omes, they on of several r forming o wing proces emoval, C-m the siC-mp such as gly onds) [3]. B es of PTMs fications is ring positio hysical an d conseque oryl, hydorx er protein’s processes. E n for signal n, and gly l-cell and c re, during a y are usua common po of covalent sses: cleava -terminal p ple such as ycans or lip By the stati been discov shown in T on, and des
d chemica ntly, their xyl, glycans biochemica Examples of transductio ycosylation cell-matrix and after th ally referred ost-translation bonds and age (includi processing) s acetyl, m pids) and cr istics of RE vered. The l Table 1.1 [5 cription. In al propertie functions [ s, and lipids al natures si f the biolog on, attachm for changi interactions e said amin d to misle nal modifica can be cla ing preand ), linkage methyl, phos ross-linking ESID [4] m list of sever 5] which con n this disse es, folding, 2]. Several s covalently ignificantly gical effects ment of fatty ing protein s. Although no acids are eadingly as ations. assified into propeptide (including sphoryl, or g (including modification ral common ntains mass ertation, we , l y y s y n h e s o e g r g n n s e
focus on the investigation of protein phosphorylation.
Table 1.1 Some common and important post-translational modifications (Mann, M. and O.N. Jensen, 2003).
PTM type ΔMass (Da)
Modified
residue Position Description
Glycosylation O-linked (O-GlcNAc) N-linked >800 203.2 >800 S,T N
anywhere Reversible, cell-cell interaction and regulation of proteins Phosphorylation 79.98 S,T,Y,H,D anywhere Reversible, regulation of protein
activity, signaling Acetylation 42.04 S
K N-term anywhere Reversible, protein stability, regulation of protein function Methylation 14.03 K anywhere Regulation of gene expression,
protein stability Acylation farnesylation myristoylation palmitoylation 204.36 210.36 238.41 C G K C (S,T,K) anywhere N-term Anywhere anywhere
Reversible, cellular localization to membrane
Hydroxyproline 16.00 P anywhere Protein stability and protein-ligand interactions
Deamidation 0.98 N,Q anywhere N to D, Q to E, possible regulator of protein-ligand and
protein-protein interactions, also a common chemical artifact Nitration
S-Nitrosylation 45.029.0 Y C anywhere Oxidative damage during inflammation Ubiquitination
Sumoylation >1,000 K K anywhere [ILFV]K.D Reversible/irreversible, destruction signal, Sulfation 79.96 Y anywhere Modulator of protein-protein and
receptor-ligand interactions Glycosylphosphatidylinositol
(GPI) anchor,
>1,000 S,N,C C-term Membrane tethering of enzymes and receptors, mainly to outer leaflet of plasma membrane
1.1.2 Protein Phosphorylation
Post-translational phosphorylation is one of the most common protein modifications; one-third to one-half of all proteins in a eukaryotic cell are phosphorylated. Phosphoserine, threonine and tyrosine residues play critical roles in the regulation of many cellular processes. As shown in Figure 1.2, the catalytic site of a protein kinase hydrolyzes adenosine triphosphate (ATP) and transfers a phosphate moiety to the acceptor residue (S, T, Y in eukaryotes) in the substrate protein (Figure 1.3).
In Many deph prote prot wher amin nonp Phos obser A gene n eukaryote y enzymes hosphorylati ein is catal ein phosph reas phosph no acid mig polar hydr sphoserine, rved in prok Figure 1.3 An example , which—w Figure 1.2 es, protein s and rec ion. The att lyzed by p hatases. Ph hatases deph ght not seem ophobic p threonine, t karyotes. Chemical f e of the imp when active 2 Schematic r phosphoryl eptors are tachment of protein kin hosphorylat hosphorylat m like it w protein int tyrosine res formula of s portant role e—stimulate representatio lation is pro switched f phosphory nases; remo tion is cata te. Adding a would do m o a pola idues in obs serine, threo that phosph es transcrip on of protein obably the "on" or yl groups to oval of pho alyzed by v a phosphory much to a p r and ex served in eu onine, and t horylation p ption of gen n phosphoryla most impor "off" by specific am osphoryl gr various spe yl (PO3) to rotein, but xtremely h ukaryotes, a tyrosine (Le plays is the nes that su ation. rtant regula phosphory mino acid re roups is ca ecific prote a polar R g it can actu hydrophilic and histidine ehninger et a p53 tumor uppress the atory event. ylation and esidues of a atalyzed by ein kinases, group of an ually turn a molecule. e residue in al., 2005). suppressor cell cycle, . d a y , n a . n r ,
even to the extent that it undergoes apoptosis. However, this activity should be limited to situations where the cell is damaged or physiology is disturbed. To this end, the p53 protein is extensively regulated. In fact, p53 contains more than 18 different phosphorylation sites.
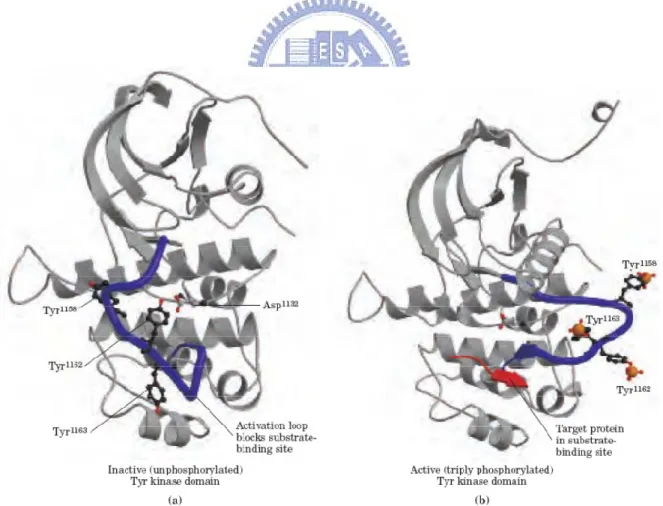
In Figure 1.4a, the inactive form of the Tyr kinase domain (PDB ID 1IRK), the activation loop (blue) sits in the active site, and none of the critical Tyr residues (black and red ball-and-stick structures) are phosphorylated [6]. This conformation is stabilized by hydrogen bonding between Tyr-1162 and Asp-1132. When insulin binds to the α chains of insulin receptors (Figure 1.4b), the Tyr kinase of each β subunit of the dimer phosphorylates three Tyr residues (Tyr-1158, Tyr-1162, and Tyr-1163) on the other β subunit (shown here; PDB ID 1IR3). (Phosphoryl groups are depicted here as an orange space-filling phosphorus atom and red ball-and-stick oxygen atoms.) The effect of introducing three highly charged P –Tyr residues is to force a 30 Å change in the position of the activation loop, away from the substrate-binding site, which becomes available to bind to and phosphorylate a target protein, shown here as a red arrow.
Figure 1.4 Activation of the insulin-receptor Tyr kinase by autophosphorylation (Lehninger et al., 2005).
1.1.3 Signal Transduction Pathway
In biology, signal transduction refers to any process by which a cell converts one kind of signal or stimulus into another. Most processes of signal transduction involve ordered sequences of biochemical reactions inside the cell, which are carried out by enzymes, activated by second messengers, resulting in a signal transduction pathway. Intracellular signal transduction is the process by which chemical signals from outside the cell are passed through the cytoplasm to cellular systems, such as the nucleus or cytoskeleton, where appropriate responses to those signals are generated [7]. Such processes are usually rapid, lasting on the order of milliseconds in the case of ion flux, minutes for the activation of protein- and lipid-mediated kinase cascades, or hours and even days for gene expression. The number of proteins and other molecules participating in the events involving signal transduction increases as the process emanates from the initial stimulus, resulting in a "signal cascade," beginning with a relatively small stimulus that elicits a large response.
As shown in Figure 1.5, most signal transduction involves the binding of extracellular signaling molecules (or ligands) to cell-surface receptors that face outward from the plasma membrane and trigger events inside the cell. Also, intracellular signaling cascades can be triggered through cell-substratum interactions, as in the case of integrins, which bind ligands found within the extracellular matrix. The signaling molecules have been functionally classified as: hormones (e.g., melatonin), growth factors (e.g. epidermal growth factor), extra-cellular matrix components (e.g., fibronectin), cytokines (e.g., interferon-gamma), chemokines (e.g., RANTES), neurotransmitters (e.g., acetylcholine), and neurotrophins (e.g., nerve growth factor). A fundamentally different mechanism of signal transduction is carried out by the receptor enzymes. These proteins have a ligand-binding domain on the extracellular surface of the plasma membrane and an enzyme active site on the cytosolic side, with the two domains connected by a single transmembrane segment. Commonly, the receptor enzyme is a protein kinase that phosphorylates Tyr residues in specific target proteins; the insulin receptor is the prototype for this group. In plants, the protein kinase of receptors is specific for Ser or Thr residues.
both recep trans of th cytop allow subu phos expre the n phos both mitog 1 The Figure 1.6 metabolism ptor to insu scription of he plasma m plasmic fac ws the auto units. Autop phorylation ession of sp next. The in phorylate S a Thr a gen-activate e figure was ob Figur [6] shows m and gene ulin-sensitiv specific gen membrane an ce. Binding ophosphoryl phosphoryla n of other ta pecific gene nsulin recep Ser or Thr r and a Tyr ed, ERK-a btained from h re 1.5 Overv an example e expression ve metaboli
nes. The ins nd two β ch of insulin lation of T ation further arget protein es consists o ptor is a Ty residues. M r residue activating http://en.wikip iew of signa e of insulin-n: the insuli c enzymes sulin recept hains that tr to the α ch yr residues r activates t ns. The sign of a cascade yr-specific k MEK is a du in ERK ( kinase; S pedia.org/wik l transductio -induced sig in signal pa and to the tor consists raverse the hains trigge s in the car
the Tyr kina naling pathw e of protein kinase; the ual-specific (extracellula SRF is se ki/Signal_trans on pathways. gnaling path asses from nucleus, w of two α ch membrane ers a confo rboxyl-term ase domain way by whic n kinases, e other kinas city kinase, ar regulate erum respo sduction 1 hway. Insuli the plasma where it stim hains on the and protrud ormational c minal domai n, which the ch insulin re ach of whic ses (all show
which pho ed kinase); onse facto in regulates membrane mulates the e outer face de from the change that in of the β en catalyzes egulates the ch activates wn in blue) sphorylates ; MEK is or. Protein s e e e e t β s e s ) s s n
phosphorylation plays crucial regulatory role in signal transduction pathway [8].
Figure 1.6 Insulin-induced signal transduction (Lehninger et al., 2005).
1.1.4 Mass Spectrometry-based Identification of Protein
Phosphorylation
Recent successes illustrate the role of mass spectrometry-based proteomics as an indispensable tool for molecular and cellular biology and for the emerging field of systems biology. So far, protein analysis (primary sequence, post-translational modifications (PTMs) or protein–protein interactions) by MS has been most successful when applied to small sets of proteins isolated in specific functional contexts [9]. The systematic analysis of the much
larger number of proteins expressed in a cell, an explicit goal of proteomics, is now also rapidly advancing, due mainly to the development of new experimental approaches. By definition, a mass spectrometer consists of an ion source, a mass analyzer that measures the mass-to-charge ratio (m/z) of the ionized analytes, and a detector that registers the number of ions at each m/z value. Electrospray ionization (ESI) and matrix-assisted laser desorption/ionization (MALDI) are the two techniques most commonly used to volatize and ionize the proteins or peptides for mass spectrometric analysis [10]. ESI ionizes the analytes out of a solution and is therefore readily coupled to liquid-based (for example, chromatographic and electrophoretic) separation tools.
Figure 1.7 Generic mass spectrometry (MS)-based proteomics experiment (Aebersold et al., 2003).
As shown in Figure 1.7, the typical proteomics experiment consists of five stages [9]. In
stage 1, the proteins to be analyzed are isolated from cell lysate or tissues by biochemical fractionation or affinity selection. This often includes a final step of one-dimensional gel electrophoresis, and defines the ‘sub-proteome’ to be analyzed. MS of whole proteins is less
sensitive than peptide MS and the mass of the intact protein by itself is insufficient for identification. Therefore, proteins are degraded enzymatically to peptides in stage 2, usually by trypsin, leading to peptides with C-terminally protonated amino acids, providing an advantage in subsequent peptide sequencing. In stage 3, the peptides are separated by one or more steps of high-pressure liquid chromatography in very fine capillaries and eluted into an electrospray ion source where they are nebulized in small, highly charged droplets. After evaporation, multiply protonated peptides enter the mass spectrometer and, in stage 4, a mass spectrum of the peptides eluting at this time point is taken (MS1 spectrum, or ‘normal mass spectrum’). The computer generates a prioritized list of these peptides for fragmentation and a series of tandem mass spectrometric or ‘MS/MS’ experiments ensues (stage 5). These consist of isolation of a given peptide ion, fragmentation by energetic collision with gas, and recording of the tandem or MS/MS spectrum. The MS and MS/MS spectra are typically acquired for about one second each and stored for matching against protein sequence databases. Figure 1.8 shows an example of MS/MS spectra which contains a phosphorylated serine.
Figure 1.8 Example of phosphopeptide MS/MS spectra.
1.1.5 Phosphoproteomics
Phosphorylation is a key reversible modification occurring mainly on serine, threonine and tyrosine residues that can regulate enzymatic activity, subcellular localization, complex formation and degradation of proteins. Analysis of the entire cellular phosphoproteins panel,
the so-called phosphoproteome, has been an attractive study subject since the discovery of phosphorylation as a key regulatory mechanism of cell life [11]. The understanding of the regulatory role played by phosphorylation begins with the discovery and identification of phosphoproteins and then by determining how, where and when these phosphorylation events take place. Because phosphorylation is a dynamic process difficult to quantify, we must at first acquire an inventory of phosphoproteins and characterize their phosphorylation sites. Several experimental strategies can be used to explore the phosphorylation status of proteins from individual moieties to phosphoproteomes.
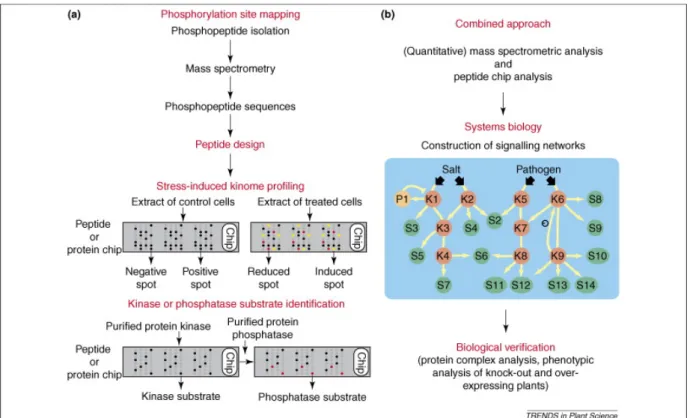
Figure 1.9 Combined large-scale approaches to unravel phosphorylation driven signaling networks (Bentem et al., 2007).
As reviewed previously, mass spectrometry-based techniques have enabled the large-scale mapping of in vivo phosphorylation sites. Alternatively, methods based on peptide and protein microarrays have revealed protein kinase activities in cell extracts, in addition to kinase substrates (Figure 1.9a) [12]. On chips, protein kinase activities are measured by the incorporation of radioactive phosphate into the substrate peptide or protein that are spotted in small amounts, in duplicate or triplicate (as shown here). Yellow and red spots indicate peptides or proteins that are more intensely and less intensely phosphorylated, respectively. Using cell extracts, a more intensely phosphorylated (‘induced’) spot means that a kinase activity in the treated extract towards the peptide or protein is activated. On the contrary, a
less phosphorylated (‘reduced’) spot means that the responsible kinase is inactivated. In case of protein phosphatases, a chip pre-phosphorylated by a purified kinase (or, alternatively, a cell extract) could be used for target discovery. This is possible by analyzing which phosphorylated peptides or proteins are dephosphorylated on the chip, as indicated here by red spots.
A combined phosphoproteomic approach of mass spectrometry and microarray technology could enhance the construction of dynamic signaling networks (Figure 1.9b) [12]. The experimental data, ultimately, need to be combined by systems biology analysis, which translates the separate, large-scale datasets into signaling networks [13]. The predicted connections within and between signaling cascades need to be experimentally verified by, for instance, analysis of protein complexes and analysis of kinase or substrate knockout and over-expression. In the phosphorylation cascade, arrows indicate phosphorylation reactions and the circled minus sign indicates negative feedback phosphorylation. Only phosphoproteins in the signaling network are indicated. Abbreviations: K stands for protein kinase; P stands for protein phosphatase; S stands for substrate. Numbers behind each kinase, phosphatase and substrate are given arbitrarily.
1.2 Motivation
Protein phosphorylation, which is catalyzed by kinase, plays a crucial role in intracellular signal transduction that is achieved by networks of proteins and small molecules that transmit information from the cell surface to the nucleus, where they ultimately effect transcriptional changes. Manning et al. have identified 518 human kinase genes, the so-called “kinome", that provides a starting point for comprehensive analysis of protein phosphorylation networks. How differential responses are generated by these networks is not obvious nor is the reason cells evolved a complicated mechanism for transducing signals. Thus, a full understanding of the mechanism of intracellular signal transduction remains a major challenge in cellular biology.
Mass spectrometry-based proteomics have enabled the large-scale mapping of in vivo phosphorylation sites. There are several phosphorylation site databases have been constructed previously. However, only 20% of the experimentally verified phosphorylation sites have the annotation of catalytic kinases. Experimental identification of kinase-specific
phosphorylation sites is an inconvenient work and usually limited by the availability of detailed data on the kinase-specific substrates. To fully investigate how protein kinases regulate the intracellular processes, it is necessary to comprehensively and accurately identify the kinase-specific substrates. In silico prediction could be a promising strategy to conduct preliminary analyses and could greatly reduce the number of potential targets that need further in vivo or in vitro confirmation.
With the increasing number of in vivo phosphorylation sites have been identified, the desire of map the network of protein kinase and substrate has motivated. The experimental kinase-specific substrates, ultimately, need to be combined by systems biology analysis, which translates the separate, large-scale datasets into signaling networks. Several works have been proposed to incorporate protein-protein interaction data with microarray data for constructing signaling pathway. However, no researchers incorporated the experimentally verified kinase-substrate interactions and the computationally identified kinase-substrate interactions to construct the intracellular phosphorylation network starting from receptor kinases to transcription factors, associated with the formation of protein subcellular localization. Moreover, the experimental expression evidence, such as gene microarray data and mass spectra, could be adopted to validate the syn-expression of the constructed kinase-substrate phosphorylation network.
1.3 Research Goals
In this dissertation, we focus on the integration of heterogeneous phosphorylation site databases, identification of kinase-specific phosphorylation sites, and systematic discovery of kinase-substrate network in human protein phosphorylation.
1.3.1 Management of Heterogeneous Phosphorylation
Databases and Related Information
In this study, a variety of biological databases with heterogeneous data format need to be integrated, including phosphorylation site databases, protein sequence and knowledge databases, gene annotation databases, protein structure databases, protein domain databases, protein-protein interaction databases, biochemical pathway databases, and so on. The
inconsistent data format of these integrated biological databases increases the difficulty in the development of proposed system. Therefore, a data warehousing system should be incorporated to efficiently manage, maintain and update all the collected external databases.
1.3.2 Identification of Kinase-Specific Phosphorylation Sites
Experimental identification of phosphorylation sites is an inconvenient work and usually limited by the availability of detailed data on the kinase-specific substrates. In silico prediction could be a promising strategy to conduct preliminary analyses and could greatly reduce the number of potential targets that need further in vivo or in vitro confirmation. Therefore, we propose a method, namely KinasePhos, which incorporates machine learning methods to identify the phosphorylation sites with their catalytic kinase. Not only protein amino acids, but also the structural information such as secondary structure, solvent accessibility and protein disorder region were used to investigate the substrate specificity. Moreover, the constructed predictive models were evaluated by the independent test sets.
1.3.3 Discovery of Protein Kinase-Substrate Phosphorylation
Networks
To fully investigate how protein kinases regulate the intracellular processes, it is necessary to comprehensively and accurately identify the kinase-specific substrates. Therefore, we propose a method, named RegPhos, incorporates computational model with protein associations (protein-protein interactions, functional associations, and subcellular localization) for identifying the catalytic kinase for each phosphoprotein with experimental phosphorylated sites. With the highly predictive performance of phosphorylation sites, a better understanding of relationships between protein kinases and substrates will be facilitated and engineered to analyze the therapeutic usefulness. The identified kinase-substrate interactions are used to comprehensively construct the intracellular phosphorylation network starting from receptor kinases to transcription factors, with the information of protein-protein interactions and subcellular localization. Moreover, the experimental expression evidence such as time-coursed gene microarray data is adopted to validate the syn-expression of kinase and substrate with statistical significance.
1.4 Organization of This Dissertation
There are three major parts in this dissertation, including the integration of heterogeneous phosphorylation site databases (Chapter 2 ), identification of kinase-specific phosphorylation sites (Chapter 3), and systematic discovery of protein kinase-substrate phosphorylation networks (Chapter 4). A variety of biological databases with heterogeneous data format need to be integrated, including phosphorylation site databases, protein sequence and knowledge databases, gene annotation databases, protein structure databases, protein domain databases, protein-protein interaction databases, biochemical pathway databases, and so on. We propose a method, named RegPhos, incorporates computational model with protein associations (protein-protein interactions, functional associations, and subcellular localization) for identifying the catalytic kinase for each phosphoprotein with experimental phosphorylated sites. The protein phosphorylation network of kinase and substrate in human was constructed using the experimentally verified and computationaly identified kinase-substrate interactions. The gene microarray expression data is adopted to analyze the syn-expression of kinase and substrate genes in specific conditions. Moreover, the microarray data with time series can be used to recognize the dynamic behavior of kinase and their substrate.
Chapter 2 Information Repository of Protein
Post-Translational Modifications
2.1 Introduction
Protein Post-Translational Modification (PTM) is an extremely important cellular control mechanism because it may alter proteins’ physical and chemical properties, folding, conformation distribution, stability, activity, and consequently, their functions [14]. Examples of the biological effects of protein modifications include phosphorylation for signal transduction, attachment of fatty acids for membrane anchoring and association, and glycosylation for changing protein half-life, targeting substrates, and promoting cell-cell and cell-matrix interactions. High-throughput proteomic studies produce a wealth of new information regarding post-translational modifications. With the accelerating progress in proteomics, biological knowledge bases containing a wealth of information, in particular protein modifications, are playing crucial roles in cell regulation research [3]. In this work, we not only provide the sequence-based information such as PTM site, functional domain and protein variant site, but also annotate the structure-based information including protein tertiary structure, protein secondary structure, surface accessibility and protein intrinsic disorder region.
A side chain of amino acid that undergoes enzymatic modification needs to be accessible on the surface of protein [15]. Several works have been proposed the links between the post-translational modifications and their solvent accessible surface area. Pang et al. investigated the structural environment of 8378 incidences in 44 types of post-translational modifications [15]. The information of surface accessibility, disorder region, and linker/domain are computationally annotated by several published programs, including ASA [16], GOR [17] and RVP-net [18] for surface accessibility, RONN[19] and DISEMBL [20] for disorder, PSIPRED [21] for secondary structure, and George et al. [22] for linker/domain. The introduction of structural information of protein is described as following.
Resid prote (typi exten perce expo Since acces Until the w conc 2 The
2.1.1 Pr
due solvent ein surface ical values r nded and sp entage of m osed (here r e the packi ssibility pro2.1.2 Pr
l the early 1 well-known ept, a prot e figure was obrotein So
t accessibili and summi range from pherical am maximally a residues nu ing density ovide upper Figure 2rotein In
1990s, a wi n protein s tein can ac btained from holvent A
ty is usually ng the area 0-300 Å2). mino acids, accessible a umbered 1-3 of native and lower l 2.1 Measurentrinsic D
idely, almos equence → chieve its b http://www.roAccessibil
y measured a that can b To allow co typically r area). A sim 3 and 10-1 proteins re limits to the ement of proDisorder
st exclusive → structure biological f ostlab.org/paplity
d by rolling e accessed omparisons relative valu mplified des 2) and bur sembles tha e number of otein solvenr
ely accepted → functio function on ers/2003_rev_ a spherical by this mol s between th ues are com scription dis ried (here r at of crysta f possible in nt accessibil d concept o on paradigm nly upon fo _1d/paper.htm water mole lecule on e he accessibi mpiled (act stinguishes residues 4-9 als, values nter-residue lity.2 of protein fu m. Accord folding into ml ecule over a ach residue ility of long ual area as two states: 9) residues. for solvent contacts. unction was ing to this o a unique, a e g s : . t s s ,structured state, which represents a kinetically accessible and an energetically favorable conformation (usually the global energy minimum for the whole protein) determined by its amino acid sequence. This specific conformation has been referred to as the native state of the protein. However, recent discoveries of intrinsically disordered proteins (IDPs) [23] (known also as natively disordered, natively unfolded, and intrinsically unstructured proteins) have significantly broadened the view of the scientific community and increased the number of groups systematically studying these intriguing members of the protein world.
Figure 2.2 Disorder in Calcineurin.3
Intrinsically unstructured proteins are frequently involved in key biological processes such as cell cycle control, transcriptional and translational regulation, membrane fusion and transport, and signal transduction [24]. A high percentage of cell-signaling and cancer-associated proteins are predicted to have long disordered regions [25]. An investigation of the functions performed by intrinsically disordered regions reveals that they are often involved in molecular recognition and protein modifications including phosphorylation [26]. To provide a concrete example, the calmodulin binding site in
calcineurin (Figure 2.2)4 was shown to be extremely sensitive to protease digestion and thus to be a disordered ensemble; this disorderliness was confirmed in Kissingers X-ray diffraction structure as indicated by missing coordinates in the same region. As showin in Figure 2.2, Calcineurin’s a-subunit contains a globular phosphatase domain, a helical extension that bind the b-subunit, a disordered region not observed in the crystal structure, and an autoinhibitory peptide that binds in the phosphatase domain’s active site. The a-subunit's intrinsically disordered region, containing 95 amino acids, connects the ends of the helical extension (residue 374) and the autoinhibitory peptide (residue 470) and includes a calmodulin binding site. This region probably is disordered at least in part to allow calmodulin to bind.
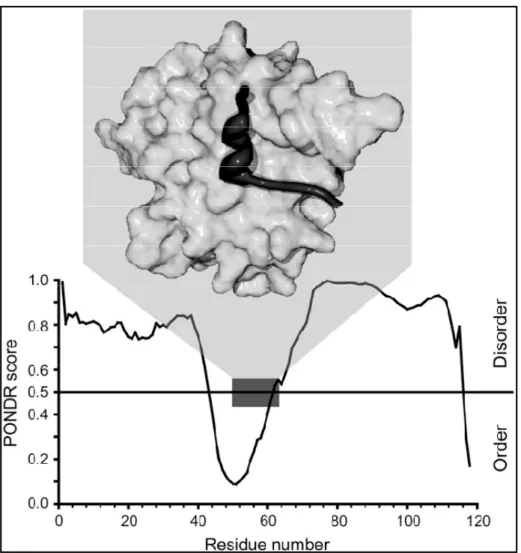
Figure 2.3 Example of a binding region and its positions relative to the regions of PONDR predicted disorder score (Garner, et al., 1999).
Computational methods exploit the sequence signatures of disorder to predict whether a
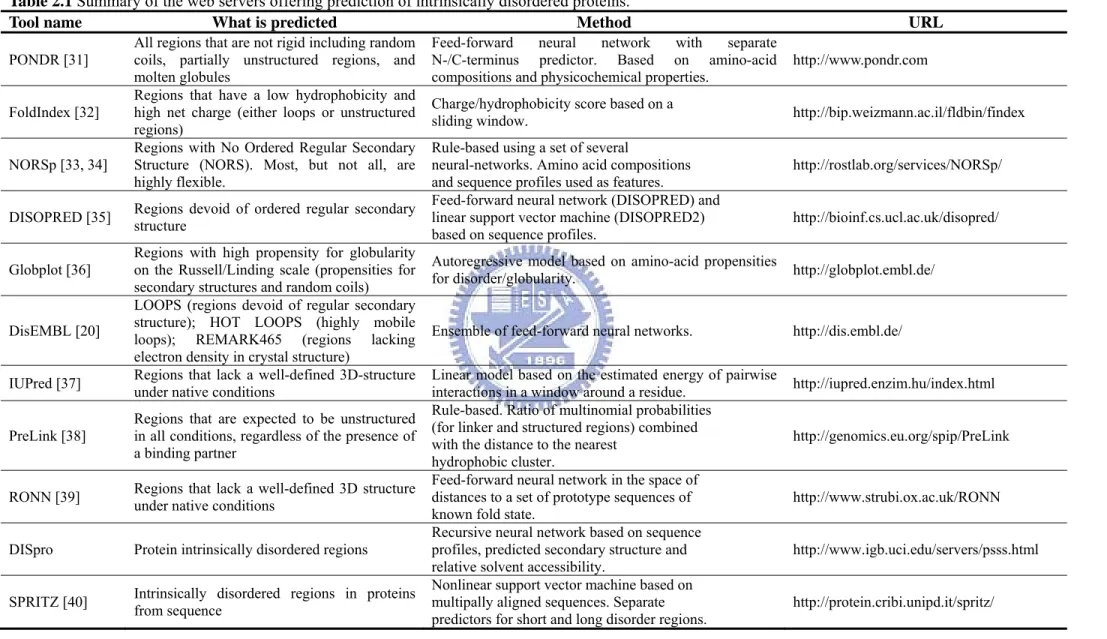
protein is disordered given its amino acid sequence. The table below (Table 2.1), adapted from
Ferron et. al. [27], shows the main features of tools for disorder prediction. Note that different tools use different definitions of disorder. Various predictors of intrinsic disorder have been used to facilitate prediction of functional properties of proteins. The first use of a disorder predictor to find protein-binding sites was performed by Garner et al. [28] who noticed that sharp dips in disorder prediction could indicate short loosely structured binding regions that undergo disorder-to-order transitions upon binding to a partner. Interestingly, these dips in disorder prediction were originally noticed for the 4E binding protein (4EBP1, see Figure 2.3)
[28], which had been shown to be completely disordered by NMR [29]. However, a short stretch of 4EBP1 undergoes a disorder-to-order transition upon binding to eukaryotic translation initiation factor 4E [30].
Table 2.1 Summary of the web servers offering prediction of intrinsically disordered proteins.
Tool name What is predicted Method URL
PONDR [31]
All regions that are not rigid including random coils, partially unstructured regions, and molten globules
Feed-forward neural network with separate N-/C-terminus predictor. Based on amino-acid
compositions and physicochemical properties. http://www.pondr.com
FoldIndex [32] Regions that have a low hydrophobicity and high net charge (either loops or unstructured regions)
Charge/hydrophobicity score based on a
sliding window. http://bip.weizmann.ac.il/fldbin/findex
NORSp [33, 34]
Regions with No Ordered Regular Secondary Structure (NORS). Most, but not all, are highly flexible.
Rule-based using a set of several
neural-networks. Amino acid compositions
and sequence profiles used as features. http://rostlab.org/services/NORSp/
DISOPRED [35] Regions devoid of ordered regular secondary structure Feed-forward neural network (DISOPRED) and linear support vector machine (DISOPRED2)
based on sequence profiles. http://bioinf.cs.ucl.ac.uk/disopred/
Globplot [36]
Regions with high propensity for globularity on the Russell/Linding scale (propensities for secondary structures and random coils)
Autoregressive model based on amino-acid propensities
for disorder/globularity. http://globplot.embl.de/
DisEMBL [20]
LOOPS (regions devoid of regular secondary structure); HOT LOOPS (highly mobile loops); REMARK465 (regions lacking electron density in crystal structure)
Ensemble of feed-forward neural networks. http://dis.embl.de/
IUPred [37] Regions that lack a well-defined 3D-structure under native conditions Linear model based on the estimated energy of pairwise interactions in a window around a residue. http://iupred.enzim.hu/index.html PreLink [38]
Regions that are expected to be unstructured in all conditions, regardless of the presence of a binding partner
Rule-based. Ratio of multinomial probabilities (for linker and structured regions) combined with the distance to the nearest
hydrophobic cluster.
http://genomics.eu.org/spip/PreLink
RONN [39] Regions that lack a well-defined 3D structure under native conditions Feed-forward neural network in the space of distances to a set of prototype sequences of
known fold state. http://www.strubi.ox.ac.uk/RONN
DISpro Protein intrinsically disordered regions Recursive neural network based on sequence profiles, predicted secondary structure and relative solvent accessibility.
http://www.igb.uci.edu/servers/psss.html SPRITZ [40] Intrinsically disordered regions in proteins from sequence Nonlinear support vector machine based on multipally aligned sequences. Separate
2.1.3 Subcellular Localization
The eukaryotic cell is a composite system internally subdivided into membrane-enveloped compartments that perform particular functions [41]. Every subcellular compartment contains specific proteins, including enzymes, synthesized in the cytoplasm and translocated into the locations, wherethey carry out functional patterns. As shown in Figure 2.4, some major
constituents of eukaryotic cells are: extracellular space, cytoplasm, nucleus, mitochondria, Golgi apparatus, endoplasmic reticulum (ER), peroxisome, vacuoles, cytoskeleton, nucleoplasm, nucleolus, nuclear matrix and ribosomes. The proteins which are involved in similar biological functions are closely located in the same subcellular localization. Therefore, knowing the localization of every protein is important for elucidating its interactions with other molecules and for understanding its biological function.
Figure 2.4 Eukaryotic cellular compartments.5
2.2 Related Works
Taking the advantage of the high-throughput mass spectrometry in proteomics, several databases involved in protein modifications were established. UniProtKB/Swiss-Prot [42] includes as much modification information as available with consistency and structure, allowing easy retrieval by biologists. Phospho.ELM [2], PhosphoSite [43] and Phosphorylation Site Database [44] were developed for collecting experimentally verified phosphorylation sites. PHOSIDA [45] integrates thousands of high-confidence in vivo phosphorylation sites identified by mass spectrometry-based proteomics in various species. O-GLYCBASE [46] is a database of glycoproteins, most of which include experimentally verified O-linked glycosylation sites. Moreover, UbiProt stores experimental ubiquitylated proteins and ubiquitylation sites, which are implicated in protein degradation via an intracellular ATP-dependent proteolytic system [47]. The RESID protein modification database is a comprehensive collection of annotations and structures for protein modifications and cross-links including pre-, co-, and post-translational modifications [4]. Each RESID entry presents a protein with a chemically unique modification and indicates how the modification is currently annotated in the Swiss-Prot. The summary of published PTM databases is presented in Table 2.2. The detailed introduction about these PTM resources is illustrated as following.
Table 2.2 Summary of PTM resource.
Resource Reference Description URL
UniProt KB / Swiss-Prot Farriol-Mathis, Garavelli et al. 2004
Experimental PTMs and putative PTMs (annotated as “by similarity”, “potential” or “probable” in the ‘MOD_RES’,
“CARBOHYD”, “LIPID” and “CROSSLNK” fields)
www.expasy.org/sprot/
PhosphoELM Diella, Cameron et al. 2004 Experimental phosphorylation sites phospho.elm.eu.org PhosphoSite Hornbeck, Chabra et al. 2004 Experimental phosphorylation sites www.phosphosite.org Phosphorylation site
database
Wurgler-Murphy, King et al. 2004
Experimental phosphorylation sites in
prokaryotic organisms vigen.biochem.vt.edu/xpd/xpd.htm PHOSIDA Gnad, Ren et al. 2007
In vivo phosphorylation sites which was identified by mass spectrometry-based Proteomics
www.phosida.com HPRD Peri, S. et al. 2003 Human PTMs with curated literatures www.hprd.org PhosPhAt Heazlewood, Durek et al.
2008
mass spectrometry-based identified
phosphorylation sites in Arabidopsis phosphat.mpimp-golm.mpg.de
O-GLYCBASE Gupta, Birch et al. 1999 Experimental glycosylation sites www.cbs.dtu.dk/databases/OGLYCBASE/ UbiProt Chernorudskiy, Garcia et al. 2007 Ubiquitylated protein and ubiquitylation sites ubiprot.org.ru
RESID Garavelli 2004 Protein modification annotations www.ebi.ac.uk/RESID
UniProtKB/Swiss-Prot Modifications
With the accelerating progress in proteomics, UniProt KB/Swiss-Prot knowledge base [48] is faced with the challenge of including this information in a consistent and structured way, in order to facilitate easy retrieval and promote understanding by biologist expert users as well as computer programs. The authors are therefore standardizing the annotation of PTM features represented in UniProt KB/Swiss-Prot [3]. Indeed, a controlled vocabulary has been associated with every described PTM. There are two types of PTM annotation, the experimentally validated PTM sites and the putative PTM sites. The putative PTMs are annotated as “by similarity”, “potential” or “probable” in the ‘MOD_RES’, “CARBOHYD”, “LIPID” and “CROSSLNK” fields.
Phospho.ELM
The fast growing number of research reports on protein phosphorylation points to a general need for an accurate database dedicated to phosphorylation to provide easily retrievable information on phosphoproteins. Phospho.ELM (http://phospho.elm.eu.org) [2], which was developed as part of the ELM (Eukaryotic Linear Motif) resource, is a resource containing experimentally verified phosphorylation sites that were manually curated from the literature. Phospho.ELM constitutes the largest searchable collection of phosphorylation sites available to the research community. The Phospho.ELM entries store information about substrate proteins with the exact positions of residues known to be phosphorylated by cellular kinases. Additional annotation includes literature references, subcellular compartment, tissue distribution, and information about the signaling pathways involved as well as links to the molecular interaction database MINT.
The current release of Phospho.ELM (version 7.0, July 2007) contains 4078 phospho-protein sequences covering 12 025 phospho-serine, 2362 phospho-threonine and 2083 phospho-tyrosine sites [49]. The entries provide information about the phosphorylated proteins and the exact position of known phosphorylated instances, the kinases responsible for the modification (where known) and links to bibliographic references. The database entries have hyperlinks to easily access further information from UniProt [50], PubMed, SMART, ELM, MSD as well as links to the protein interaction databases MINT and STRING. A new BLAST search tool, complementary to retrieval by keyword and UniProt accession number, allows users to submit a protein query (by sequence or UniProt accession) to search against
the curated data set of phosphorylated peptides.
PhosphoSite
PhosphoSite is a curated, web-based bioinformatics resource dedicated to physiologic sites of protein phosphorylation in human and mouse. PhosphoSite is populated with information derived from published literature as well as high-throughput discovery programs. PhosphoSite provides information about the phosphorylated residue and its surrounding sequence, orthologous sites in other species, location of the site within known domains and motifs, and relevant literature references. Links are also provided to a number of external resources for protein sequences, structure, post-translational modifications and signaling pathways, as well as sources of phospho-specific antibodies and probes. As the amount of information in the underlying knowledgebase expands, users will be able to systematically search for the kinases, phosphatases, ligands, treatments, and receptors that have been shown to regulate the phosphorylation status of the sites, and pathways in which the phosphorylation sites function. As it develops into a comprehensive resource of known in vivo phosphorylation sites, PhosphoSite will be a valuable tool for researchers seeking to understand the role of intracellular signaling pathways in a wide variety of biological processes.
Phosphorylation Site Database
Phosphorylation Site Database (http://vigen.biochem.vt.edu/xpd/xpd.htm) [44] provides ready access to information from the primary scientific literature concerning those proteins from prokaryotic organisms, i.e., the members of the domains Archaea and Bacteria, that have been reported to undergo covalent phosphorylation on the hydroxyl side chains of serine, threonine, and/or tyrosine residues. Where known, the sequence of the site(s) of phosphorylation and the functional consequences of phosphorylation also are included. Active links enable users to quickly access further information concerning the phosphoprotein of interest from PubMed, GenBank, SWISS-PROT, and PIR.
PHOSIDA
PHOSIDA (http://www.phosida.com), a phosphorylation site database, integrates thousands of high-confidence in vivo phosphorylation sites identified by mass spectrometry-based
proteomics in various species. For each phosphorylation site, PHOSIDA lists matching kinase motifs, predicted secondary structures, conservation patterns, and its dynamic regulation upon stimulus. Using support vector machines, PHOSIDA also predicts phosphorylation sites.
HPRD
Human Protein Reference Database (HPRD, http://www.hprd.org) [51] is an object database that integrates a wealth of information relevant to the function of human proteins in health and disease. Data pertaining to thousands of protein-protein interactions, posttranslational modifications, enzyme/substrate relationships, disease associations, tissue expression, and subcellular localization were extracted from the literature for a nonredundant set of 2750 human proteins. Almost all the information was obtained manually by biologists who read and interpreted >300,000 published articles during the annotation process. This unified bioinformatics platform will be useful in cataloging and mining the large number of proteomic interactions and alterations that will be discovered in the postgenomic era.
PhosPhAt
The PhosPhAt (http://phosphat.mpimp-golm.mpg.de) [52] database provides a resource consolidating our current knowledge of mass spectrometry-based identified phosphorylation sites in Arabidopsis and combines it with phosphorylation site prediction specifically trained on experimentally identified Arabidopsis phosphorylation motifs. The database currently contains 1187 unique tryptic peptide sequences encompassing 1053 Arabidopsis proteins. Among the characterized phosphorylation sites, there are over 1000 with unambiguous site assignments, and nearly 500 for which the precise phosphorylation site could not be determined. The database is searchable by protein accession number, physical peptide characteristics, as well as by experimental conditions (tissue sampled, phosphopeptide enrichment method). For each protein, a phosphorylation site overview is presented in tabular form with detailed information on each identified phosphopeptide. An analysis of the current annotated Arabidopsis proteome yielded in 27,782 predicted phosphoserine sites distributed across 17,035 proteins. These prediction results are summarized graphically in the database together with the experimental phosphorylation sites in a whole sequence context.
O-GLYCBASE
O-GLYCBASE (http://www.cbs.dtu.dk/databases/OGLYCBASE/) is a database of glycoproteins with O-linked glycosylation sites. Entries with at least one experimentally verified O-glycosylation site have been compiled from protein sequence databases and literature. Each entry contains information about the glycan involved, the species, sequence, a literature reference and http-linked cross-references to other databases. Version 4.0 contains 179 protein entries, an approximate 15% increase over the last version. Sequence logos representing the acceptor specificity patterns for GalNAc, GlcNAc, mannosyl and xylosyl transferases are shown.
UbiProt
UbiProt (http://ubiprot.org.ru) [47] Database is a public resource offering comprehensive information on ubiquitylated proteins. Post-translational protein modification with ubiquitin, or ubiquitylation, is one of the hottest topics in a modern biology due to a dramatic impact on diverse metabolic pathways and involvement in pathogenesis of severe human diseases. As shown in Figure 2.5 [47], Ubiquitylation may result in addition of a single ubiquitin moiety or a branched multi-ubiquitin chain to the target protein lysine(s). Note that a ubiquitin molecule possesses 7 inner lysine residues that can serve as attachment sites of the next ubiquitin moiety, resulting in the formation of the chains that have a different structure and topology. Functionally significant amino acids are marked as follows: Kn and Kn' – lysine residue(s) that can serve as attachment sites of the ubiquitin moiety; G76 – ubiquitin C-terminal glycine residue participating in the isopeptide bond formation.
A great number of eukaryotic proteins were found to be ubiquitylated. However, data about particular ubiquitylated proteins are rather disembodied. To fill a general need for collecting and systematizing experimental data concerning ubiquitylation, a knowledge base of ubiquitylated proteins, UbiProt Database, have been developed. The database contains retrievable information about overall characteristics of a particular protein, ubiquitylation features, related ubiquitylation and de-ubiquitylation machinery and literature references reflecting experimental evidence of ubiquitylation. The resource can serve as a general reference source both for researchers in ubiquitin field and those who deal with particular ubiquitylated proteins which are of their interest. Further development of the UbiProt Database is expected to be of common interest for research groups involved in studies of the
ubiquitin system.
Figure 2.5 Different forms of ubiquitin and ubiquitin-modified proteins (Chernorudskiy, et al., 2007).
RESID
The RESID [4] Database of Protein Modifications is a comprehensive collection of annotations and structures for protein modifications and cross-links including pre-, co-, and post-translational modifications. The database provides: systematic and alternate names, atomic formulas and masses, enzymatic activities that generate the modifications, keywords, literature citations, Gene Ontology (GO) cross-references, protein sequence database feature table annotations, structure diagrams, and molecular models. This database is freely accessible on the Internet through resources provided by the European Bioinformatics Institute (http://www.ebi.ac.uk/RESID), and by the National Cancer Institute--Frederick Advanced Biomedical Computing Center (http://www.ncifcrf.gov/RESID). Each RESID Database entry presents a chemically unique modification and shows how that modification is currently annotated in the protein sequence databases, Swiss-Prot and the Protein Information Resource (PIR). The RESID Database provides a table of corresponding equivalent feature annotations that is used in the UniProt project, an international effort to combine the resources