國 立 交 通 大 學
光 電 工 程 學 系 碩 士 班
碩士論文
橢圓金奈米環之長短軸比效應於表面電漿光學與折射
率感測特性之研究
The Effect of Aspect Ratio on Plasmonic and Index
Sensing Properties of Elliptical Gold Nanoring
研究生: 張開昊
指導教授: 李柏璁 教授
橢圓金奈米環之長短軸比效應於表面電漿光學與折射
率感測特性之研究
The Effect of Aspect Ratio on Plasmonic and Index
Sensing Properties of Elliptical Gold Nanoring
研究生: 張開昊 Student: Kai-Hao Chang
指導教授: 李柏璁 博士 Advisor: Dr. Po-Tsung Lee
國 立 交 通 大 學
光電工程學系碩士班
碩士論文
A Thesis
Submitted to Department of Photonic and Institute of Electro-Optical
Engineering College of Electrical Engineering and Computer Science
National Chiao Tung University
In partial Fulfillment of Requirements
for the Degree of Master
in
Department of Photonic and Electro-Optical Engineering
August 2012
I
橢圓金奈米環之長短軸比效應於表面電漿光學與折射
率感測特性之研究
研究生: 張開昊
指導教授: 李柏璁 博士
國立交通大學光電工程學系碩士班
摘 要
對於不同的環寬、金奈米環的高可調性表面電漿效應已經被研究。由於金奈米 環的內側和外側的表面電漿偶合,使得整體的電場增強度大大的提升;這樣的特 性可以用在生醫感測、光學捕捉和電場增強光譜。 在這篇研究中,我們提出了橢圓金奈米環來研究長短軸比效應在複合式結構裡 的影響。在模擬和實驗上,我們用共振波長,模態分佈和電荷分佈圖在不同的偏振 態方向來理解長短軸比效應在橢圓金奈米環的光學行為。我們發現到共振波長的 可調性和電場增強度可以藉由控制長短軸比獲得提升。此外,我們同時研究橢圓 金奈米環和橢圓金奈米盤的折射率感測特性做比較。我們觀察到長短軸比效應於 表面電漿折射率感測特性的影響,並且在電場於短軸偏振下發現到橢圓金奈米環 獨特的光學和感測率特性,也對此做了完整的討論與研究。II
The Effect of Aspect Ratio on Plasmonic and Index
Sensing Properties of Elliptical Gold Nanoring
Student: Kai-Hao Chang
Advisor: Dr. Po-Tsung Lee
Department of Photonics and Electro-Optical Engineering
Institute, National Chiao Tung University
Abstract
The high tunable localized surface plasmon resonance of nanoring has been
investigated with different ring widths. The strong electric field intensity enhancement of bonding mode is provided by the plasmon coupling between the inner and outer surface of nanoring, which is suitable for biological sensing, nanotrapping and field enhanced spectroscopy.
In this thesis, we propose the elliptical gold nanoring for studying the aspect ratio effect of such hybridized nanostructure. The resonance wavelength, mode profile and charge distribution of elliptical gold nanoring has been studied by simulation and experiment with different aspect ratios and polarizations. The results show that the tunability of the peak wavelength and the electric field intensity enhancement are improved by controlling the aspect ratio. Furthermore, the index sensing properties of elliptical gold nanoring were compared with that of elliptical gold nanodisc. The aspect ratio effect on index sensing was observed and the unique plasmonic properties under transverse polarization have been completely studied.
III
Acknowledgements
很感恩國立交通大學給我一路以來的栽培,給我非常多的資源和學習的機 會,讓我可以在五年內拿到學士和碩士學位。接著,我想感恩 李柏璁教授從專題 以來願意讓我跟大家一起在 PTLee 打拼,雖然我覺得目前的研究並沒有甚麼好的 成果,但是還有機會可以在博士班好好發揮。老師給學生的空間很大,讓學生可 以在研究上自由發揮,同時又在很多地方給予指導。雖然我不常打排球,但是可 以感受到老師常常跟學生沒有距離的互動。在此奉上最真摯的謝意與敬意。 在接下來想感謝實驗室的夥伴;首先是蔡家揚學長,謝謝你給了一個很好 發揮的題目,雖然沒有好的研究結果,但是這個題目非常的有趣。也很不好意思 在這幾年中給你帶來的麻煩跟困擾,在這裡跟你致上歉意。謝謝你在一些關鍵的 問題跟時間點上,給我最大的幫助。還有已經畢業的林君崴學長,謝謝你在機台 上給我的指導,還有教我模擬的設定,讓我在研究上可以更順利。還有幫我寫 e-beam 跟拍 sem 的哲堯和宜錩,感謝因為有你們,才能夠有好的元件跟拍出漂 亮的圖。另外還有贊博跟佐哥,感謝在 meeting 時給予好的建議。感謝品睿和佳 裕曾經 training 過我 wet bench 機台。還有同期一起修課且在研究上互相勉勵 的小智,哲堯和權政。也感謝光陽特別幫我找器材才能進行生醫感測的實驗。還 有學弟小朱跟佑政,這一年來的相處也很快樂。謝謝大家,這一年來的聚餐,打球, 唱歌..等活動讓我很開心,讓我的生活增添不少趣事。也陪我走過那段趕研究的 辛苦時光。 我也很感恩在這段時間給予我溫暖和經濟支柱的家人,讓我無憂無慮的可以 完成學業。很抱歉這段時間不常陪在你們身邊,很珍惜每次跟你們相聚的時光。 最後,我想感謝在禪修上指導我的老師,禪宗第 85 代宗師悟覺妙天師父,很感恩 因為有禪的洗禮,讓我在紛亂的思緒中找到出口。在研究最困難的關鍵時,能夠 傾聽內在的聲音,常常會有靈感湧現,這也的確跟修行的悟性有關,謝謝你讓我 更了悟它。也很感謝我給我自己一個機會,在過去有打好禪定的基礎,即便是忙 了一整天,可以在短短的 20~30 分鐘內充電,維持很高的精神,很難想像沒有接 觸禪的生活。很感恩有這樣的機會。 張開昊 2012 年 8 月 謹誌於新竹IV
Table of Contents
Abstract (in Chinese)...i
Abstract (in English)...ii
Acknowledgements...iii
Table of Contents...iv
Table Captions...vi
Figure Captions...vii
Chapter 1 Introduction
1
1.1 Introduction to Surface Plasmon Polaritons…………...……...…
11.2 LSPR of Metal Nanostructure………...………....
51.2.1 The Geometry Dependent LSPR Properties...
51.2.2 The Hybridized Nanostructure………...
71.3 Local Field Enhancement around Metal Nanoparticle Structures
for Sensing Applications…...………...
111.4 Motivation and Objective………..………...
12Chapter 2 Simulation Method, Fabrication Process, and
Measurement Setup
142.1 Introduction...………..
142.2 Finite Element Method………...………...…...
142.3 Fabrication Process………...
162.4 Measurement Setup………...
192.5 Summary………...…...………
20Chapter 3 Optical Properties of Plasmonic Modes in Elliptical
Gold Nanoring
21
3.1 Introduction………...……….
213.2 Elliptical Nanodisc…………...………..
213.3 Elliptical Nanohole……...………..
243.4 Elliptical Nanoring……….
273.5 Characterization of Plasmon Hybridization in Elliptical Nanoring.
303.5.1 Disc-like Optical Properties of Elliptical Gold Nanoring...
313.5.2 Cavity-like Optical Properties of Elliptical Gold Nanoring...
333.5.3 Plasmon Hybridization in High-order Mode…...………….
35V
3.7 Summary…...………..,………..
43Chapter 4
Index Sensing Properties of Elliptical Gold Nanoring
444.1 Introduction……….………...
444.2 Index Sensing Performance of Elliptical Gold Nanoring…...……...
444.3 Substrate Effect on Index Sensing..………...
524.4 Summary………
55Chapter 5 Conclusion and Future Work
56
5.1 Conclusion………..
565.2 Future Work………
56Appendix A
58
VI
Table Captions
Chapter 1
Table. 1-1: Sizes, plasmon wavelengths, and index sensitivity of various au
nanoparticles [23]. 11
Chapter 4
Table. 4-1: Total energy density in different surrounding mediums for elliptical gold
VII
Figure Captions
chapter 1
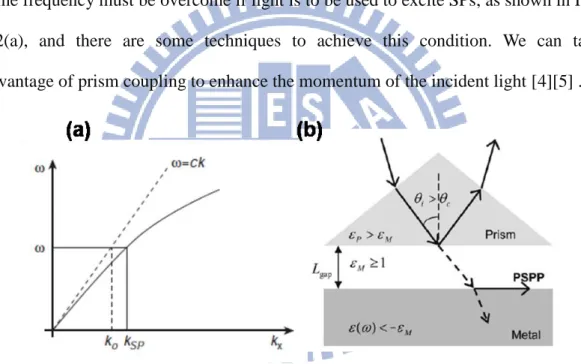
Fig. 1.1: Illustration of the surface charges oscillations at the interface between metal and dielectric medium. 2 Fig. 1.2: (a) The dispersion curve for a SPP mode shows the momentum mismatch. (b) The PSPP is excited thanks to the larger momentum of the photon in the prism, which is transferred by the evanescent field, using total internal reflection [6], [7]. 2
Fig. 1.3: Illustrations of (a) LSPR in the metallic nanosphere and (b) the metallic nanosphere is surrounded by the constant electric field [8]. 4
Fig. 1.4: Optical spectra for different (a) geometry and (b) modified shapes after hearting. 5 Fig. 1.5: (a) AFM image of a gold nanohole array with a periodicity of 450 nm with a diameter of 195 nm. (b) Transmission spectra for Au (lines) and Ag (dashed) nanohole arrays with different nanohole diameters [15]. 6
Fig. 1.6: (a) SEM image of the gold nanorods. (b) The absorbance spectrum of gold nanorods with two distinct modes. (c) Peak wavelength of longitudinal
resonance with varied aspect ratio. (d) Peak wavelength of longitudinal resonance with different surrounding mediums [16]. 6
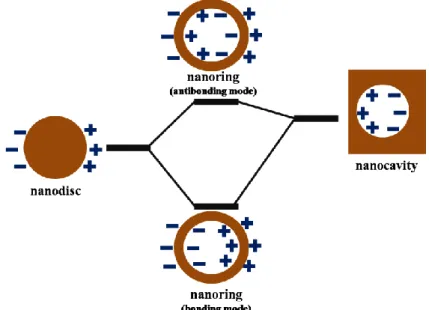
Fig. 1.7: An energy level diagram of plasmon hybridization in nanoring. 8 Fig. 1.8: (a) Side and (b) top views SEM images of gold nanorings, (c) The plasmon resonance wavelength as a function of the ratio of the ring thickness to its radius for bonding and antibonding modes [18]. 9
Fig. 1.9: (a) Schematics of nanorice structure. (b) SEM (left) and TEM (right) images of hematite core with gold shell.(c) Extinction spectra of hematite-Au core-shell nanorice with different shell thicknesses.(d) Near-field profile of the nanorice under longitudinal (up) and transverse (down) polarizations [19]. 9
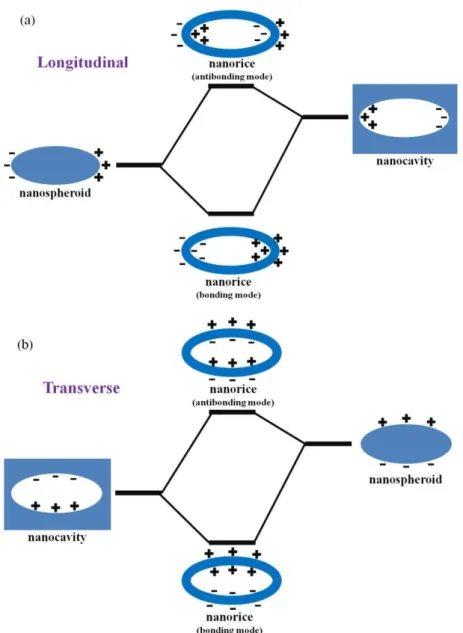
Fig. 1.10: An energy level diagram of plasmon hybridization in nanorice for (a) longitudinal and (b) transverse polarizations. 10
F i g. 1 . 1 1 : T h e d o s e r e s p o n s e c u r v e f o r s t r e p t a v i d i n d e t e c t i o n w i t h biotin-functionalized gold nanorods in (a) PBS and (b) serum [20]. The inset shows the SEM image of gold nanorod. 12 Fig.1.12:Scheme of elliptical gold nanoring. 13
VIII
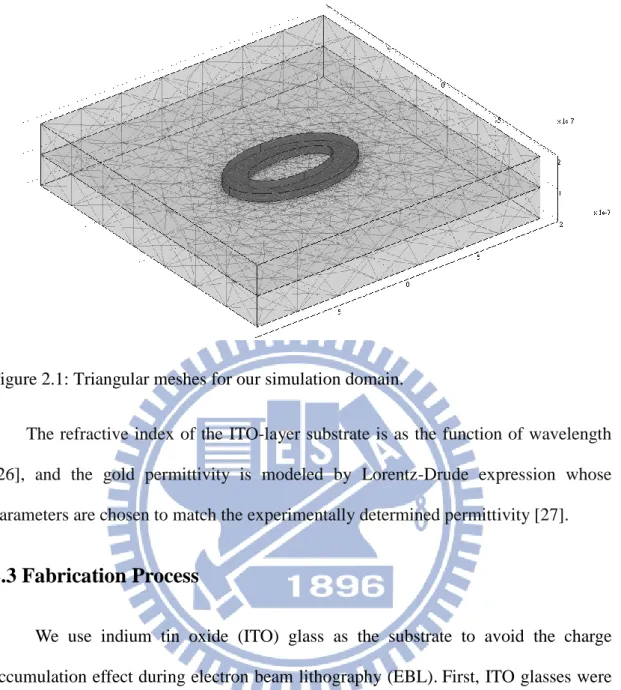
Figure 2.1: Triangular meshes for our simulation domain. 16 Figure 2.2: Illustration of the fabrication process. 17 Figure 2.3: Scheme of elliptical gold nanoring. 17 Figure 2.4: SEM images of elliptical gold (a) nanoring and (b) nanodisk arrays with different aspect ratios. 18 Figure 2.5: (a) Photography and (b) configuration of upright transmission spectroscopy. (c) Partial enlarged detail of upright transmission spectroscopy. 20
chapter 3
Fig. 3.1: Scheme of elliptical gold nanodisc. 21 Fig. 3.2: Simulated extinction spectra of elliptical gold nanodisc with varied aspect ratio under (a) longitudinal and (b) transverse polarizations. 22
Fig. 3.3: Simulated mode profiles with vector field and charge distribution of elliptical gold nanodisc under (a) longitudinal and (b) transverse polarizations at aspect ratio R = 1.58. 23 Fig. 3.4: Measured extinction spectra of elliptical gold nanodisc with varied aspect ratio under (a) longitudinal and (b) transverse polarizations. 24 Fig. 3.5: Scheme of elliptical gold nanohole. 25
Fig. 3.6: Simulated extinction spectra of elliptical gold nanohole with varied aspect ratio under (a) longitudinal and (b) transverse polarizations. 26
Fig. 3.7: Simulated mode profile with vector field and charge distribution of elliptical gold nanohole under (a) longitudinal and (b) transverse polarizations at aspect ratio R = 2.28. 26 Fig. 3.8: Scheme of hybridized elliptical gold nanoring 27 Fig. 3.9: Simulated extinction spectra of elliptical gold nanoring with varied aspect ratio under (a) longitudinal and (b) transverse polarizations. 28
Fig. 3.10: Simulated mode profile with vector field of elliptical gold nanoring under (a) longitudinal and (b) transverse polarizations at aspect ratio R = 1.58. 29 Fig. 3.11: Measured extinction spectra of elliptical gold nanoring with varied aspect ratio under (a) longitudinal and (b) transverse polarizations. 31 Fig. 3.12: An energy level diagram of plasmon hybridization in elliptical gold nanoring for (a) longitudinal and (b) transverse polarizations 32 Fig. 3.13: Peak wavelength-shift trend of elliptical gold nanodisc, nanohole and nanoring with varied aspect ratio under longitudinal polarization. 33 Fig. 3.14: Mode profile with vector field for (a) bonding mode of elliptical gold nanoring and (b) dipole mode of elliptical gold nanodisc with different aspect ratios under longitudinal polarization. 34 Fig. 3.15: Peak wavelength-shift trend of elliptical gold nanodisc, nanohole and nanoring with varied aspect ratio under transverse polarization. 36 Fig. 3.16: Mode profile with vector field for (a) bonding mode of elliptical gold
IX
nanoring and (b) cavity mode of elliptical gold nanohole with different aspect ratios under transverse polarization. 38 Fig. 3.17: High order bonding mode profile with vector field distribution for (a) longitudinal and (b) transverse polarization at R=1.58. 40 Fig. 3.18: (a) Extinction spectra of simulation and experiment for antibonding mode with different aspect ratios under longitudinal polarization. Mode profile of plasmon hybridization for (b) antibonding mode at R=1, (c) hexapolar antibonding at R=1.29, and (d) second-order hexapolar antibonding mode at R=1.29. 41 Fig. 3.19: (a) Extinction spectra of antibonding modes for simulation and experiment under transverse polarization. Mode profile of plasmon hybridization in (b) antibonding mode at R=1, (C) dipolar antibonding at R=1.29, and (d) quadrupolar antibonding at R=1.29. 42 Fig. 3.20: A two dimensional spatial profile of the electric field intensity for elliptical gold (a) nanodisc and (b) nanoring with varied aspect ratio under longitudinal polarization. (c) The field intensity enhancement (EO/EI) as the
function of aspect ratio for elliptical gold nanodisc and nanoring under longitudinal polarization. 45 Fig. 3.21: A two dimensional spatial profile of the electric field intensity for elliptical gold (a) nanodisc and (b) nanoring with varied aspect ratio under transverse polarization. (c) The field intensity enhancement (EO/EI) as the function of
aspect ratio for elliptical gold nanodisc and nanoring under transverse polarization. 46
chapter 4
Fig. 4.1: Simulated peak wavelength of dipole mode for elliptical gold nanodisc as a function of the refractive index of surrounding medium with different aspect ratios under (a) longitudinal and (b) transverse polarizations. 45 Fig. 4.2: Simulated peak wavelength of bonding mode for elliptical gold nanoring as a function of the refractive index of surrounding medium with different aspect ratios under (a) longitudinal and (b) transverse polarizations. 46 Fig. 4.3: The simulated sensitivities of the dipole mode for elliptical gold nanodisc and the bonding mode for elliptical gold nanoring with different aspect ratios under (a) longitudinal and (b) transverse polariztions. 47
Fig. 4.4: The simulated FOM of bonding mode for the elliptical gold nanoring with different aspect ratios under longitudinal and transverse polarizations. 49
X
Fig. 4.5: Measured peak wavelength of dipole mode for the elliptical gold nanodisc with different aspect ratios in different environments under (a) longitudinal and (b) transverse polarizations. 50 Fig. 4.6: Measured peak wavelength of bonding mode for the elliptical gold nanoring with different aspect ratios in different index match liquids under (a) longitudinal and (b) transverse polarizations. 51 Fig. 4.7:Index sensitivities of (a) dipole mode of elliptical gold nanodisc and (b) bonding mode of elliptical gold nanoring with different aspect ratios for simulation and experiment under longitudinal and transverse polarizations.52 Fig. 4.8: Simulated index sensitivity of dipole mode for elliptical gold nanodisc with different aspect ratios on glass and ITO substrate under longitudinal polarization. 53
Fig. 4.9: Schemetic of nanoparticle in effective permittivity surrounding. 53 Fig.4.10: (a) Effective permittivity of elliptical gold nanodisc on ITO substrate with background refractive index n = 1 and n=1.3. (b) Effect index change of elliptical gold nanodisc on ITO substrate as the background refractive index varies from n = 1 to 1.3. (c) The index sensitivity of dipole mode for elliptical gold nanodisc as the function of aspect ratio under longitudinal polarization.(d) The wavelength shift divided by the effective index change of elliptical gold nanodisc as the function of aspect ratio. 54
chapter 5
Fig. 5.1: Peak wavelength shift of elliptical gold nanoring with attached the BSA layer under (a) longitudinal and (b) transverse polarization. 57
Appendix A
Fig. A.1: Scheme of elliptical gold nanoring with the same aspect ratio of cavity and nanoparticle regions. 58 Fig. A.2: Optical properties of elliptical gold nanoring with the same aspect ratio of
1
Chapter1 Introduction
1.1 Introduction to Surface Plasmon Polaritons
Surface plasmons polaritons (SPPs), are coherent electron oscillations that exist at the interface between metal and dielectric material where the real part of the dielectric function changes sign across the interface, as shows in Fig.1.1. This characteristic phenomenon was predicted in 1957 by R.H. Ritchie [1] and extensively studied in the following two decades by many scientists, the foremost whom are Heinz Raether [2], and E. Kretschmann [3].
There are two types of SPPS modes that one is propagating surface plasmon
polaritons (PSPPs) and another is localized surface plasmon polaritons (LSPPs). When the coupling light met resonance condition, the energy of coupling light is efficiently transferred to these SPP modes. This is usually referred as a surface plasmon resonance (SPR). If the SPP mode occurs at localized metal surface, it is usually referred as a localized surface plasmon resonance (LSPR). Then we would introduce the mechanism of SPR for PSPPs and LSPPs. For PSPPs, surface wave can propagate at the interface with TE and TM polarizations. The electric field direction is parallel for TE and perpendicular for TM to the interface which is z=0 in Fig. 1.1. However, the electric field of TE modes should be continue in the metal-dielectric interface, so it’s impossible to induce charges to excite SPPs. Additionally by solving the Maxwell equations with boundary condition, we can get the dispersion of SPPs on the metallic-plane surface.
(1-1)
where ksp is wave vector, and m and d are electric permittivity for metal and
2
Figure 1.1: Illustration of the surface charges oscillations at the interface between metal and dielectric medium.
The resulting momentum mismatch between light and surface plasmons (SPs) of the same frequency must be overcome if light is to be used to excite SPs, as shown in Fig. 1.2(a), and there are some techniques to achieve this condition. We can take advantage of prism coupling to enhance the momentum of the incident light [4][5] .
Figure 1.2 (a) The dispersion curve for a SPP mode shows the momentum mismatch. (b) The PSPP is excited thanks to the larger momentum of the photon in the prism, which is transferred by the evanescent field, using total internal reflection [6], [7].
For LSPPs, the dispersion curve is not true for small metallic nanoparticles, where size becomes comparable or smaller than wavelength. The nature of the electromagnetic mode of system is then completeness. In particular, the description in terms of k vector (kx for a plane) becomes irrelevant.The electromagnetic modes then exist for discrete value of instead of having continuous modes described by the dispersion relation (kx). As opposed to PSPP on planar interfaces, LSPPs are
3
radiative modes with an absorptive component because of optical absorption in the metal. The resonant response therefore, not only appears in absorption but also in scattering measurements. In theory development, the quasi-static approximation is suitable for calculating and describing the scattering field. For a metallic nanosphere with radius a<<λ is in a uniform electric field, as shown in Fig. 1.3 (b). The electric potentials in and out of the metallic sphere are
, (r<a) (1-2) , (r>a) (1-3)
that we focus is the electrical potential out of the sphere, , which can be also translated to
,
(1-4)
where p is dipole moment, and is polarizability. The first term of is from the incident field, and the second term is induced by the ideal dipole. Here concerned of an ideal dipole at z=0 instead of the metallic sphere, which is surrounded by an incident plane wave with an electric field , the
scattering electric field is (1-5) We can calculate the extinction cross section from the equation (1-5):
4
,
λ (1-6)
Figure 1.3: Illustrations of (a) LSPR in the metallic nanosphere and (b) the metallic nanosphere is surrounded by the constant electric field [8].
As shown in the extinction cross section, there would be resonance when . And the LSPR frequency can be obtained by Drude’s model:
, (in air) (1-7)
If the shape of the nanoparticle is not a sphere, the LSPR frequency would be varied with the geometry. We will discuss in the next section.
In summary, SPP modes are confined around the surface of metals to form a highly near-field which has been wildly used in many applications, such as chemical or biological sensing [9], surface-enhanced Raman scattering (SERS) [10], and so on.
5
1.2 LSPR of Metal Nanostructure
The plasmonic properties of LSPR are dominated by size, shape, material and environment. Various metal nanostructures are designed for highly tunable resonance
[11], board bandwidth [12] and extremely field enhancement [13]. There are some popular structures with unique plasmonic properties which would be introduced in
this section.
1.2.1 The Geometry Dependent LSPR Properties
The effect of size and shape of nanoparticle are important parameters of LSPR. An experimental method has been developed the geometrical shape of a nanoparticle plays a major role in determining the plasmon resonance, as shown in Fig. 1.4. The result indicates that spectrum redshifts with increasing particle size and sharper tip [14].
In recent years, research has been focused on understanding the principles of enhanced transmission of light through nanohole arrays with a hole diameter smaller than the wavelength of light. The optical and analytical properties of nanohole arrays
Figure 1.4: Optical spectra for different (a) geometry and (b) modified shapes after hearting.
6
Figure 1.5: (a) AFM image of a gold nanohole array with a periodicity of 450 nm with a diameter of 195 nm. (b) Transmission spectra for Au (lines) and Ag (dashed) nanohole arrays with different nanohole diameters [15].
Figure 1.6: (a) SEM image of the gold nanorods. (b) The absorbance spectrum of gold nanorods with two distinct modes. (c) Peak wavelength of longitudinal resonance with varied aspect ratio. (d) Peak wavelength of longitudinal resonance with different surrounding mediums [16].
can be tuned by modifying the diameter of the nanohole and the metal composition, as shown in Fig. 1.5. The intensity/FWHM ratio are improved for Ag nanohole arrays with smaller hole diameters compared with Au nanohole arrays [15].
7
The optical properties of nanorod are strongly dependent on the polarization of incident light. The plasmon modes under electric field with parallel and perpendicular to the longitudinal-axis are referred as longitudinal and transverse modes. Besides, the peak wavelength of longitudinal mode red-shifts with increasing gold nanorod aspect ratio [16]. These optical properties of gold nanorod are demonstrated as shown in Fig. 1.6.
1.2.2 Hybridized Nanostructure
The hybridized structure has been purposed by Nordlander who developed the theory of hybridization model [17]. The hybridized structure can be seen as the combination of different nanostructures, which results in rich plasmonic properties. An energy level diagram shows the interaction of hybridization plasmon and reveals the features correspond to each individual part of the hybridized nanostructures. We would introduce two hybridized structures, one is nanoring [18] and another is nanorice [19].
For nanoring, the high geometry-dependent plasmon resonance can be seen as an interaction of the plasmon resonance of a nanodisc and that of a nanocavity, as shown in Fig. 1.7. Because of the finite thickness of the ring width, the nanodisc and nanocavity plasmons interact with each other. The strength of the interaction between the nanodisc and nanocavity plasmons is controlled by the ring width. This interaction results in the splitting of the plasmon resonance into two new resonances: the lower energy “bonding” and the higher energy “antibonding” plasmon modes.
8
Figure 1.7: An energy level diagram of plasmon hybridization in nanoring
The optical properties of gold nanoring fabricated by colloidal lithography have been investigated by J.Aizpurua in 2003 [18], as shown in Fig. 1.8. Compared to solid gold particles with similar size, nanorings exhibit a tunable localized surface plasmon mode by varying the ratio of the ring thickness to its radius.
The dielectric core-metallic shell prolate spheroid nanoparticle bears a remarkable resemblance to a grain of rice, inspiring the name “nanorice” as shown in Fig. 1.9. Nanorice is a new hybrid nanoparticle that combines the intense local fields of nanorods with the highly tunable plasmon resonances of nanoshells. The geometry of
such nanostructure possesses far greater structural tunability than either a nanorod or a nanoshell, with much larger local field intensity enhancements [11].
The nanorice plasmon resonance properties are determined by a hybridization of the parent spheroid and cavity plasmon resonances corresponding to the aspect ratio of the nanoparticle. For longitudinal polarization as shown in Fig. 1.10(a), the energy of the bonding and antibonding plasmons are close to the solid spheroid and cavity plasmon energy levels respectively. So the plasmonic properties of bonding plasmon
9
Figure 1.8: (a) Side and (b) top views SEM images of gold nanorings, (c) The plasmon resonance wavelength as a function of the ratio of the ring thickness to its radius for bonding and antibonding modes [18].
Figure 1.9: (a) Schematics of nanorice structure. (b) SEM (left) and TEM (right) images of hematite core with gold shell.(c) Extinction spectra of hematite-Au core-shell nanorice with different shell thicknesses.(d) Near-field profile of the nanorice under longitudinal (up) and transverse (down) polarizations [19].
10
Figure 1.10: An energy level diagram of plasmon hybridization in nanorice for (a) longitudinal and (b) transverse polarizations.
are dominated by nanospheroid plasmon and those of antibonding mode are
dominated by cavity plasmon. For transverse polarization as shown in Fig. 1.10(b), the situation is reversed. These properties have been investigated in previous study [19].
From the popular nanostructures in section 1.2.1 and the hybridized nanostructures in section 1.2.2, we found that the plasmonic properties of these kinds of nanostructures could be designed and tuned by aspect ratio, shell thickness and ring width.
11
1.3 Local Field Enhancement around Metal Nanoparticle Structures
for Sensing Applications
The enhanced localized field induced by surface plasmon oscillation can be applied into many applications, such as detecting the local change of dielectric environment for biological sensing [20], producing high electromagnetic force for nanotrapping [21], and boost the Raman cross section of molecules by many orders of magnitude for surface-enhanced Raman scattering (SERS) [22].
The shape dependent electric field enhancement for sensing performance is widely studied in various fantasy structures. The sensing performances of nanoparticles with different lengths, diameters and aspect ratios are discussed, as shown in the Table 1-1 [23].
Table 1-1 Sizes, plasmon wavelengths, and index sensitivity of various au nanoparticles [23].
Since the enhanced fields are localized at the surface of plasmonic nanostructures, they serve as a local probe of the dielectric environment within a few nanometers of the particle surface. For this fact, the optical biosensors is an important application which can detect the small molecular around the plasmonic nanostructure. For selecting bimolecular, the biotin streptavidin interaction is often measured when developing biological assays because it forms a strong, specific bond. In addition, many reagents for bioconjugate techniques based on biotin-streptavidin are readily available. Streptavidin detection with different concentration has also been
12
demonstrated inserum and dilute blood, as shown in Fig. 1.11. The wavelength shift in phosphate buffered saline (PBS) and 40% serum from picomolar to micromolar concentrations of streptavidin shows the great detectable ability for wide range concentration based on gold nanorod with high field enhancement.
Figure 1.11: The dose response curve for streptavidin detection with biotin-functionalized gold nanorods in (a) PBS and (b) serum [20]. The inset shows the SEM image of gold nanorod.
1.4 Motivation and Objective
The high tunable nanostructure geometries include the metal nanoring and the nanorod structure which have been introduced in previous section. The elliptical gold nanoring geometry can be seen as the combination of nanorod and nanoring, so the optical properties of elliptical gold nanoring combine the ring width dependent optical behavior of nanoring with aspect ratio dependent optical behavior of nanorod. The plasmonic properties of elliptical gold nanoring are expected to be improved, including field enhancement, resonance wavelength tunability, and index sensitivity. For field enhancement, the near field of elliptical gold nanoring is larger as compared to that of nanoring due to the sharp shape of the two sides for elliptical gold nanoring. For resonance wavelength tunability, the plasmon coupling of elliptical gold nanoring
13
between inner and outer surfaces is more enhanced at larger aspect ratio. For index sensitivity, the wavelength shift of elliptical gold nanoring is better than that of elliptical gold nanodisc due to additional contribution from the electromagnetic field
in cavity region. Fig 1.12 shows the scheme of elliptical gold nanoring. This structure is expected to be more tunable and sensitive with larger intensity enhancement.
The thesis is organized as following, in chapter 2, we introduce the simulation method, fabrication processes and measurement setup. In chapter 3, we study the optical properties of the SPR modes for elliptical nanodisk, elliptical nanohole and elliptical nanoring with different aspect ratios by simulation. Furthermore, the simulation result of plasmon hybridization behavior is confirmed by experiment. In chapter 4, wefurther investigate the performances of index sensing for elliptical gold nanodisc and nanoring in simulation and experiment. Finally, conclusion of research results and future work are discussed in chapter 5.
14
Chapter 2 Simulation Method, Fabrication,
Process, and Measurement Setup
2.1 Introduction
In this chapter, we explained the fundamental theory of the numerical method to simulate the extinction spectrum and mode profiles of elliptical gold nanoring. To realize the structure, standard nano-fabrication processes for gold nanostructures including electron-beam lithography, thermal evaporation coating, and lift-off are introduced. To measure the plasmonic properties and sensing performances of metallic nanostructure, we set up an upright transmission spectroscopy and its configuration is described.
2.2 Finite Element Method
In our simulation, Maxwell’s equations are solved by COMSOL Multiphysics (commercial software) using finite element method (FEM) to find approximate solutions. Start from Maxwell’s equations, if we assume E-field and H-field are time harmonic modes, the vector wave equation for E-field can be derived as following:
Time harmonic H-field and E-field:
(2-1)
Maxwell’s equations:
(2-2) From (2-1) and (2-2), we get vector wave equation of E-field.
15
terms in electromagnetic field are eliminated in this wave equation because the assumption of time harmonic mode, thus obtained solution is stationary state. In order to solve this wave equation with appropriate boundary conditions, standard FEM proceeds in three steps [24]. First, the wave equation is identified as solutions of certain variational problems where the boundary conditions at the surface ∂V of the computational domain V have been incorporated as additional terms in the Lagrangian:
(2-4) where n denotes the outward normal at the surface ∂V and the electric field has to satisfy the boundary condition n × E = 0 on ∂S. γe and U are known quantities which
are used to represent other types of boundary conditions such as scattering boundary conditions in our simulation.
The second step is discretization of the Lagrangian. The computational domain V is subdivided into a number of finite elements in three dimensions of triangular shape, as shown in Fig.2.1. Within each element, the electric field is expanded into a series of certain elementary functions with unknown coefficients.
In the final step, these expansions facilitate the transformation of the Lagrangian into a set of linear equations by Galerkin method [25] which is used to seek solutions by weighting the residual of the differential equation. These matrices can be solved by advanced linear algebra methods, either for obtaining eigenmodes of the system or to determine extinction cross sections of complex structures as well as transmittance and reflectance.
16
Figure 2.1: Triangular meshes for our simulation domain.
The refractive index of the ITO-layer substrate is as the function of wavelength [26], and the gold permittivity is modeled by Lorentz-Drude expression whose parameters are chosen to match the experimentally determined permittivity [27].
2.3 Fabrication Process
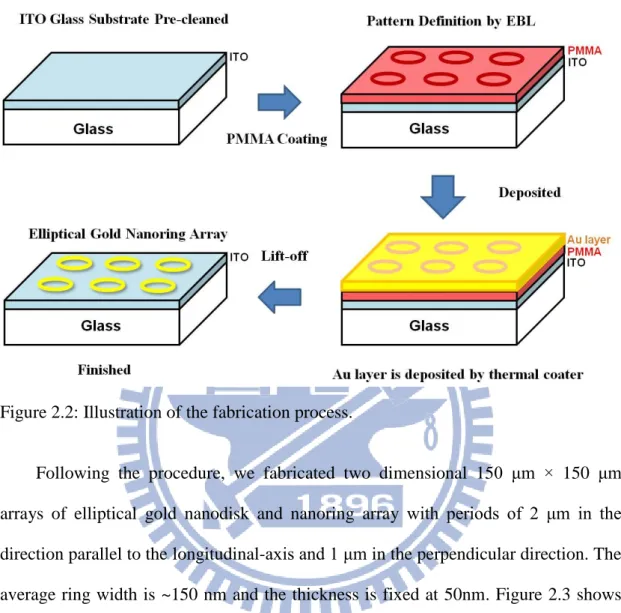
We use indium tin oxide (ITO) glass as the substrate to avoid the charge accumulation effect during electron beam lithography (EBL).First, ITO glasses were cleaned in acetone followed by isopropanol (IPA) for 20 min and dried in N2. Then
these substrates were spin-coated with 150 nm polymethyl methacrylate (PMMA) electron-sensitive resist followed by curing. The patterns for the nanodisk and nanoring dimer arrays were written on PMMA by using electron beam lithography system. During the expose step, pattern geometries can be controlled by choosing appropriate point and line dosage. The exposed PMMA becomes soluble and dissolves in e-beam resist developer (MIBK solution). Au layer with 50 nm of thickness is then deposited at a rate of 0.3 Å /s by thermal evaporation. Finally, the
17
PMMA resist and the overlaying Au layer were removed by lift-off in acetone at room temperature. The illustration of overall fabrication process is shown in Fig.2.2.
Figure 2.2: Illustration of the fabrication process.
Following the procedure, we fabricated two dimensional 150 μm × 150 μm arrays of elliptical gold nanodisk and nanoring array with periods of 2 μm in the direction parallel to the longitudinal-axis and 1 μm in the perpendicular direction. The average ring width is ~150 nm and the thickness is fixed at 50nm. Figure 2.3 shows scheme of elliptical gold nanoring which the aspect ratio is defined as the R = Lx/Ly.
18
For the elliptical gold nanoring, the aspect ratio is varied as 0.95, 1.11, 1.27, 1.43, and 1.54. The patterns were imaged by scanning electron microscope (SEM), as
shown in Fig. 2.4 (a). For the elliptical gold nanodisc, the aspect ratio is varied as 1.04, 1.12, 1.25, 1.31, and 1.41. The patterns were imaged by SEM, as shown in Fig. 2.4 (b).
Figure 2.4: SEM images of elliptical gold (a) nanoring and (b) nanodisk arrays with different aspect ratios.
19
2.4 Measurement Setup
Fig. 2.5 shows the configuration and photography of upright transmission spectroscopy. Light from a halogen lamp was polarized by a polarizer, collimated and focused by a 20x objective lens on the sample at normal incidence. Alignment between the incident light and the sample can be adjusted by 3-axes stage where the sample is mounted. This adjustment can be monitored by the projection of the pattern on a simple screen. Output signal was collected by another 20x objective lens and coupled into multimode fiber (MMF), which was finally analyzed by an optical spectrum analyzer (OSA). The extinction spectra as shown in the following are given by –log (P/P0), where P and P0 are the power of transmitted light with and without
passing through the patterns.
On the other hand, in order to investigate the optical sensing performance of these devices, we change the environmental refractive index of elliptical gold nanodisk and nanoring by immersing the fabricated device in index match liquid (n = 1.3~1.39), and obtaining their transmission spectra by the upright transmission spectroscopy.
20
Figure 2.5: (a) Photography and (b) configuration of upright transmission spectroscopy. (c) Partial enlarged detail of upright transmission spectroscopy.
2.4 Summary
In this chapter, we introduced the fundamental theory of finite element method for our simulations. And we described the nano-fabrication processes for realizing the elliptical gold nanoring, which are composed of e-beam lithography, thermal evaporation, and lift-off. Finally, we described the configuration of upright transmission spectroscopy and the method of sensing performance measurement of fabricated devices.
21
Chapter 3 Optical Properties of Plasmonic
Modes in Elliptical Gold Nanoring
3.1 Introduction
In this chapter, the optical responses of elliptical nanostructure with different aspect ratios are investigated. The elliptical gold nanodisc, nanohole and nanoring are simulated for comparison under longitudinal and transverse polarizations. The plasmonic properties of elliptical gold nanoring are understood by the combination of plasmonic behaviors with elliptical gold nanodisc and nanohole. In addition, we also fabricated the elliptical gold nanodisc and nanoring arrays and analyzed their optical responses. The resonance wavelength and mode profiles are studied for understanding plasmons behavior of elliptical nanostructure with gradually varied aspect ratio. Finally, the plasmon hybridization of elliptical gold nanoring is discussed.
3.2 Elliptical Nanodisc
In simulation, the fixed short-axis dimension Ly and the height t of elliptical
nanodisc are set to be 275nm and 50 nm. The aspect ratio R which is defined as the length of long axis divided by the length of short axis is varied from 1 to 1.58 by elongating the long-axis dimension Lx, as shown in Fig. 3.1. The surrounding medium
is assumed to be air. We use the Lorentz-Drude model to describe the gold dielectric function and consider the dispersion of ITO. Incident plane waves of power 1 W and
22
Figure 3.2: Simulated extinction spectra of elliptical gold nanodisc with varied aspect ratio under (a) longitudinal and (b) transverse polarizations.
wavelength ranges from 400 to 1700 nm are employed to excite the elliptical gold nanodisc. The incident electric field parallel to the long axis is defined as longitudinal polarization, and another direction perpendicular to the short axis is defined as transverse polarization.
The simulated extinction spectra of elliptical gold nanodisc for longitudinal and transverse polarizations are shown in Fig 3.2. Under longitudinal polarization, the distinct dipole mode red shifts with broaden band width as the aspect ratio is increased. However, it blue shifts slightly under transverse polarization. These results are confirmed with previous experiment [28]. To indentify the plasmon modes of
23
elliptical gold nanodisc, we simulated the mode profiles with vector field are shown in Fig 3.3. The multipole plasmon of the elliptical gold nanodisc has been studied in previous studies [28]. It indicates that high order modes can be excited by elongating the nanodisc for both longitudinal and transverse polarizations.
Figure 3.3: Simulated mode profiles with vector field and charge distribution of elliptical gold nanodisc under (a) longitudinal and (b) transverse polarizations at aspect ratio R = 1.58.
The measured extinction spectra of elliptical gold nanodisc with different aspect ratios for longitudinal and transverse polarizations are verified by the simulated result, as shown in Fig. 3.4. The peak wavelengths of dipole modes show the red-shift and blue-shift behaviors for longitudinal and transverse polarizations. The red shift of high order mode is also observed in experiment.
24
Figure3.4: Measured extinction spectra of elliptical gold nanodisc with varied aspect ratio under (a) longitudinal and (b) transverse polarizations.
3.3 Elliptical Nanohole
For the elliptical gold nanohole, the fixed short-axis dimension Ly and the height
t are set to be 125 nm and 50 nm in our simulation. The aspect ratio R is varied from 1 to 2.28 by elongating the long-axis dimension Lx, as shown in Fig. 3.5. For metal thin
film, the transmission or scattering intensity are studied for searching the resonance wavelength usually. Figure 3.6 shows the behavior of resonance wavelength
25
completely opposite to the case of elongated metal particles. A simple analytical model qualitatively explains this observation in terms of the different orientations of the induced dipole moments in holes and particles [29]. The charge distribution of induced dipole in metal film for nanohole is opposite to that of induced dipole for the metallic nanoparticle with the same size. This effect changes not only the trend of peak wavelength shift but also the behavior of amplitude for scattering light [29].
26
Figure 3.6: Simulated extinction spectra of elliptical gold nanohole with varied aspect ratio under (a) longitudinal and (b) transverse polarizations.
The cavity mode is shown in Fig. 3.7. The mode profile indicates that the field intensity of transverse mode is stronger than that of longitudinal mode. In addition, the vector field of cavity mode is plotted for studying the dipole oscillation. The charge distribution of induced cavity mode for nanohole is opposite to that of induced dipole mode for nanodisc by studying the direction of electromagnetic field.
Figure3.7: Simulated mode profile with vector field and charge distribution of elliptical gold nanohole under (a) longitudinal and (b) transverse polarizations at aspect ratio R = 2.28.
27
3.4 Elliptical Nanoring
Fig. 3.8 shows the scheme of elliptical gold nanoring with uniform ring width W, fixed short axis Ly and varied long axis. For elliptical gold nanoring in simulation,
uniform ring width W, fixed short-axis dimension Ly and thickness are set to 150, 200
and 50 nm. The aspect ratio is varied from 1 to 1.58 in simulation. The extinction spectra are obtained for longitudinal and transverse polarizations in Fig. 3.9. By gradually elongated the gold nanoring, resonance modes red shift for both longitudinal and transverse polarizations. This phenomenon can be described by plasmon hybridization which is presented as the disc-like behavior under longitudinal and cavity-like behavior under transverse polarization.
Figure 3.8: Scheme of hybridized elliptical gold nanoring
Interestingly, there is only two mode at R=1 aspect ratio which are identified as bonding and antibonding modes. However, there are four plasmonic modes at R=1.58 under both longitudinal and transverse polarization, as shown in Fig. 3.10. The plasmonic high order mode can be induced by elongated the nanostructure under both longitudinal and transverse polarizations. The second-order hexapolar antibonding mode around 680nm is induced by the ring width effect which breaks the symmetries of elliptical gold nanoring in appendix A. These plasmonic modes are the result of coupling between inner and outer surfaces by the interaction of plasmon hybridization, which is introduced in next section.
28
Figure 3.9: Simulated extinction spectra of elliptical gold nanoring with varied aspect ratio under (a) longitudinal and (b) transverse polarizations.
Figure 3.11 shows the extinction spectra for longitudinal and transverse polarizations with different aspect ratios R from 0.95 to 1.54. Under longitudinal polarization, there are two plasmonic modes at R = 0.95 and R = 1.11, which are bonding and antibonding mode. As the aspect ratio is 1.27, there are two plasmonic modes which are bonding and hexapolar antibonding mode. For R = 1.43 and R = 1.54, the additional two plasmonic modes are induced, which are hexapolar bonding and second-order hexapolar antibonding modes. Under transverse polarization, the bonding and antibonding mode are observed at R = 0.95 and R = 1.11. As the aspect ratio is 1.27, there are two plasmonic modes which are bonding and dipolar antibonding mode. For R = 1.43, the additional plasmonic mode is induced, which is quadrupolar antibonding mode. For R = 1.54, the hexapolar bonding mode is appeared. These modes will be discussed in detail by the concept of plasmon hybridization in next section
29
Figure 3.10: Simulated mode profile with vector field of elliptical gold nanoring under (a) longitudinal and (b) transverse polarizations at aspect ratio R = 1.58.
Figure 3.11: Measured extinction spectra of elliptical gold nanoring with varied aspect ratio under (a) longitudinal and (b) transverse polarizations.
30
3.5 Characterization of Plasmon Hybridization in Elliptical Gold
Nanoring
The plasmon hybridization for elliptical gold nanoring is similar with spheroid nanoshell. The energy level diagrams are shown in Fig. 3.12 for longitudinal and transverse polarizations. For the plasmonic properties under longitudinal polarization, the plasmon energy of bonding mode is close to the energy of nanodisc so the plasmonic properties of elliptical gold nanoring are dominated by disc mode. On another hand, the plasmon energy of antibonding mode is close to the energy of nanohole so the plasmonic properties of elliptical gold nanoring are dominated by cavity mode. For the plasmonic properties under transverse polarization, the plasmon energy of bonding mode is close to the energy of nanohole so the plasmonic properties of elliptical gold nanoring are dominated by cavity mode. In addition, the plasmon energy of antibonding mode is close to the energy of nanodisc so the plasmonic properties of elliptical gold nanoring are dominated by cavity's mode. These optical behaviors of plasmon hybridization are shown in the resonance wavelength, mode profile and field enhancement.
31
Figure 3.12: An energy level diagram of plasmon hybridization in elliptical gold nanoring for (a) longitudinal and (b) transverse polarizations.
3.5.1 Disc-like Optical Properties of Elliptical Gold Nanoring
The plasmonic behavior of elliptical gold nanoring with different aspect ratios under longitudinal polarization is similar with that of dipole mode for elliptical
Figure 3.13: Peak wavelength-shift trend of elliptical gold nanodisc, nanohole and nanoring with varied aspect ratio under longitudinal polarization.
32
Figure 3.14: Mode profile with vector field for (a) bonding mode of elliptical gold nanoring and (b) dipole mode of elliptical gold nanodisc with different aspect ratios under longitudinal polarization.
33
gold nanodisc. This optical behavior is described in resonance wavelength shift. Fig. 3.13 shows red-shift of bonding mode of elliptical gold nanoring as the aspect ratio is increased also in elliptical gold nanodisc. In addition, high order mode of elliptical gold nanoring and nanodisc are appeared as the aspect ratio is increased. These optical properties of elliptical gold nanoring and nanodisc are similar because the plasmon energy of longitudinal bonding mode is close to that of dipole mode of nanodisc. For vector field distribution, the plasmon mode of elliptical gold nanoring is compared with that of nanodisc in Fig. 3.14. For bonding mode under longitudinal polarization, the nanodisc mode dominated behavior is observed from R = 1.29, which the vector field in the region of metal is the same as that of elliptical nanodisc and the field distribution is similar with the plasmonic modes of elliptical nanodisc. For antibonding mode under transverse polarization, the plasmonic property is dominated by nanodisc mode in both vector field and field distribution. However, the antibonding mode under transverse polarization would be introduced in 3.5.3.
3.5.2 Cavity-like Optical Properties of Elliptical Gold Nanoring
Figure 3.15: Peak wavelength-shift trend of elliptical gold nanodisc, nanohole and nanoring with varied aspect ratio under transverse polarization.
34
Figure 3.16: Mode profile with vector field for (a) bonding mode of elliptical gold nanoring and (b) cavity mode of elliptical gold nanohole with different aspect ratios under transverse polarization.
35
The plasmonic behavior of elliptical gold nanoring with different aspect ratio under transverse polarization is similar with that of cavity mode for elliptical gold nanohole, as shown in Fig. 3.15. However, the optical spectra of elliptical gold nanohole with different aspect ratios show red shifts because the plasmon oscillation of cavity mode is different with dipole mode’s behavior. The plasmonic properties of nanohole have been investigated by B. Sepulveda in the experiment and simulation which are mentioned before [29]. For mode profile with vector field, the transverse bonding mode of elliptical gold nanoring is compared with the cavity mode of nanohole, as shown in Fig. 3.16. For bonding mode under transverse polarization, the plasmonic properties of elliptical gold nanoring is similar with that of elliptical gold nanohole mode from R=1.43. The vector field of transverse bonding mode is the same as that of cavity mode in the region of metal and the field distribution is similar with the plasmonic modes of elliptical nanohole. For antibonding mode under longitudinal polarization, the plasmonic properties are similar with with that of cavity mode for elliptical gold nanohole in both vector field and field distribution. The mode profile with vector field of antibonding mode under transverse polarization would be introduced in next section.
3.5.3 Plasmon Hybridization in High-order Mode
As the aspect ratio is increased, the high order mode would be induced in both longitudinal and transverse polarizations. These high-order mode profiles are varied with different aspect ratio because the plasmon interaction between the inner and outer surface of elliptical gold nanoring is changed with plasmon coupling of different plasmonic modes. For the hexapolar bonding mode, the plasmon hybridization can be seen as the coupling between high order elliptical disc mode and cavity mode in mode profile, as shown in Fig. 3.17. The extinction spectrum shows the splitting of antibonding mode into two modes since the aspect ratio is at R=1.29 in both longitudinal and transverse polarizations in Fig. 3.18 (a) and Fig. 3.19 (a).For the longitudinal antibonding mode, the plasmon coupling is different due to varied
36
plasmonic mode relative with different aspect ratios, as shown in fig. 3.18. At R=1,
Figure 3.17: High order bonding mode profile with vector field distribution for (a) longitudinal and (b) transverse polarization at R=1.58.
The dipole mode of nanodisc couples with the cavity mode. As the nanostructure is elongated, the hexapole mode or the second-order hexapole mode couples with cavity mode, which results in the hexapolar antibonding mode or second-order hexapolar antibonding mode. For the transverse antibonding mode, the plasmon coupling is also
37
38
Fig. 3.18: (a) Extinction spectra of simulation and experiment for antibonding mode with different aspect ratios under longitudinal polarization. Mode profile of plasmon hybridization for (b) antibonding mode at R=1, (c) hexapolar antibonding at R=1.29, and (d) second-order hexapolar antibonding mode at R=1.29.
in fig. 3.19. At R=1, the dipole mode of nanodisc couples with the cavity mode. As the gold nanoring is elongated, the second-order dipole mode or the quadruple mode couples with cavity mode, which results in the hexapolar antibonding mode and second-order hexapolar antibonding mode.
40
Fig. 3.19: (a) Extinction spectra of antibonding modes for simulation and experiment under transverse polarization. Mode profile of plasmon hybridization in (b) antibonding mode at R=1, (C) dipolar antibonding at R=1.29, and (d) quadrupolar antibonding at R=1.29.
3.6 Electric Field Enhancement
The near field is enhanced within the region nearby the surface of plasmonic nanostructure. However, the enhanced electric field can be tuned by the parameters, as shape, aspect ratio and other geometry factors. For recently studies, the field intensity enhancement of spheroid nanoshell is studied by tuning the aspect ratio [11]. The electric field intensity of spheroid nanoshell at aspect ratio R = 4 is enhanced around 400 fold relative to that of the ambient field. For our study, electric field enhancement is calculated for elliptical gold nanodisc and nanoring with different aspect ratios. The field intensity enhancement is defined as the field at monitor (EO) divided by the
ambient field (EI). We select one monitor for and two monitors for elliptical gold
nanodisc and nanoring. Under longitudinal polarization, the electric field intensity is increased as the aspect ratio is increased in elliptical gold nanodisc and nanoring.
41
Fig. 3.20: A two dimensional spatial profile of the electric field intensity for elliptical gold (a) nanodisc and (b) nanoring with varied aspect ratio under longitudinal polarization. (c) The field intensity enhancement (EO/EI) as the function of aspect
ratio for elliptical gold nanodisc and nanoring under longitudinal polarization.
The maximum field intensity enhancement under longitudinal polarization is up to 13.5 and 14.2 at R = 1.58 for elliptical gold nanodisc and nanoring respectively, as shown in Fig. 3.20. Furthermore, the field intensity enhancement of elliptical gold nanoring under longitudinal polarization is higher than that of elliptical gold nanodisc
42
Fig. 3.21: A two dimensional spatial profile of the electric field intensity for elliptical gold (a) nanodisc and (b) nanoring with varied aspect ratio under transverse polarization. (c) The field intensity enhancement (EO/EI) as the function of aspect
ratio for elliptical gold nanodisc and nanoring under transverse polarization. due to coupling between the inner and outer surface plasmons. For disc-like optical properties, the field intensity enhancement at outer surface of elliptical gold nanoring is near that of elliptical gold nanodisc at large aspect ratio.
Under transverse polarization, the monitor at the inner surface of elliptical gold nanoring is studied for electric field intensity of the transverse bonding mode. The electric field intensity is increased as the aspect ratio is increased in elliptical gold
43
nanoring due to the strong cavity mode induced by enlarging the region of hole inside the elliptical gold nanoring. However, the electric field intensity is decreased as the aspect ratio is increased in elliptical gold nanodisc, as shown in Fig. 3.21. This factor results in the different sensing performance which is discussed in chapter 4.
3.7 Summary
We simulated the optical properties of elongated nanostructure including elliptical gold nanoring, nanodisc and nanohole. The aspect ratio dependent optical properties were investigated under longitudinal and transverse polarizations. Interestingly, the optical property of elliptical gold nanoring is disc-like or cavity-like at different condition, including polarization, aspect ratio and energy level. The shift trend of resonance wavelength shows red shift as the nanostructure is elongated in both longitudinal and transverse polarizations. It can be explained by plasmon hybridization as the interaction of disc and cavity mode. In addition, the mode profile with vector field is studied for understanding plasmon hybridization in elliptical gold nanoring. The induced longitudinal second-order hexapolar antibonding mode and transverse quadrupolar antibonding mode are attributed to the interaction of high order disc mode and cavity mode since R=1.29 aspect ratio. Furthermore, the electric field intensity enhancement is calculated for elliptical gold nanodisc and nanoring. The results show that the field intensity enhancement of elliptical gold nanoring is increased under both longitudinal and transverse polarizations. In addition, bonding mode is stronger than dipole mode due to the coupling between the inner and outer surface plasmons.
44
Chapter 4 Index Sensing Properties of Elliptical
Gold Nanoring
4.1 Introduction
In this chapter, we simulated the optical sensing performance by changing the environmental refractive index of the elliptical gold nanostructure. Both the sensitivity and figure of merit (FOM) are discussed, including elliptical gold nanodisc and nanoring. In addition, the experiment has been done to confirm the simulation result by immersing the samples into different environments.
4.2 Index Sensing Performance of Elliptical Gold Nanoring
There is a red shift in the plasmon resonance wavelength of metallic nanoparticles [30][31] as the medium refractive index is increased since the Coulombic restoring force acting on the polarized charges is reduced in the higher refractive index medium [22]. The refractive index sensitivity of a particular nanoparticle is usually reported in nanometers of peak shift per refractive index unit (nm/RIU). Fig. 4.1 shows a plot of the simulated dipole mode wavelength of elliptical nanodisk as a function of the refractive index of surrounding medium. When the aspect ratio is increased from 1 to 1.58, the sensitivity of elliptical gold nanodisc under longitudinal polarization is varied from 396 to 313 nm/RIU due to the ITO-substrate effect, which will be discussed in 4.3 section. The sensitivity of elliptical gold nanodisc under transverse polarization is around 390 nm/RIU because the strength of plasmon interaction for transverse mode is weakly dependent on the geometry of shape.
45
For elliptical gold nanoring, the simulated bonding mode wavelength as a function of the medium refractive index is shown in Fig. 4.2. As the aspect ratio is
Figure 4.1: Simulated peak wavelength of dipole mode for elliptical gold nanodisc as a function of the refractive index of surrounding medium with different aspect ratios under (a) longitudinal and (b) transverse polarizations.
increased from 1 to 1.58, the sensitivity of longitudinal bonding mode of elliptical gold nanoring is varied from 440 to 307 nm/RIU which is smaller than that of transverse bonding mode of elliptical gold nanoring. The sensitivity of transverse bonding mode is increased from 444 to 524 nm/RIU as the aspect ratio is changed
46
from 1 to 1.58. This increased sensitivity of transverse bonding mode can be attributed to the cavity-like optical properties of elliptical gold nanoring under
Figure 4.2: Simulated peak wavelength of bonding mode for elliptical gold nanoring as a function of the refractive index of surrounding medium with different aspect ratios under (a) longitudinal and (b) transverse polarizations.
transverse polarization.
Furthermore, the sensitivity of elliptical gold nanodisc and nanoring with varied aspect ratio are compared under longitudinal and transverse polarizations, as shown in
47
Figure 4.3: The simulated sensitivities of the dipole mode for elliptical gold nanodisc and the bonding mode for elliptical gold nanoring with different aspect ratios under (a) longitudinal and (b) transverse polariztions.
Table 4-1: Total energy density in different surrounding mediums for elliptical gold nanoring under longitudinal and transverse polarizations. (e-30J unit)
48
ITO-substrate effect which is enhanced at high aspect ratio [32]. In addition, the difference of sensitivity between elliptical gold nanodisc and nanoring is decreased because the disc-like optical properties of elliptical gold nanoring under longitudinal polarization is similar as the optical behavior of elliptical gold nanodisc as the aspect ratio is increased. For transverse polarization, the index sensitivities of elliptical gold nanodisc and nanoring show an inverse trend when the aspect ratio is increased from 1 to 1.58. The sensitivity of elliptical gold nanoring under transverse polarization is increased due to cavity-like optical properties when the aspect ratio varies from 1 to 1.58. So the difference between cavity-like plasmonic behavior of elliptical gold nanoring and dipolar plasmonic behavior of elliptical gold nanodisc leads the inverse wavelength-shift trend, which are blue and red shift for elliptcial gold nanodisc and nanoring respectively. However the ITO-substrate effect still exists but does not change the optical properties so much under transverse polarization.
Furthermore, we calculated the total energy densities of elliptical gold nanoring at R = 1 and R = 1.58 in different surrounding medium as n = 1, 1.3, 1.33, 1.36, and 1.39 under both longitudinal and transverse polarizations, as shown table 4-1. It shows that the total energy density change ∆P = 5.74 (e-30J) of elliptical gold nanoring at R=1.58 is lower than that ∆P = 6 (e-30J) of gold nanoring at R=1 from n = 1 to n = 1.39 under longitudinal polarization. For Transverse polarization, the total energy density change ∆P = 6.64 (e-30J) of elliptical gold nanoring at R = 1.58 is higher than that ∆P = 6 (e-30J) of gold nanoring at R=1 from n = 1 to n = 1.39. The total energy density change presents the ability of sensing performance of plasmonic mode. So the sensitivity of longitudinal bonding mode at R = 1.58 is lower than that of R = 1 and the sensitivity of transverse bonding mode at R = 1.58 is higher than that of R = 1. The FOM of elliptical gold nanoring was studied with considering the bandwidth in sensing performance, as shown in Fig. 4.4. The FOM of transverse bonding mode
![Figure 1.3: Illustrations of (a) LSPR in the metallic nanosphere and (b) the metallic nanosphere is surrounded by the constant electric field [8]](https://thumb-ap.123doks.com/thumbv2/9libinfo/8544666.187862/16.892.140.764.106.798/illustrations-metallic-nanosphere-metallic-nanosphere-surrounded-constant-electric.webp)
![Table 1-1 Sizes, plasmon wavelengths, and index sensitivity of various au nanoparticles [23].](https://thumb-ap.123doks.com/thumbv2/9libinfo/8544666.187862/23.892.137.758.450.637/table-sizes-plasmon-wavelengths-index-sensitivity-various-nanoparticles.webp)
![Figure 1.11: The dose response curve for streptavidin detection with biotin-functionalized gold nanorods in (a) PBS and (b) serum [20]](https://thumb-ap.123doks.com/thumbv2/9libinfo/8544666.187862/24.892.137.748.307.732/figure-response-curve-streptavidin-detection-biotin-functionalized-nanorods.webp)


![[2015-Fall] WNFA lab1 - CamCom](data:image/gif;base64,R0lGODlhAQABAIAAAP///wAAACH5BAEAAAAALAAAAAABAAEAAAICRAEAOw==)