國
立
交
通
大
學
資訊管理研究所
碩
士
論
文
工作負載分享之協同運算系統:
於數位浮水印濾波器評估之演算法分析的研究
A collaborated computing system for load sharing: a study for
the algorithm analysis in the digital watermark filter evaluation
研 究 生:楊千毓
指導教授:蔡銘箴 博士
工作負載分享之協同運算系統:
於數位浮水印濾波器評估之演算法分析的研究
A collaborated computing system for load sharing: a study for
the algorithm analysis in the digital watermark filter evaluation
研 究 生:楊千毓 Student:Chien-Yu Yang
指導教授:蔡銘箴 Advisor:Min-Jen Tsai
國 立 交 通 大 學
資訊管理研究所
碩 士 論 文
A ThesisSubmitted to Institute of Information Management College of Management
National Chiao Tung University in Partial Fulfillment of the Requirements
for the Degree of
Master of Business Administration in
Information Management June 2004
Hsinchu, Taiwan, the Republic of China
工作負載分享之協同運算系統:
於數位浮水印濾波器評估之演算法分析的研究
學生:楊千毓 指導老師:蔡銘箴
國立交通大學
資訊管理研究所
摘要
由於資源分享的能力,點對點通訊已經獲取人們的注意。這些可以被分享的 資源有資訊和檔案的交換、執行程序週期、快取記憶空間和硬碟記憶容量。除此 之外,點對點系統可以容易且低成本的開發。因此,傳統的主從式架構漸漸地被 點對點系統所取代。 本論文所提出的工作負載分享之協同運算系統係利用點對點系統可以分享 資源的優點。此協同運算系統是採用 Java Servlet 來完成實作,因此,點對點系 統在安全、動機、實行效能和相容性等方面的缺點也可以被此協同運算系統所克 服。透過這個系統,一個擁有繁複計算工作可以更快速且更有效率地被完成。 在本論文中,此協同運算系統應用在分析數位浮水印小波轉換濾波器選擇的 方式來探討其強健性。根據浮水印分析範例的結果,此協同運算系統可以利用增 加的速率、執行效能、運算時間和所花費的時間等觀點來衡量它的執行成果。A Collaborated Computing System for Load Sharing:
A Study for the Algorithm Analysis in the Digital Watermark
Filter Evaluation
Student: Chien-Yu Yang Advisor: Min-Jen Tsai
Institute of Information Management
National Chiao-Tung University
Abstract
Peer-to-Peer (P2P) communication has attracted peoples’ attention due to its resource sharing capabilities, such as the exchanging of information and content files and sharing processing cycles, cache space, and disk storage. Moreover, P2P system can be easily implemented with low cost. Therefore, the traditional client/server architecture has been gradually replaced by P2P structure.
The collaborated computing system for load sharing takes the advantages of P2P system. Furthermore, the disadvantages in P2P system, security, awareness, performance efficiency, and compatibility, have been conquered by the collaborated computing system by implementing the system using Java Servlet. Through this mechanism, a large computing task can be completed with improved efficiency. In this thesis, the collaborated computing system was utilized based on the case of analyzing the robustness of digital watermark by filter bank selection. As the result of this case, the performance can be improved in the aspect of speedup, efficiency, process time and reliability.
Acknowledgements
在交大資管所求學的期間,非常感謝蔡銘箴老師的諄諄教誨與悉心指導,使 我學習到報告的技巧、資訊的搜尋方法和獨立研究的嚴謹態度等,讓我的論文能 夠順利的完成。除此之外,在口試期間,感謝李素瑛老師、劉敦仁老師和許秋婷 老師對於論文的建議與指正,使得我的論文內容更加豐富。 兩年的碩士生涯很快的就要告一段落了,在這段時間內,認識了許許多多的 人,學長姐、同學、學弟們,大家一起體驗生活,一起笑鬧,一起完成了許多事 情,無論是在學業上,在工作上,還是在課外活動上,都留下了最美麗的回憶。 在此特別感謝實驗室成員王振生學長、秋雅、筱盈、瓊茹、博宇、承龍、冠 輝,對於論文上的建議以及精神上的支持。最後,感謝我的家人,由於你們的支 持,讓我無後顧之憂的完成學業。Contents
摘要... iii Abstract ...iv Acknowledgements...v Contents ...vi List of Tables...viiList of Figures ... viii
1 Introduction...1
1.1 Motivation of Research...1
1.2 Problem Definition...2
1.3 Organization of the Thesis ...2
2 Distributed computing models...4
2.1 Introduction...4
2.2 Peer-to-Peer Systems ...4
2.3 Grid computing ...9
2.4 Summary ... 11
3 Power Server Model ...13
3.1 Introduction...13
3.2 Power Server Model Architecture ...14
3.3 Performance of Power Server Model...15
3.4 Summary ...16
4 Wavelet-Based Watermarking...18
4.1 Introduction...18
4.2 Wavelet-Based Watermarking...19
4.3 The analysis of digital watermark using filter bank selection ...22
4.4 Summary ...25
5 Experimentation...26
5.1Configuration of the experimental system...26
5.2 System Architecture ...27
5.2.1 Client specification ...29
5.2.2 Server specification...31
5.2.3 Coordinator specification...33
5.2.4 The algorithm of job dispatch ...34
5.3 Formula Estimation...36
5.4 Experimental result ...37
6 Discussion ...41
List of Tables
Table 2. 1. The comparison two P2P file Sharing Architecture (Lui and Kwok, 2002) ...7
List of Figures
Figure 2. 1. An example of pure P2P architecture. (Lui and Kwok, 2002) ...6
Figure 2. 2. An example of server-mediated P2P architecture. (Lui and Kwok, 2002) ...6
Figure 2. 3. Structure of SETI@home (Anderson et al., 2002) ...8
Figure 3. 1. Power server model with coordinator. (Loo, 2003)...14
Figure 4. 1. The decomposition structure. ...20
Figure 4. 2. The pyramid of DWT based watermark. ...20
Figure 4. 3. An example of decomposition using DWT. ...21
Figure 4. 4. The reconstruction structure. ...21
Figure 4. 5. Embedding and detecting processes. (Wang, Doherty and Dyck, 2002) ...23
Figure 5. 1. Structure of collaborated computing system. ...28
Figure 5. 2. An example of the control panel in client side. ...30
Figure 5. 3. An example of the trigger. ...32
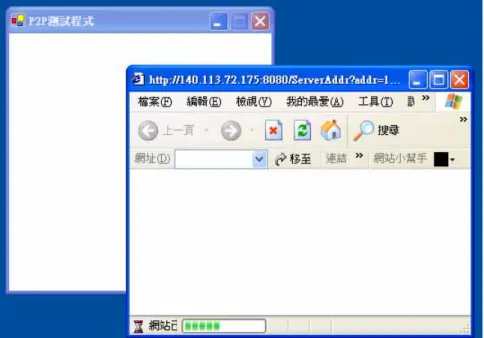
Figure 5. 4. An example of screen shot of server...32
Figure 5. 5. The flow sheet of job dispatching. ...35
Figure 5. 6. The flow sheet of receiving the sub-results. ...35
Figure 5. 7. Speedup against the number of processors from 5 to 40...36
Figure 5. 8. Efficiency against the number of processors from 5 to 40. ...37
Figure 5. 9. The process time...38
Figure 5. 10. The process time of one sub-task in a server. ...39
Figure 5. 11. The time consumption in the collaborated computing system. ...40
1 Introduction
1.1 Motivation of Research
This research is motivated by the idea of trying to reduce the time consumption in digital watermark analysis using filter bank selection. The total time consumption in analysis in Pentium III 737 MHz PC with 256 RAM is 47 hours and 19 minutes. The more filters it receives for analysis, the more time it requires for calculation. Hence, a useful peer-to-peer system for reducing the time consumption is required.
Frequently, there are many computers with idle status in an enterprise or a laboratory, especially at night. In order to utilize those computers effectively, peer-to-peer with CPU power sharing architecture and Grid computing will be the desirable choices. In this thesis, we will focus on the peer-to-peer system.
This peer-to-peer system can be applied to a small-scale project which is hold by an enterprise or a laboratory. Therefore, it must be developed quickly and maintained in low cost with no obstacle. In addition, the performance of this peer-to-peer system must be acceptable.
In the conditions above, the proposed peer-to-peer system in this thesis is called the collaborated computing system. The aim of the collaborated computing system is to disperse the job loading. In order to examine the performance of the collaborated computing system, the analysis case, which is analyzing digital watermark using filter bank selection, will be the objective for calculating. This case will be briefly introduced in Chapter 4.
1.2 Problem Definition
A solution for load sharing in a company or a laboratory is required. This solution must be implemented cheaply and maintained with low cost. We are looking forward to finding a solution which can ease the job load and time consuming in one computer with no awareness by users. The proposed solution is called the collaborated computing system, which means computers devote their process time to solve one problem together.
1.3 Organization of the Thesis
In order to propose a collaborated computing system for load sharing, this thesis has been organized into seven parts. These parts are summarized below.
Chapter 1: Introduction
This chapter will introduce the motivation of the research and the problem definition. One example will be given for applying to the collaborated computing system. This example will be presented in details in Chapter 4.
Chapter 2: Distributed computing models
This chapter will have brief introduction on examples of different types of distributed computing models. The comparison of distributed computing models will be given as well.
Chapter 3: Power Server Model
this chapter. By using this model, some weaknesses in peer-to-peer system will be improved.
Chapter 4: Wavelet-Based Watermarking
In this chapter, the wavelet-based watermarking algorithm will be presented in short. The objective of analysis in the collaborated computing system will be presented.
Chapter 5: Experimentation
The main point of this chapter is to explain the collaborated computing system and experimental result.
Chapter 6: Discussion
The discussion will be brought up.
Chapter 7: Future Work
Some future work will be proposed here. After those work done, hopefully, this solution will be better.
2 Distributed computing models
2.1 Introduction
In the past, conventional information systems were developed by mainframe approach. However, processing in the mainframe approach has a bottleneck, which is that enterprises are forced to keep pumping money to upgrade the system in order to maintain efficiency. Therefore, the client/server architecture and Distributed computing models are proposed for solving this bottleneck.
In client/server model, a server is a computer which provides services to clients which request those services. For instance, a client may request a database server to retrieve a record. Through shifting the workload to the client computers, the client/server model can improve overall efficiency and reduce the budget for computing resources. (Loo, 2003)
The distributed computing model is another option to solve this bottleneck. Two distributed computing models, peer-to-peer computing (P2P) and Grid computing, will be introduced.
2.2 Peer-to-Peer Systems
P2P computing is defined as the sharing of computer resource and services which include the exchange of information and content files, processing cycles, cache storage, and disk storage for data files (Lui and Kwok, 2002). Through sharing he computation load and the computing power by the existing desktop and networking connectivity allows economic clients to leverage their collective powers and benefit
the entire community.
Comparing the client/server architecture to the P2P architecture, the latter one provides better performance in processing and resource sharing and less expensive. Due to this advantage, in the past few years, P2P has attracted enormous media attention and gained popularity by supporting two main classes of applications (Talia and Trunfio, 2003, July/August):
z P2P file sharing architecture, in which peers share files with each other, for instance, Freenet, Gnutella, and Napster (2004, June).
z CPU power sharing architecture, in which peers share computing power with others, for instance, SETI@home (Anderson, Cobb, Korpela, Lebofsky and Werthimer, 2002) and FightAIDS@home (2004, June).
P2P file sharing architecture can be divided into two parts, which are Pure P2P and Server-Mediated P2P. The difference between pure P2P and server-mediated P2P is that the later one has a central server, which is responsible to maintain a registry of the shared information and to respond to queries for those information. In both models, peers are responsible to provide contents and download contents.
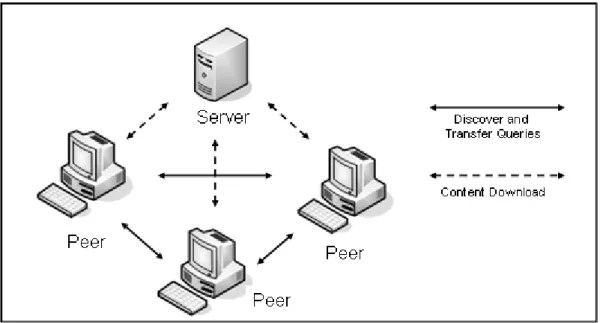
As mentioned before, the Pure P2P has no central server as shown in Figure 2.1. In this model, peers discover other peers and interact with each of them by themselves through sending and receiving digital messages. There is one flaw in the pure P2P model which is that just a few peers can be found.
Figure 2. 1. An example of pure P2P architecture. (Lui and Kwok, 2002)
Figure 2. 2. An example of server-mediated P2P architecture. (Lui and Kwok, 2002)
The server-mediated P2P improves the flaw of the pure P2P architecture by using a central server as shown in Figure 2.2. This server-mediated P2P architecture utilizes a central server to discovering peers and contents on the network. When a peer searches for some particular content, it is required to follow three steps. First, it queries the central server and receives the informant regarding who possesses the particular content. Second, it establishes the connection with the peer. Finally, it
starts downloading the content from the peer.
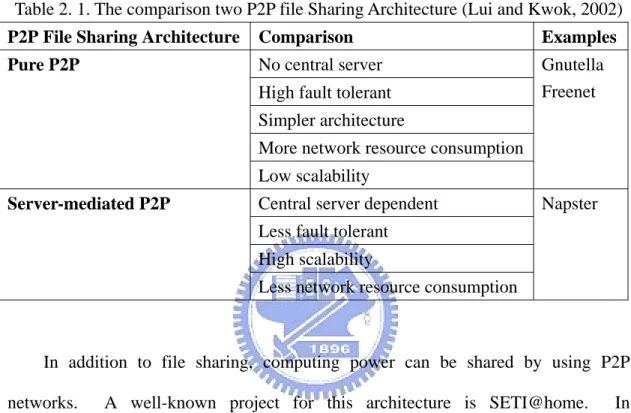
In brief, table 2.1 illustrates the comparison of pure P2P architecture and server-mediated P2P architecture.
Table 2. 1. The comparison two P2P file Sharing Architecture (Lui and Kwok, 2002)
P2P File Sharing Architecture Comparison Examples
No central server High fault tolerant Simpler architecture
More network resource consumption Pure P2P
Low scalability
Gnutella Freenet
Central server dependent Less fault tolerant High scalability Server-mediated P2P
Less network resource consumption
Napster
In addition to file sharing, computing power can be shared by using P2P networks. A well-known project for this architecture is SETI@home. In SETI@home project, each user downloads a small program to his/her computer from the Internet. While the computer becomes idle, the program executes and runs as a screensaver. Through this project, Millions of computers contribute their CPU power in searching the Extraterrestrial intelligence.
The design of SETI@home’s computational model is simple. The signal data is divided into fixed-size work units distributed via the Internet to a client program running on numerous computers. The client program computes received unit, which is a set of candidate signals, returns the result to the server, and receives another work unit. There is no communication between clients (Anderson et al., 2002).
Figure 2. 3. Structure of SETI@home (Anderson et al., 2002)
The structure of SETI@home is shown in Figure 2.3. Although this project has successfully brought millions PC owners to participate, it still has weaknesses and problems (Loo, 2003), which are also the weaknesses of all the projects that uses CPU power sharing architecture. Those four identified weaknesses are described below: z Security: participants must fully trust the research organization which holds the
project.
z Motivation: participants must be interested in the project.
z Performance efficiency: project must be easily updated and maintained by the participants.
z Compatibility: the small programs, which can be downloaded by participants from the web, must be executed as screensaver on any kinds of computers and platforms. (SETI@home has solved this weakness by using different versions to different platforms.)
2.3 Grid computing
According to IBM’s definition (Zhang, Chung and Zhou, October 1, 2002), “a Grid is a collection of distributed computing resources available over a local or wide area network. Together, these resources appear to an end user or application as a single, secure, coordinated virtual computing system. Grid computing is the ultimate vision in distributed computing, spanning locations, organizations, hardware and software boundaries to provide tremendous power, collaboration and information to everyone connected to the Grid.”
Comparing to P2P and Grid, both are for sharing of varied resources, ranging from programs, files, and computation capabilities to computers, sensors, and networks. The differences are discussed in the aspects of security, connectivity, access services, resource discovery, and presence management. (Talia and Trunfio, 2003, July/August)
z Security: in Grid computing, security is an important issue. It integrates the relevant mechanisms such as authentication, authorization, integrity, and confidentiality. Conversely, P2P systems generally do not address authentication and content validation. In other words, both handle security in different ways.
z Connectivity: due to the different security mechanisms between Grid and P2P, the number of accessible nodes in a Grid is generally lower then in a P2P network.
z Access services: Grid toolkits prevent mechanisms from submitting batch jobs or executing interactive applications on remote machines and for sharing and moving data across notes. In contrast, current P2P systems do not support mechanisms for explicitly allocation remote cycles and storage. Otherwise, the
topics of projects must be very interesting for attracting people to participant in P2P systems.
z Resource discovery and presence management: resource discover in grid environments is based mainly on centralized or hierarchical modes, which are inefficient in finding other resource. Furthermore, the presence management is not yet defined in Grid. On the contrary, in P2P systems, each node periodically notifies the network of its presence, discovering its neighbors at the some time.
Grid computing can be seen as an answer to drawbacks such as overloading, failure, and low QoS (Quality of Service), which are inherent to centralized service provisioning in client/server systems. Such problems can occur in the context of high-performance computing, for instance, when a large set of remote users accesses a supercomputer. (Talia and Trunfio, 2003, July/August)
In recently research, Foster, Kesselman and Tuecke (2001) gave further explanation of Grid computing. Grid computing is a process of coordinated resource sharing and problem solving in dynamic, multi-institutional virtual organizations. The resource sharing is concerning not only file exchange but also directing access to the computers, software, data, and other resources. Virtual organizations are considered as sharing rules defined by a set of individuals and/or institutions.
In order to interact among resources being shared across virtual organizations with less centralized control, a standard named Open Grid Server Architecture (OGSA) is required. The base component of this architecture is the Open Grid Service Infrastructure (OGSI). This is a Grid software infrastructure standardization effort
based on the emerging Web service standard, which is Web service description language (WSDL), to provide maximum interoperability among OGSA software components. (Joseph, April 7, 2003) Web service and OGSA both seek to enable interoperability between loosely coupled services, independent of implementation, location, or platform.
No matter how the Grid computing develops, it provides a framework and deployment platform that enables resource sharing, accessing, aggregation and management in a distributed computing environment.
2.4 Summary
Two distributed computing models have been introduced in short. They are P2P systems and Grid computing. P2P can be distinguished into two categories, file sharing P2P and CPU power sharing P2P, by the kinds of resources being shared. Those resources include information and content files, processing cycles, cache storage, and disk storage for data files. Grid computing is a geographically distributed computation platform comprising a set of heterogeneous machines that users can access through a single interface.
The main functionality of Grid computing is similar to P2P. Nonetheless, there are many differences between them. The differences can be analyzed by in terms of security, connectivity, access services, and resource discovery and presence management.
performing huge and repeated calculation. With this objective in mind, we thus take advantage of P2P technique, especially, CPU power sharing architecture. Through CPU power sharing, thousands of computers can devote their processing time in calculating a difficult and complicated task.
In chapter 3, we will introduce the power server model which has been proposed by Alfred W. Loo. This model uses Java Servlet to practice the CPU power sharing architecture, in order to solve the weaknesses and problems started earlier.
3 Power Server Model
3.1 Introduction
According to Loo (2003), the CPU power sharing architecture has some weaknesses and problems on the issues of security, motivation, performance efficiency, and compatibility. The author also provides a solution, which is called power server model.
This model is implemented by Java Servlet, which means it has the same advantages as Java, such as portability, extensibility, flexibility, security, and so forth. Due to the advantages of Java Servlet, it can improve the performance efficiency and compatibility in the CPU power sharing architecture.
In this model, there are three roles involved, client, servers, and coordinator. In the first processing stage, client is responsible for job dispatching, because it is the one who requires process time from others, which are servers. After receiving request from the client, servers are ready to share their process time with client. Servers are also notified to receive the sub-tasks from client, to calculate the results and to send results back to the client. To make the collaborated works more efficient, the role of coordinator is responsible to find the available servers on the Internet.
A detailed description of the power server model will be discussed in the next section.
3.2 Power Server Model Architecture
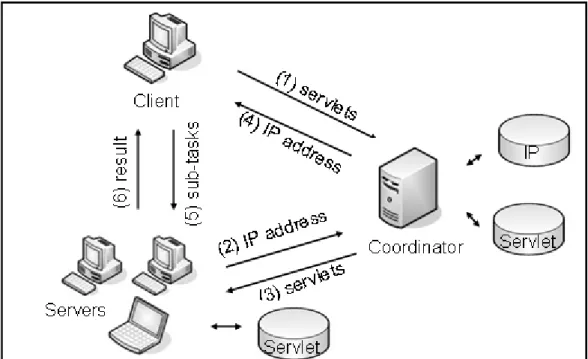
In traditional client/server system, servers usually process data for the client. In power server model, power servers are that those computers serve CPU power to other users. (Loo, 2003) Power server is abbreviated to server in this thesis. Figure 3.1 demonstrates how this model works.
Figure 3. 1.Power server model with coordinator. (Loo, 2003)
The working steps are as below:
z Step 1: client stores the Servlets on the coordinator. Those Servlets help servers to receive sub- tasks, count out the results, and send the results back.
z Step 2: while server is idle, it sends its’ IP address and other information to the coordinator. Therefore, the coordinator is able to find available server on the Internet.
z Step 3: the coordinator sends the Servlets to the available server.
z Step 4: the coordinator conveys the IP address and other information to the client. By this way, client realizes which server it can assign the sub-task to.
z Step 5: the client dispatches the sub-task to the server.
z Step 6: after computation completion, this server delivers the result back to the client.
However, this model has one problem which is the Servlets must be executed in a Servlet container (Servlet runner). In order to execute properly, each sever and coordinator must be installed with a Servlet container, such as Tomcat Server, iPlanet Web Server EnterPrise Edition, WebSite Professional, and so on.
One of the Servlet containers mentioned above is a freeware, which is the Apache’s Tomcat Server. Therefore, the situation becomes easier for this study since we can use the server software without further cost. Servers who choose to join the project, which is developed by the power server model, only need to install the freeware. Hence, the project will run with no difficulty, since the Servlet container is no longer a problem.
The experiment of performance of the power server model will be discussed in the next chapter. It will give more detailed information about how to measure the performance of the power server model.
3.3 Performance of Power Server Model
Loo, Bloor, and Choi (2000) suggests there are two common factors, which are speedup and efficiency, can be used for measurement of a P2P system.
sequential operations in a parallel algorithm can significantly limit the speedup, which is defined as the ratio of the time required to complet the process with the fastest serial algorithm using one processor, to the time required to the completion of the same process with the parallel algorithm using p processors (Loo et al., 2000). If f is the fraction of operations in a process and p is the maximum speedup achieved by a computer with p processors, they are related by the following formula:
p f f speedup / ) 1 ( 1 − + ≤ (1)
Efficiency is proposed as a measure of the fraction of time for which processors are usefully employed (Loo et al., 2000). If p is the number of processors, it are related the following formula.
p speedup
Efficiency= (2)
Base on these two factors, the performance will be examined.
3.4 Summary
Three main characters in the power server model are client, servers, and coordinator. They all have their responsibilities. Client works for sub-task arrangement. Servers are responsible for computing. Coordinator is in charge of registration of servers, maintaining the information of servers, finding suitable servers and passing their IP address, and transferring Servlets to the power servers.
performance efficiency, and compatibility problems in the power sharing P2P architecture. In addition, the power server model can be accomplished and maintained easily. Furthermore, it is an inexpensive way to develop a P2P system. Therefore, the power server model is been chosen to deal with the power sharing problem.
In this thesis, we will use power server model to reduce the time consumption in computing the huge and repeated task. Before going into the experimentation, the objective for computing must be defined. The details will be given in the next Chapter.
4 Wavelet-Based Watermarking
4.1 Introduction
Owing to the rapid development of Internet, digital properties have been spread effortlessly with no authorization. In other words, the intellectual property rights are invaded. This subject deserves more than a passing notice. In order to prove the ownership of digital properties, the digital watermarking technique was proposed. Two kind of digital watermark techniques were commonly used, discrete cosin transform (DCT) based watermark and discrete wavelet transform (DWT) based watermark.
In brief, Cox, Kilian, Leighton and Shamoon (1997) mentioned three factors for determining an effective digital watermark, robustness, universality, and unambiguousness. Robustness refers that the watermark should be able to against a variety of possible attacks by pirates. These include robustness against compression such as JPEG, scaling and aspect ratio changes, rotation, cropping, row and column removal, addition of noise, and etc. Universality means that the same digital watermarking algorithm should be applied to all three media, image, audio, and video, under consideration. Unambiguousness indicates that the retrieval of the watermark should be unambiguously identified by the owner.
Comparing DCT based watermark to DWT based watermark, the DCT based watermark is relatively vulnerable to the watermarking attacks such as geometric variations (i.e., rotation and translation etc.). In other words, the robustness is relatively low. In this thesis, we will devote all attention in DWT based watermark.
4.2 Wavelet-Based Watermarking
DWT based watermark depends on filters to protect the right of a digital image. Filters are used to embed and extract information for identification such as a logo, a number of sequences, or a text message. The DWT based watermarking algorithm, which was proposed by Wang, Doherty and Dyck (2002), is briefly introduced bellow:
z Filter selection
DWT based watermark makes use of filters to filtrate and construct the signals of a digital image. Among filters, analysis filters are used for distinguishing between the low frequency signals and the high frequency signals in a digital image; synthesis filters are used for constructing image based on the low frequency signals and the high frequency signals. Those filters are selected by the following formulas:
h0(-z)g0(z) + h1(-z)g1(z) = 0 (3) h0(z)g0(z) + h1(z)g1(z) = 2 (4)
For the definition of formula 3 and 4, h0, which is the low pass filter, and h1, which is the high pass filter, both are analysis filters; the functionalities of g0 and g1 are the same as h0 and h1, but they are synthesis filters; and z means the Z domain.
z Decomposition
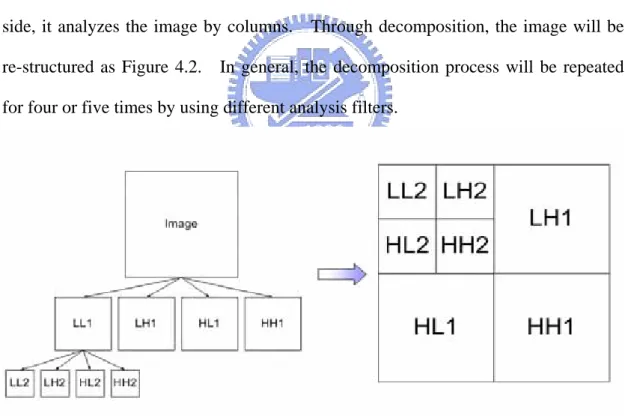
The Decomposition structure is as shown in Figure 4.1. After the signals of a digital image with size of m by n pass through the two filters, ho and h1, the low and high frequency will be distinguished. Hence, the size of two frequency must do down size for keeping the size in m by n.
Figure 4. 1. The decomposition structure.
In Figure 4.1, on the left side, it analyzes the image by rows; and on the right side, it analyzes the image by columns. Through decomposition, the image will be re-structured as Figure 4.2. In general, the decomposition process will be repeated for four or five times by using different analysis filters.
Figure 4. 2. The pyramid of DWT based watermark.
z Embedding
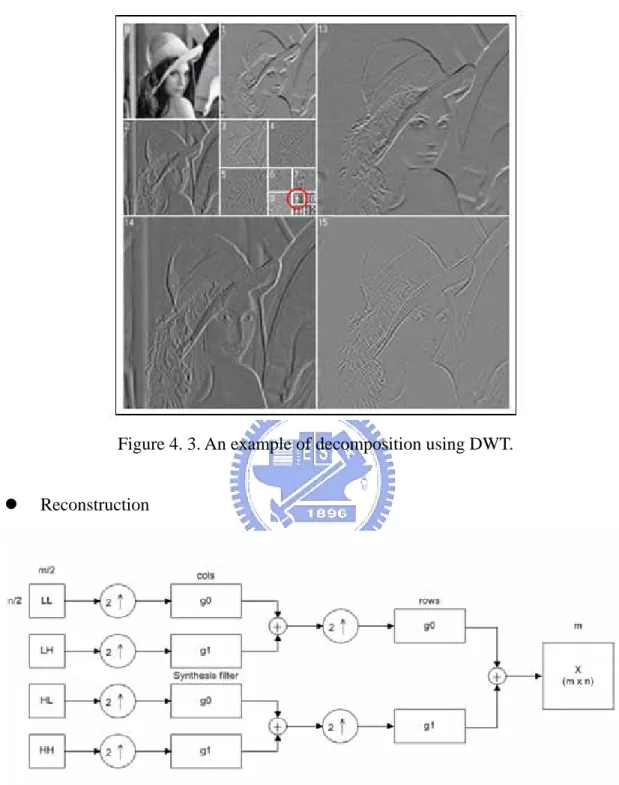
As mentioned above, the confidential information can be concealed into the image after decomposition. In Figure 4.3, it is an example of decomposition of Lena
image using DWT. The watermark was embedded in the band 9.
Figure 4. 3. An example of decomposition using DWT.
z Reconstruction
Figure 4. 4. The reconstruction structure.
Utilizing the synthesis filters, the m by n image will be reconstructed. The steps of reconstruction are as shown in Figure 4.4. The synthesis filters are g0 and
g1. For the same reason as the decomposition, the frequency must be up size before
be acquired. z Detection
Based on the research, for instance, Cox et al. (1997), the similarity function is adopted as the judging criteria for the DWT based watermarking techniques. The similarity function is called correlation in this thesis. Using decomposing process, the embedded watermark can be found. Through the comparison of the original watermark and the embedded watermark, the correlation indicates the authority of the digital image.
The whole DWT based digital watermark algorithm includes decomposition, embedded, reconstruction, and detection. By using this algorithm, digital properties can be well protected. The ownership of digital properties can be maintained.
4.3 The analysis of digital watermark using filter bank selection
DWT based watermarking technique makes excellent use of filters for embedding the digital watermark. Moreover, the definition of an effective digital watermark is given in Chapter 4.1 above, where the digital watermark must fulfill in three conditions, robustness, universality, and unambiguousness. In order to further verify the robustness of digital watermark, Tseng (2003) referred a method which is described below.
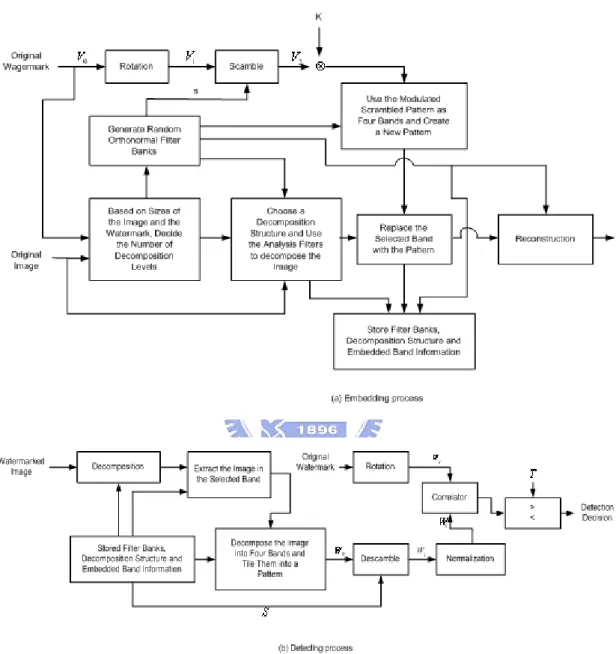
This method is using a number of filter banks to decompose and reconstruct a digital image. The algorithm of this method is the same as the algorithm of DWT based watermarking techniques. However, the whole embedded and detecting
processes will be repeated over and over by using different analysis filters and synthesis filters which are stored in filter banks. The embedding and detecting processes are shown in Figure 4.5.
Figure 4. 5. Embedding and detecting processes. (Wang, Doherty and Dyck, 2002)
As mentioned before, through similarity function, which is comparing the original watermark and the extracted watermark, the tempered image will be detected.
first correlation is the similarity between the original watermark and the embedded watermark, which is extracted from a non-tempered digital image. The second correlation is the similarity between the original watermark and the embedded watermark, which is extracted from a tempered digital image.
Based on the first correlation between the original watermark and the embedded watermark extracting from a non-tempered digital image, the difference of both watermarks will be indicated. If the correlation passes the threshold, for example, 0.9, it means both watermarks are considered as the same one. On the other hand, if the correlation is lower than the threshold, then both watermarks are considered as different.
According to the second correlation between the original watermark and the embedded watermark, which is extract from the modified image by JPEG 2000, the difference of both watermarks will be indicated. If the correlation passes the threshold, as low as 0.4, it means both watermarks are considered as the same one. If the correlation does not pass the threshold, it means both watermarks are considered as different.
As the result of this method, the robustness of watermark is examined later in the thesis. However, if using several thousands of filters in analyzing the robustness, it takes a long time to finish the task. Therefore, it is an ideal example for applying to the collaborated computing system.
4.4 Summary
In summary, DWT based watermark is one of the digital watermarking techniques. Using three factors, robustness, universality, and unambiguousness, measures the efficientness of digital watermark. One solution was provided to examine the robustness which is given in Chapter 4.3 and is called filter bank selection which can be referred in Tseng (2003).
In this solution, the correlation program, which is mentioned above for examining the robustness of watermark, is provided by Tseng (2003). The whole analyzing process is a number of sequential tasks in analyzing the correlation using the filter bank selection. Therefore, it is qualified to be the objective in the collaborated computing system in this thesis.
5 Experimentation
5.1Configuration of the experimental system
Owing to using Servlet to practice the collaborated computing system, all servers, client, and coordinator must install the Servlet container. In this experiment, The Apache’s Tomcat Server is strongly suggested to be the Servlet container since it is a freeware. Furthermore, the Microsoft Access is required in client and coordinator for the database software. In addition, the Microsoft .Net framework 1.1 is also used in servers because the trigger program of experimental project is implemented by the Microsoft .Net. The trigger program, which was developed by the Microsoft .Net, is responsible for sending the message to notify the client where the available server is while the server is idle.
To simplify the experiments, all servers, client, and coordinator are free of usage during the testing. Statistically, they are all in different hardware configuration. The hardware configurations of experimental computers are as following:
z The hardware configuration of client is Pentium III 737 MHz PC with 256 RAM in Microsoft Windows XP.
z The hardware configuration of coordinator is Pentium III 669 MHz PC with 384 RAM in Microsoft Windows XP.
z The hardware configuration of the server1 is Intel Pentium® 4 2.60 GHz with 512MB RAM in Microsoft Windows XP.
z The hardware configuration of the server2 is Intel Pentium® 4 1.80 GHz with 256 MB RAM in Microsoft Windows XP.
z The hardware configuration of the server3 is Intel Pentium® 4 2.40 GHz with 496 MB RAM in Microsoft Windows 2003.
z The hardware configuration of the server4 is Intel Pentium® 4 2.40 GHz and Intel Pentium® 4 2.41 GHz with 1.00 GM RAM in Microsoft Windows XP. z The hardware configuration of the server5 is Pentium III 796 MHz notebook
with 128 RAM in Microsoft Windows XP.
Furthermore, the experimental computers were added by the order while doing the computation. An important point to be note is that the whole communications between these computers in the collaborated computing architecture are using HTTP protocol.
The experimentation took place at midnight, which means no one used those experimental computers. Each sub-task was executed while the process time of servers was 30%. The interval time between two sub-tasks, which was called waiting time, was 3 seconds. The purpose of waiting time is to detect server's processing time, in order to determine whether the server is busy or not
The objective of the experiment is defined in Chapter 4.3 above. The correlation program, which was written by Li-Hsin Tseng, was provided. 76177 sets of filters in filter banks are prepared to examine the robustness. Each set has four filters, two of them are analysis filters, and the other two are synthesis filters. In the experiment, 76177 sets of filters were divided into 305 sub-tasks.
5.2 System Architecture
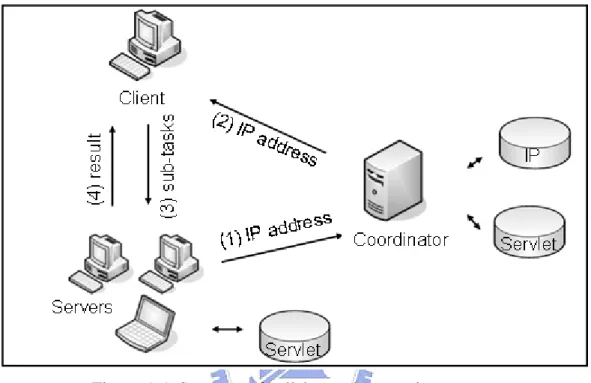
This collaborated computing system is modified from power server model. Its structure is illustrated in Figure 5.1. The major difference between the power server model and the collaborated computing system is the role of coordinator. In the
collaborated computing system, coordinator only deals with finding the available servers from the web. Moreover, the small programs in the collaborated computing system are executed by the Internet Explorer.
Figure 5. 1.Structure of collaborated computing system.
The collaborated computing system works as follow:
z Step 1: while server is idle, it passes its’ IP address to the coordinator. Therefore, the coordinator can find available server on the Internet.
z Step 2: the coordinator conveys the IP address to client. By this way, the client realizes which server it can arrange sub-task to.
z Step 3: the client dispatches sub-task to the server.
z Step 4: After computing, this server delivers the result back to the client. The design details of each role, client, servers, and coordinator, are described below.
5.2.1 Client specification
The client is not involved in the actual computation. It dispatches the sub-tasks and collects the sub-results. The tasks of the client include:
z Allows available server to connect. z Arranges sub-task to servers;
z Maintains the database of the job progress; z Gathers and stores the sub-result;
z Generates the final result; and z Validates the result.
In client part, error can not be tolerated. Therefore, the algorithm of job dispatch and database must be implemented carefully. Database is designed for following propose:
z Stores the filter for examination; z Lists the available servers; z Records the project progress; and z Collects the result.
There are 76177 sets of filter bank selection in the database. During the computation, the sub-tasks are arranged based on the initial setting, which are 250 sets of filters. Therefore, the number of total sub-tasks is 305. After all the sub-tasks are done, the results are collected and reported automatically.
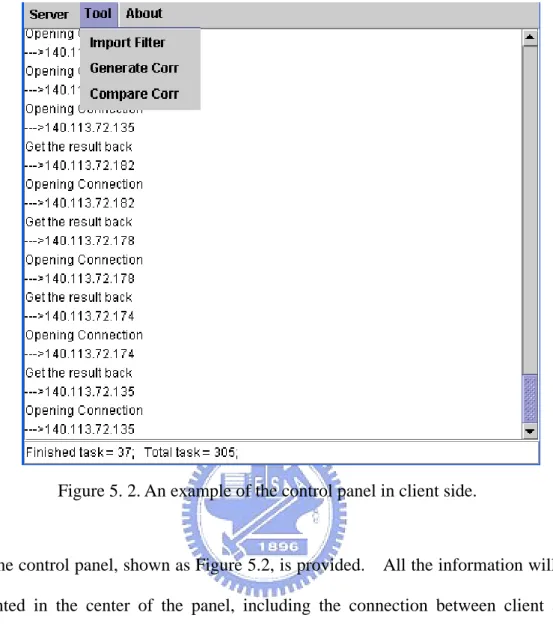
Figure 5. 2. An example of the control panel in client side.
One control panel, shown as Figure 5.2, is provided. All the information will be presented in the center of the panel, including the connection between client and servers, and progress of the project. Moreover, in this panel, the drop down menu of tool includes three tools, which are Import Filter, Generate Corr, and Compare Corr. The functionalities of those tools are listed below:
z Import Filter: as mentioned, in this project, there are 76177 sets of filter banks used for analyzing the robustness of digital watermarking. Therefore, those filter banks need to be imported into the database.
z Generate Corr: after computation is completed, the final results must be integrated into two text files. The first file was called corr1.txt. This is the result of the correlation between the original watermark and the watermark, which was extracted from non-tempered digital image. The second file was
called corr2.txt. This is the result of the correlation between the original watermark and the watermark, which was extracted from tempered digital image. The tempered digital image was attacked by JPEG 2000.
z Compare Corr: this tool is just for validating the final result through comparing to the original result, which was generated by a single PC.
5.2.2 Server specification
Servers are in charge of the computation. Following are the tasks of the servers:
z Sends a request to coordinator; z Receives the sub-task;
z Computes the result; and z Conveys the result to client.
For accomplishing those tasks, three small programs must be installed. The details of these programs are as following:
z The trigger program (P2P testing program): this program was implemented by Microsoft .Net. Therefore, servers must have installed the Microsoft .Net Framework 1.1. This program aims to trigger the computation by sending a request to the coordinator. There are three conditions to be fulfilled before starting the trigger, 1) Tomcat is running, 2) the process idle time is upon 70%, and 3) the last process has finished for 3 seconds (waiting time). The process idle time and the waiting time can be changed by the program, which is shown as Figure 5.3.
Figure 5. 3. An example of the trigger.
z Correlation program: for analyzing the robustness of digital watermark. The correlation between watermarks will be created by using the correlation program. z Servlet: it is responsible for communication between client and server. The
sub-tasks will be received as object, the correlation program will be invoked, and the result will be sent by this Servlet.
Considering the security in servers, no data will be stored except the programs, which were mentioned above. The server program was run as shown in Figure 5.4.
In server part, the difference between collaborated computing system and the power server model is the way of execution. In power server model, program was running as a screensaver. In this presented collaborated computing system, program was running in Internet Explorer. However, servers can decide how to share the CPU computing power.
5.2.3 Coordinator specification
In this collaborated computing system, the main goal of coordinator in the collaborated computing system is to discover the available servers on the web. Therefore, coordinator is only involved in three tasks.
z Allows servers to register;
z Maintains the database of servers’ information; and z Passes the IP addresses of servers to the client.
The database is only responsible for recording the information of servers. Moreover, no panel tool is provided in coordinator part.
Further, One Servlet, which was placed in the coordinator, deals with the communication between servers and client.
5.2.4 The algorithm of job dispatch
Client computer is responsible to the job dispatch. In this experiment, the job dispatch algorithm is described below and the flow chart is in Figure 5.5:
task_size = 1000 if (job_list == empty) dispatch NewJob else {
for all jobs in job_list {
if ((task(i).status == 0) and ((task(i).time – current )>2)) dispatch task(i)
}
dispatch NewJob }
Function dispatch NewJob if (job_list == empty) task.begin = 1; else {
find the index of the last task; i = index + 1
task(i).begin = the last task.end + 1 }
task(i).end = task(i).begin + task_size – 1 task(i).status = 0
task(i).time = current transit the task(i) EXIT
End Function
Function dispatch task(i) task(i).time = current transit the task(i) EXIT
Figure 5. 5. The flow sheet of job dispatching.
The algorithm for after receiving the sub-results from servers is presented as follow and the flow chart is in Figure 5.6:
receive result(i) find task(i) task(i).status = 1
5.3 Formula Estimation
In Chapter 3.3, two factors, speedup and efficiency, were given for measuring a P2P system. The collaborated computing system was designed based on power sharing P2P architecture. Therefore, these two factors can be used for the performance estimation. The analysis is described below.
z Speedup
The speedup of the collaborated computing system is shown in Figure 5.7. If the fraction of operations in a process is 0.03, the speedup is increasing very steadily when the number of processors up to 40. It still indicates that the speedup is proportional to the number of processors when it is over 40. In other words, the speedup has not been limited by the parallel algorithm.
0
5
10
15
20
25
30
35
40
5
10
15
20
25
30
35
40
number of processors
sp
eed up
Figure 5. 7. Speedup against the number of processors from 5 to 40.
z Efficiency
In practice, efficiency is a value between zero and one since the speedup is usually less than the number of processors. In the perfect case, the efficiency is one. As we can see in Figure 5.8, the efficiency in the collaborated computing system is
above 0.8 while the number of processors achieves 40.
According to the estimation results by speedup and efficiency, the estimated performances of collaborated computing system are as above. Next section, the experimental result will be presented through the CPU utility rate (process time) and the time consumption.
0 0.050.1 0.150.2 0.250.3 0.350.4 0.450.5 0.550.6 0.650.7 0.750.8 0.850.9 0.951 5 10 15 20 25 30 35 40
number of processors
ef
fi
ci
en
cy
Figure 5. 8. Efficiency against the number of processors from 5 to 40.
5.4 Experimental result
For the moment, we shall concentrate on the experimental results of the collaborated computing system. In this thesis, we will take the process time and the time consumption to be the targets of analysis. The initial parameters of the experimentation are the process time less than 30% and the waiting time of 3 seconds.
Before we move to the discussion of process time and time consumption, two scenarios have to be mentioned. Scenario one is the correlation program executed in
one computer. Scenario two is the correlation program executed by the collaborated computing system. Among these two scenarios, the client computer in scenario two is the same computer as scenario one. Let us move our attention to discuss the process time.
z Process time
As we can see in Figure 5.9, the process time in scenario one is always 100% busy, which is shown as the dotted line, but the process time in the client computer in scenario two is always under 40%. In other words, the loading in client computer has been successfully shared with other computers.
0
10
20
30
40
50
60
70
80
90
100
30 60 90 120 150 18
0
210 240 27
0
300 330 36
0
390 420 45
0
480 510 54
0
570
minute
pr oc es s t im e process in the collaborated computing system process in a single computerFigure 5. 9. The process time.
(size of subtask is 250 sets of filters, process time is 30%, waiting time is 3 seconds )
Let us take a look at the process time in servers. Figure 5.10 shows us the process time in the period while computing a sub-task. (a), (b), and (c) were the process time in server 1, 3, and 4. (d) was the process time in server 5.
All process time of servers are similar in Figure 5.10. The only difference is the period of time while finishing a sub-task. In (a),(b),(c), one sub-task can be finished within 9 minutes, which including the time of sending the sub-task, the time of computation, and the time of conveying the result. In (d), one sub-task was finished within 13 minutes.
0 20 40 60 80 100 0 1 2 3 4 5 6minute7 8 9 10 11 12 pr oc es s t im e 0 20 40 60 80 100 0 1 2 3 4 5 6minute7 8 9 10 11 12 pr oc es s t im e (a) (b) 0 20 40 60 80 100 0 1 2 3 4 5 6minute7 8 9 10 11 12 pr oc es s t im e 0 10 20 30 40 50 60 70 80 90 100 0 1 2 3 4 5 6 7 8 9 10 11 12 minute pr oc es s t im e (c) (d) Figure 5. 10. The process time of one sub-task in a server.
(size of subtask is 250 sets of filters, process time is 30%, waiting time is 3 seconds )
The collaborated computing system aims to share the loading. Figure 5.9 and Figure 5.10 show the shared computation load.
z Time consumption
the more time can be saved. Through the collaborated computing system, the time consumption is reduced dramatically while the number of servers is increased from 2 to 5. When comparing scenario one with scenario two, it is clear that the time consumption for scenario one, 47 hours and 19 minutes, is much longer than that of scenario two. 0 5 10 15 20 25 30 2 3 4 5
number of servers
hou
r
Figure 5. 11. The time consumption in the collaborated computing system.
(size of subtask is 250 sets of filters, process time is 30%, waiting time is 3 seconds )
Figure 5.11 tells us that the collaborated computing system can really share the loading. However, the speed of reduction slows down while the number of computers increases. The possible reasons are that the network is busy in transportation and the hardware configuration of servers is different. The solution is to use at least two ports for Servlets, one for sending and one for receiving, to improve the transmission efficiency. However, it is still impossible to decrease the computation time in proportion due to the hardware configuration of servers.
6 Discussion
The main objective in this thesis is to provide an inexpensive and efficient solution for load distributing. Therefore, the collaborated computing system, which is one kind of CPU power sharing P2P system, is presented. After practicing the collaborated computing system with an example in DWT based digital watermark, the analysis of this system is discussed as following.
In the collaborated computing system, the process time and the time consumption have been improved greatly by comparing to execution the analysis in single computer. Moreover, speedup is gradually ascending and efficiency is always above 0.8, while the amount of computers is up to 40. That proves the performance of the collaborated computing system is highly expected.
The collaborated computing system can solve the mentioned weaknesses and disadvantages of P2P system in Loo (2003), which are security, motivation, performance efficiency and compatibility. The collaborated computing system was proposed as a solution for sharing the loading in a small-scale company or laboratory. Due to this proposal, the security and motivation can be easily conquered by the policy in company or laboratory. In addiction, the collaborated computing system is implemented by Servlet, which can ease the problems in security, performance efficiency, and compatibility.
This collaborated computing system can also be improved by the following approaches:
z Uses the other programming language to implement the trigger: the trigger was built by Microsoft .Net, which means that it can only run on the computer with Microsoft Operation System.
z This collaborated computing system can be implemented into the other task by modifying the job dispatch algorithm.
z Allocates jobs based on the servers’ information: the client will arrange the job loading to each server depending on their hardware configuration recorded in the client’s records.
Furthermore, there are three differences between the power server model and the proposed collaborated computing system. First, the functionalities in the coordinators in two systems are different. The coordinator in the collaborated computing system is not responsible to convey the Servlet and the correlation program between client and server. The Servlet and the correlation program are delivered by the Intranet. Hence, the coordinator can be omitted. Second, the computation application is run in Internet Explorer compared to be executed as screensaver. Due to the difference, the computation process in Internet Explorer mode can be made faster than the computation process in screensaver mode. In addition, the servers can cope with their job as usual. Third, the collaborated computing system provides interaction between the client and servers. Servers can decide how to share their process time with client.
The collaborated computing system, which is suitable for a small and medium size project, can be easily and quickly implemented by Servlet with low cost. According to this system, computers in an enterprise or a laboratory can devote their computation power while they are idle. Therefore, by integrating those computation
powers within the organization, the time consumption for a particular project can be reduced effectively.
Reference
1. Anderson, D. P., Cobb, J., Korpela, E., Lebofsky, E. and Werthimer, D. (2002). SETI@home: an experiment in public-resource computing. Communications of the ACM, 45(11), 56-61.
2. Cox, I. J., Kilian, J., Leighton, F. T. and Shamoon, T. (1997). Secure spread spectrum watermarking for multimedia. IEEE Transactions on Image Processing, 6(12), 1673-1687.
3. FightAIDS@home (2004, June). Retrieved June 7, 2004 from the World Wide Web: http://fightaidsathome.scripps.edu/.
4. Foster, I., Kesselman, C. and Tuecke S. (2001). The anatomy of the Grid: Enabling Scalable Virtual Organization. The International Journal of High Performance Computing Applications, 15(3), pp. 200-222.
5. Joseph, J. (April 7, 2003). A developer’s overview of OGSI and OGSI-based Grid computing: get an in-depth look at the Open Grid Service Infrastructure. Retrieved June 18, 2004 from the World Wide Web: http://www-106.ibm.com/developerworks/grid/library/gr-ogsi/
6. Loo, A. W., Bloor, C. and Choi, C. (2000). Parallel computing using web servers and Servlets. Internet Research, 10(2).
7. Loo, A. W. (2003). The future of peer-to-peer computing. Communications of the ACM, 46(9), 57-61.
8. Looseley, C. and Douglas F. (1998). High performance client/server: a guide to building and managing robust distributed systems. New York: John Wiley & Sons.
9. Lui, S. M. and Kwok, S. H. (2002). Interoperability of peer-to-peer file sharing protocols. ACM SIGecom Exchanges, 3(3), 25-33.
10. Napster Inc. (2004, June). Retrieved June 7, 2004 from the World Wide Web: http://www.napster.com.
11. Talia, D. and Trunfio, P. (2003, July/August). Toward a synergy between P2P and Grids. IEEE Internet Computing, 93-95.
12. Tseng, L. H. (2003). The wavelet packet transform based watermarking for the digital image ownership verification. Unpublished master’s thesis, National Chiao-Tung University, Taiwan.
13. Wang, Y., Doherty, J. F. and Dyck, R. E. (2002). A wavelet-based watermarking algorithm for ownership verification of digital images. IEEE Transactions on Image Processing, 11(2), 77-87.
14. Zhang, L. J., Chung, J. Y. and Zhou, Q. (October 1, 2002). Developing Grid computing applications, part 1: introduction of a Grid architecture and toolkit for building Grid solutions. Retrieved June 18, 2004 from the World Wide Web:
http://www-1.ibm.com/servers/eserver/central/strategic_direction.html?ca=e servercentral&me=W&met=9_to_sa_strategicd