An Evaluation Model of Service Support System for Heavy Machinery Dealers
Chang-Jiang Lee
1, Grier Lin
2, Ying-Fang Huang
31, 2
University of South Australia
3
National Kaohsiung University of Applied Sciences
ABSTRACT
The present study applied the Grey relational analysis and Delphi method to establish an evaluation model of service support system (SSS) for heavy machinery dealers in Taiwan. This study first used Delphi method to sift the key factors of the SSS, and then constructed a questionnaire for dealers to fill out and compute the average subjective rating by customers, finally applied the Grey relational analysis to conduct the evaluating as well as selects the best dealer which had the best SSS.
This study employed six largest heavy machinery dealers in Taiwan as the study subjects. Through questionnaire empirical study, the evaluation model developed by this study can truly serve as a reference to evaluate the SSS for heavy machinery dealers in Taiwan.
Keyword: Grey Relational Analysis, Delphi Method
INTRODUCTION
Taiwan does not have any heavy machinery manufacturers, all of the heavy machineries were imported by dealers so far. Customers’ needs in heavy machinery are rapidly increasing during recent years for many areas. Especially, demands on service support system (SSS) capability are also relatively increased. How to upgrade the SSS capability to satisfy customers’ needs becomes the most important task to sustain
operation for business.
For sustainable operation, the business must have its core competition, while SSS capability is the basic factor in heavy machinery industry. After long-term period operation, the constructed business image and business culture are the best narrator of product. When product is successfully sold, the SSS capability is ready to show. Therefore, how to establish and evaluate a SSS is becoming the most important task for heavy machinery dealers. Accordingly, how to upgrade SSS capability to satisfy customer’s needs as well as enhance the business competitively becomes the urgent mission to heavy machinery dealers.
However, the SSS capability to customer satisfaction is decided by the customers’ perception. Additionally, it involves complicated factors which include quantitative and qualitative factors. As a result, it is not easy to conduct the evaluation model of SSS. The quantitative and qualitative factors must be included in the rating to obtain an evaluation model.
This study aims to develop a feasible evaluation model with focus on SSS for heavy machinery dealers. This study used the largest six heavy machinery dealers in Taiwan as empirical study. The Delphi method was first to sift the key factors that may affect the SSS, and then used the Grey relational analysis to conduct the evaluating as well as selects the best dealer which had the best SSS in Taiwan.
The origin of the Delphi technique stems from work in the Rand Corporation during the late 1950s. The name given to the technique originates from Greek mythology, for it was at Delphi where the oracle could be found. By using a group of exports the Delphi technique was, and in some cases still is, thought to provide the best available to a problem, much like the oracle in ancient Greece. The original aim of Delphi was to obtain the most reliable consensus of opinion from a group of experts by a series of intensive questionnaires interspersed with controlled feedback [5].
Delphi method is not a procedure intended to challenge statistical or model- based procedures, against which human judgment is generally shown to be inferior. It is intended for use in judgment and forecasting situations in which pure model-based statistical methods are not practical or possible because of the lack of appropriate historical/ economic/ technical data, and thus where some form of human judgmental input is necessary [17].
The Delphi has been defined as an iterative process designed to combine expert opinion into group consensus [9]. As allude to above the Delphi technique employs a number of rounds in which questionnaires are sent out and are used until consensus is reached [2]. In each round, a summary of the results of the previous round is included and evaluated by the panel members. McKenna [10] implies that this process facilitates the ‘systematic emergency of a concurrence of judgment/opinion’. The number of rounds depends upon the time available and whether the experimenter commenced the Delphi sequence with one broad question or with a list of questions or events. The process raises the question of how many rounds it takes to reach consensus. The classical original Delphi used four rounds [19]. However, this has been modified by many to suit individual research aims and in some cases it has been shorted to two or three rounds [2, 13].
In view of its inherent ability as an analytical tool
embodying ‘foresight’ and to consolidate condensed opinion on issues related to ‘future’, Delphi has been recommended as an effective method for discussing issues involving high level of uncertainty [10, 16].
The Delphi technique is being increasingly used in many areas in which a consensus is to be reached. Some of these areas included the theory and design application [4], development of residential areas [1], and bridge condition rating and effects of improvements [14].
Through relational comparison among parameters, Grey relational analysis realizes the relation between parameters and ideal variables. Since required information is located from part indefinite conditions, the interactive relationship among parameters are further realized. The so- called relation is the relational measurement on attribute in two systems or two programs in the system along with change of time and space. If it indicates in the series, it is called relational series, while Grey relation exhibits the indefinite relation of confronting attributes among events or systems.
Using additive measurement concept, Grey relational analysis conducts the integrated computation on program attributes of systems. Based on similarity and dissimilarity of its development trend, the relations among systems or programs are measured. General Grey relational analysis evaluation is established on system attribution and scale independent hypothesis and regards attribute measurement as equal weight. While Grey relation computed by additive computation can also use AHP to compute the relative weighing value of the common factors in obtaining the Grey relation based on non- additive measurement.
There are many factors to be considered in the selection items of customer satisfaction. Additionally factor consideration can be indicated by quantification or qualification. Basically factor consideration is regarded as multiple attribute decision making. As a result this research adopts Grey relational analysis to conduct the evaluation of excellent service support
capability dealer and select the best service support capability dealer. Grey relational multiple attribute decision making has many successful application cases in many fields, especially it has excellent results in the application of evaluating decision making [6, 8, 18, 20].
Standard sequence xi(0) has K factors and m comparative sequences X1, X2, X3, X4, ………, Xm are shown as follows:
xi(0)(k) is the standard sequence with k factors.
xi(k) is comparative sequence
x0={x0(1), x0(2)…x0(j), x0(k)}
x1={x1(1), x1(2)…x1(j), x1(k)}
x2={x2(1), x2(2)…x2(j), x2(k)}
xi={xi(1), xi(2)…xi(j), xi(k)}
To compute the Grey relation coefficient of standard sequence xi(0) and comparative sequence xi in the k point:
R0i(k)= Δmin +ρΔmax (1)
Δ0i(k) +ρΔmax
Which Δ0i(k)=|xi(0)
(k)- xi(k)|, indicates the absolute deviation of sequences xi(0)(k) and xi
Δmax=max min Δ
(k) in the k number
0i
Indicates the maximum value decided in the Δ (k)
0i(k) of k factors of m sequences
Δmax=min minΔ0i(k)
Indicates the minimum value decided in the Δ0i(k) of k factors of m sequences. ρ= 0.5, ρ is the Grey
relation recognition coefficient with number between 0~1, it usually takes 0.5.
The Grey relation of each sequence and standard sequence is:
Γ0i(k)=Σw(k) × r0i(k) (2)
Where i=1, 2,….., m, k=1, 2,….., n
And w(k) is the weighting of each selection factor.
Before Grey relation computation, the data processing is:
(1)Normalized by maximum value
xi* x (k)= i(0) (3) (k) max xi(0)(k)
Which max xi(0)(k) indicates the maximum value of certain criterion index k in the m sequences.
(2)Normalized by minimum value
xi* x (k)=- i(0) +2 (k) (4) min xi(0)(k)
Which min xi(0)(k) indicates the minimum value of certain criterion index k in the m sequences.
EVALUATION MODEL
After confirming research topic, this research collects data, studies the relevant literatures to locate representative and meaningful evaluation index and revise the proper questionnaire contents to measure Taiwan industrial environment to develop the basic factors of SSS evaluation for heavy machinery dealers as well as included actual evaluation items of each basic
factors. After Delphi procedure, the SSS was divided into two divisions: maintenance capability (MC) and
parts support (PS). The research framework structure of SSM after Delphi procedure is shown in figure 1.
SELECTION PROCESS OF MC
After confirming research topic, this research collects data, studies the relevant literatures to locate representative and meaningful performance evaluation index and revise the proper questionnaire contents to measure Taiwan industrial environment to develop the basic dimensions for maintenance capability evaluation for heavy machinery dealer as well as included actual evaluation items of each basic dimensions.In the maintenance capability (MC) aspect, the representative items include quality and quantity to conduct the questionnaire survey with focus on maintenance capability. Delphi method is firstly used to decide the evaluation factors that affect the MC of customers’ satisfaction. The selected factors include technical know-how, quality of repair, field call response, turnaround time, relationship, warranty, fee, and convenience of location.
Figure.1 Research Framework of Service Support System Qualitative Factors:
Technical know-how; Quality of repair; Field call response; Relationship; Convenience of location. Quantitative Factors: Turnaround time; Warranty; Fee. Maintenance Capability (MC) Qualitative Factors: Quality of parts; Technical Support;
Relationship to the supplier; Brand image;
Sales support.
Quantitative Factors: Availability; Price;
Credit/ Payment Term
Parts Support (PS)
Table.1 The selection matrix of MC in the evaluation model Selection Items Technical know-how Quality of repair Field call response Turnaround
time Relationship Warranty Fee
Convenience of location Selection Index Divide into five ranks Divide into five ranks Divide into five ranks Divide into five ranks Divide into five ranks Divide into five ranks Divide into five ranks Divide into five ranks Weighting 17% 19% 13% 15% 9% 11% 10% 6% Data pre- processing Normalize by maximum Normalize by maximum Normalize by maximum Normalize by maximum Normalize by maximum Normalize by maximum Normalize by maximum Normalize by maximum Series X 3.8 3.8 4 3.9 4 3.6 3.9 3.9 Dealer K 3.8 3.8 3.4 3.4 3.9 3.5 2.8 3.5 Dealer D 3.2 3.3 3.4 3.1 3.8 3 3.5 3.0 Dealer H 3.5 3.5 3.7 3.5 4 3.4 3.7 3.5 Dealer C 3.8 3.8 4 3.9 3.9 3.6 3.7 3.9 Dealer S 3.4 3.5 3.2 3.2 3.9 3.2 3.9 3.2 Dealer V 3.6 3.6 3.3 3.3 3.5 3.4 3.8 3.2
This research is focused on six dealers of heavy machinery in Taiwan as survey target. With focus on MC, the key factors are selected to produce the questionnaire based on Delphi method. The questionnaire is sent out to customer’s filling out. The average score is computed. Finally, Grey relational analysis is applied to conduct the evaluation in selecting the best dealer. The ratings were filled out by customer
responsible officer. After rating is made, the rating sheets are collected to compute the average rating of each dealer. Table 1 shows the gray relational key factors that the customer responsible officers were selected.
The maintenance capability data after grey relational generating processing of this case is shown in the table 2.
Table.2 The MC data after grey relational generating processing Selection Items Technical know-how Quality of repair Field call response Turnaround
time Relationship Warranty Fee
Convenience of location Dealer K 1.000 1.000 0.850 0.872 0.975 0.972 0.718 0.897 Dealer D 0.842 0.868 0.850 0.795 0.950 0.833 0.897 0.769 Dealer H 0.921 0.921 0.925 0.897 1.000 0.944 0.949 0.897 Dealer C 1.000 1.000 1.000 1.000 0.975 1.000 0.949 1.000 Dealer S 0.895 0.921 0.800 0.821 0.975 0.889 1.000 0.821 Dealer V 0.947 0.947 0.825 0.847 0.875 0.944 0.975 0.821
To compute the Grey relation in the selection items of each contractor ρ in this case (Grey relation
coefficient) takes 0.5 to substitute in the formula (5): ( ) max max min ) ( 0 0 ∆ + ∆ ∆ + ∆ = ρ ρ k k R i i (5)
8 ,... 2 , 1 , 10 ,... 2 , 1 = = k i
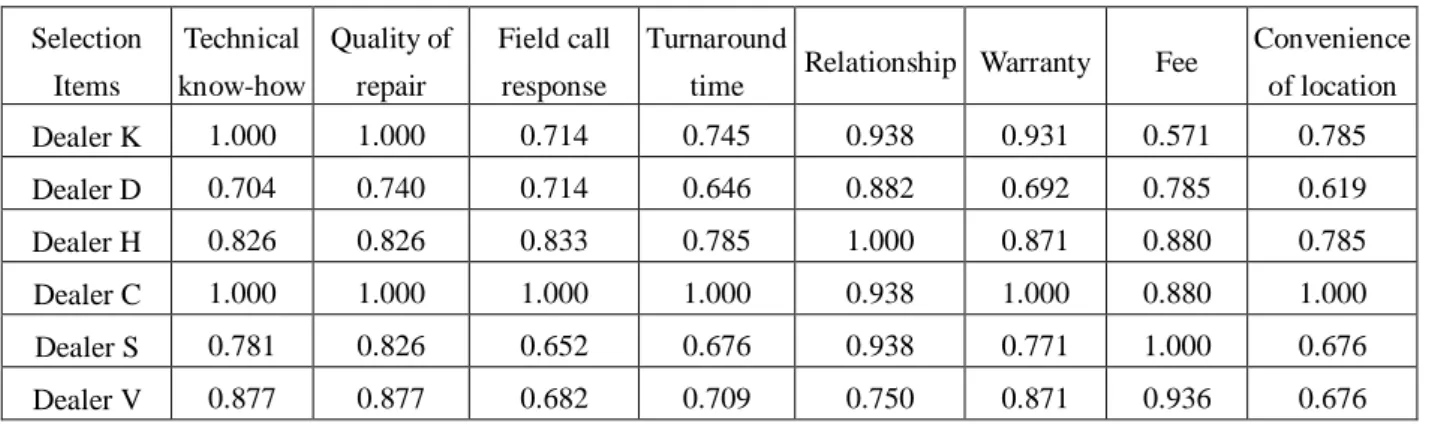
Formula (6) is used to compute the Grey relational rating for each dealer, the results are indicated in the table 4.
∑
×Γ = Γ0i(k) w(k) 0i(k) (6) 8 ,... 2 , 1 , 10 ,... 2 , 1 = = k iTable.3 The Grey relational rating of each dealer Selection Items Technical know-how Quality of repair Field call response Turnaround
time Relationship Warranty Fee
Convenience of location Dealer K 1.000 1.000 0.714 0.745 0.938 0.931 0.571 0.785 Dealer D 0.704 0.740 0.714 0.646 0.882 0.692 0.785 0.619 Dealer H 0.826 0.826 0.833 0.785 1.000 0.871 0.880 0.785 Dealer C 1.000 1.000 1.000 1.000 0.938 1.000 0.880 1.000 Dealer S 0.781 0.826 0.652 0.676 0.938 0.771 1.000 0.676 Dealer V 0.877 0.877 0.682 0.709 0.750 0.871 0.936 0.676
Table.4 The relational rating after calculated the Grey relational coefficient of selection items Selection Items Technical know-how Quality of repair Field call response Turnaround
time Relationship Warranty Fee
Convenience of location Weight 17% 19% 13% 15% 9% 11% 10% 6% Dealer K 0.170 0.190 0.093 0.112 0.084 0.102 0.057 0.047 0.687 Dealer D 0.120 0.141 0.093 0.097 0.079 0.076 0.079 0.037 0.602 Dealer H 0.140 0.157 0.108 0.118 0.090 0.096 0.088 0.047 0.704 Dealer C 0.170 0.190 0.130 0.150 0.084 0.110 0.088 0.060 0.812 Dealer S 0.133 0.157 0.085 0.101 0.084 0.085 0.100 0.041 0.653 Dealer V 0.149 0.167 0.089 0.106 0.068 0.096 0.094 0.041 0.659
Table.5 The gray relational order of MC for each dealer
Dealer Grey relational rating Grey relational order Dealer C 0.812 1 Dealer D 0.602 6 Dealer H 0.704 2 Dealer K 0.687 3 Dealer S 0.653 5 Dealer V 0.659 4
Table 6 shows Grey relational rating and Grey relational order for each dealer. After considering
weighting, the results of Grey relational rating are: relational rating of MC in dealer C is 0.812, relational rating of MC in dealer H is 0.704, relational rating of MC in dealer K is 0.687, relational rating of MC in dealer V is 0.659, relational rating of MC in dealer S is 0.653, relational rating of MC in dealer D is 0.602. After sorting, the relational rating of MC in dealer C is the highest. Therefore dealer C is the best MC dealer.
SELECTION PROCESS OF PS
In the parts support (PS) aspect, the representative items include quality and quantity to
conduct the questionnaire survey with focus on PS satisfaction. Delphi method is firstly used to decide the evaluation factors that affect the PS of customer satisfaction. The selected factors include quality of parts, technical support, availability, turnaround time, price, sales support, relations to the supplier, brand image, and credit/ payment term.
The rating items and sub-items of PS are indicated in the appendix table 2.
This research is focused on six dealers of heavy machinery in Taiwan as survey target. With focus on PS, the key factors are selected to produce the questionnaire
based on Delphi method. The questionnaire is sent out to customer’s filling out. The average rating is computed. Finally, Grey relational analysis is applied to conduct the evaluation in selecting the best PS dealer. The ratings were filled out by customer responsible officer. After rating is made, the rating sheets are collected to compute the average rating of each dealer. Table 6 shows the gray relational key factors that the customer responsible officers were selected.
The PS data after grey relational generating processing of this case is shown in the table 7.
Table.6 The selection matrix of PS in the evaluation model Selection
Items
Quality of parts
Technical
support Availability Price
Sales support Relationship to the supplier Brand image Credit/ payment term Selection Index Divide into five ranks Divide into five ranks Divide into five ranks Divide into five ranks Divide into five ranks Divide into five ranks Divide into five ranks Divide into five ranks Weighting 19% 18% 17% 13% 12% 8% 8% 5% Data pre- processing Normalize by maximum Normalize by maximum Normalize by maximum Normalize by maximum Normalize by maximum Normalize by maximum Normalize by maximum Normalize by maximum Series X 4 3.8 3.8 3.8 3.8 3.9 4 3.9 Dealer C 4 3.8 3.8 3.3 3.8 3.6 4 3.7 Dealer D 3.4 3 3 3.6 3.1 3.3 3.2 3.9 Dealer H 3.2 3.2 3.2 3.7 3.2 3.2 3.2 3.8 Dealer K 3.6 3.5 3.5 3.6 3.8 3.9 3.7 3.7 Dealer S 3.2 3.1 3.1 3.8 3.3 3.3 3.1 3.8 Dealer V 3.3 3.3 3.3 3.8 3.2 3.5 3.3 3.8
Table.7 The PS data after grey relational generating processing Selection
Items
Quality of parts
Technical
support Availability Price
Sales support Relationship to the supplier Brand image Credit/ payment term Dealer C 1.000 1.000 1.000 0.868 1.000 0.923 1.000 0.949 Dealer D 0.850 0.789 0.789 0.947 0.816 0.846 0.800 1.000 Dealer H 0.800 0.842 0.842 0.974 0.842 0.821 0.800 0.975 Dealer K 0.900 0.921 0.921 0.947 1.000 1.000 0.925 0.949 Dealer S 0.800 0.816 0.816 1.000 0.868 0.846 0.775 0.975 Dealer V 0.825 0.868 0.868 1.000 0.842 0.897 0.825 0.974
To compute the Grey relation in the selection items of each contractor ρ in this case (Grey relation coefficient) takes 0.5 to substitute in the formula (7):
max ) ( max min ) ( 0 0 ∆ + ∆ ∆ + ∆ = ρ ρ k k R i i (7) 8 ,... 2 , 1 , 10 ,... 2 , 1 = = k i
Formula (8) is used to compute the relational rating for each dealer, the results are indicated in the table 5.
∑
×Γ = Γ0i(k) w(k) 0i(k) (8) 8 ,... 2 , 1 , 10 ,... 2 , 1 = = k iTable.8 The relational rating of PS for each dealer Selection
Items
Quality of parts
Technical
support Availability Price Sales support
Relationship to the supplier Brand image Credit/ payment term Dealer C 1.000 1.000 1.000 0.740 1.000 0.830 1.000 0.880 Dealer D 0.714 0.640 0.640 0.877 0.671 0.709 0.652 1.000 Dealer H 0.652 0.704 0.704 0.934 0.704 0.676 0.652 0.936 Dealer K 0.790 0.826 0.826 0.877 1.000 1.000 0.833 0.880 Dealer S 0.652 0.671 0.671 1.000 0.740 0.709 0.625 0.936 Dealer V 0.682 0.740 0.740 1.000 0.704 0.785 0.682 0.936
Table.9 The relational rating after calculated the Grey relational coefficient of selection items Selection
Items
Quality of parts
Technical
support Availability Price
Sales support Relationship to the supplier Brand image Credit/ payment term Weight 17% 19% 13% 15% 9% 11% 10% 6% Dealer C 0.190 0.180 0.169 0.095 0.118 0.065 0.081 0.041 0.749 Dealer D 0.136 0.115 0.108 0.112 0.079 0.055 0.053 0.047 0.570 Dealer H 0.124 0.127 0.119 0.112 0.083 0.053 0.053 0.044 0.598 Dealer K 0.150 0.149 0.140 0.112 0.118 0.078 0.068 0.041 0.705 Dealer S 0.124 0.121 0.113 0.128 0.087 0.055 0.051 0.044 0.599 Dealer V 0.130 0.133 0.125 0.128 0.083 0.061 0.055 0.044 0.630
Table.10 The gray relational order of PS for each dealer Dealer Grey rating Grey order
Dealer C 0.749 1 Dealer D 0.570 6 Dealer H 0.598 5 Dealer K 0.705 2 Dealer S 0.599 4 Dealer V 0.630 3
After considering weighting, the results of Grey relational rating are: relational rating of PS in dealer C is 0.749, relational rating of PS in dealer K is 0.705, relational rating of PS in dealer V is 0.630, relational rating of PS in dealer S is 0.599, relational rating of PS in dealer H is 0.598, relational rating of PS in dealer D is 0.570. After sorting, the relational rating of PS in dealer C is the highest. Therefore dealer C is the best PS dealer.
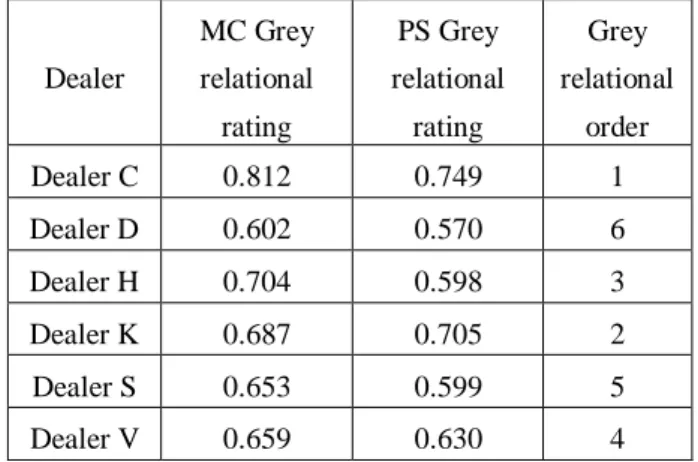
Table 11 shows that for the SSS capability evaluation, after summation the Grey rational rating of MC and PS, the results shows that the average Grey relational rating of SSS for each dealer are: in dealer C is 0.781, in dealer K is 0.696, in dealer H is 0.651, in dealer V is 0.645, in dealer S is 0.626, in dealer D is 0.586. After sorting, the relational rating of SSS in dealer C is the highest. Therefore dealer C is the best SSS dealer.
Table.11 The gray relational order of SSS capability for each dealer Dealer MC Grey relational rating PS Grey relational rating Grey relational order Dealer C 0.812 0.749 1 Dealer D 0.602 0.570 6 Dealer H 0.704 0.598 3 Dealer K 0.687 0.705 2 Dealer S 0.653 0.599 5 Dealer V 0.659 0.630 4
CONCLUSIONS
This study employed grey relational analysis to conduct comprehensive factor serial selection and obtains the following results after the empirical study on each dealers:
1. In terms of best dealer, grey relational analysis can truly provide rather accurate selection results. 2. This research verifies the relations of SSS capability
on customer satisfaction.
3. Results showed that the dealer C is the best dealer, contrarily, the dealer D is the worst dealer in Taiwan.
REFERENCES
1. Anatharajan, T., and Anataraman, V., 1982, Development of residential areas: Delphi technique for decision making. International Journal for Housing Science and Its Applications, Vol.6, No.4, p. 329-341.
2. Beech, B. F., 1997, Studying the future: a Delphi survey of how multi-disciplinary clinical staff view the likely development of two community mental health centers over the course of the next two years. Journal of Advanced Nursing, Vol.25, p. 331-338. 3. Chang, Wei-Che, 2000, A comprehensive study of
grey relational generating, Journal of Grey System, Vol.3, No.3, p. 53-57.
4. Corotis, R., F., R. and Harris, J., 1981, Delphi methods: theory and design load application. Journal of the Structural Division ASCE, Vol.107, No.6, p. 1095-1105.
5. Dalkey, N. C., and Helmer, O., 1969, An experimental application of Delphi method to use expert, Management Science, Vol.9, p. 458-467. 6. Fang Xuan, Zou Shangang, and Tang Yanzhao, 2000,
The grey comprehensive evaluation of regional scuentific technological innovation, Journal of Grey System, Vol.12, p. 347-356.
7. Gronroos, C., 1983, Strategic Management and Marketing in Service Sector Marketing Science Institute, Boston: Marketing Science Institute. 8. Li Yongping, Tang Yanzhao, and Chen Rongqiu,
2000, The grey comprehensive evaluation method on investment item, Journal of Grey System, Vol.12, p. 383-390.
9. Lynn, M. R., Layman, E. L., and Englebardt, S. P., 1998, Nursing administration research priorities: a National Delphi study. Journal of Nursing Administration, Vol.28, No.5, p.7-11.
10. McKenna, H. P., 1994, The Delphi technique: a worthwhile research approach for nursing? Journal of Advanced Nursing , Vol.19, p. 221-225.
11. Parasuramann, Z. A., Zeithaml, V. A., and Berr y, L. L., 1985, A conceptual model of service quality and its implications for future research, Journal of Marketing, Vol.49, Fall, p. 41-50.
12. Parasuramann, Z. A., Zeithaml, V. A., and L. L. Berr y, 1988, Communication and control process in the deliver y of service quality,
Journal of Marketing, Vol.52, April, p. 35-48. 13. Proctor, S., and Hunt, M., 1994, Using the Delphi
survey technique to develop a professional definition of nursing for analysis nursing workload, Journal of Advanced Nursing , Vol.19, p. 1003-1014.
14. Saito, M. and Sinha, K., 1991, Delphi study on bridge condition rating and effects of improvements. Journal of Transportation Engineering, Vol.117, No.3, p. 320–34
15. Sasser, W. E., Olsen, R. P., and Wyckoff, D. D., 1978, Management of service operations, Boston, Alley and Bacon Inc.
16. Van Dijk, J., 1990, Group interviews: a comparison case, Delphi versus interview. Journal on Technology Forecasting and Social Change, Vol.37, p. 293-304.
17. Wright, G., 1996, The impact of task characteristics on the performance of structured group forecasting techniques, International Journal of Forecasting, Vol.12, p. 73-89.
18. Wu John H., Wen Kun-Li, and You Mei-Li, 1999, A multi-decision making on grey relational grade, Journal of Grey System, Vol.11, p. 381-386.
19. Young, W. H., and Hogben, D., 1978, An experimental study of the Delphi technique Vol.5, p. 57-62.
20. Zhu Jianmin, Wang Zhongyu, Zhou Fuzhang, and
Bin Hongzan, 2000, A grey evaluation model of measurement uncertainty, Journal of Grey System, Vol.12, p. 207-215.