www.elsevier.com/locate/technovation
Development trends in Taiwan’s opto-electronics industry
Pao-Cheng Chang
a,*, Nien-Tao Tsou
b, Benjamin J.C. Yuan
a, Chien-Chun Huang
baInstitute of Management of Technology, National Chiao-Tung University, Taipei, Taiwan bElectro-Optics information Department, Industrial Technology Research Institute, Taipei, Taiwan
Abstract
With a fast growing market in multimedia and internet industries, the demand for corresponding key optical electronic devices in optical communication systems, optical input/output, optical storage, and liquid crystal displays has been rising, thus spurring the development of related industries. Not only does the Taiwanese opto-electronics industry have a bright future, but huge invest-ments in the area have also boosted the industries of LED (laser emitting diode), scanners, and CD-ROM in Taiwan, which are now ranked in the top three worldwide in terms of their revenues. However, the cost of CD-ROM production cannot be easily reduced due to the high cost of imported key components (e.g. pick-up head and IC components mainly from Japan), which seriously affect the competitiveness of the industry. It is estimated that the opto electronics industry in Taiwan is about 3–4 years behind that of Japan technology-wise with the revenue also far below that of Japan. In recent years, many huge investment projects in Taiwan have attracted attention from domestic and overseas Taiwanese professionals, who have been aggressively devoting them-selves into development of new technology. It is therefore easy to be very optimistic about the enormous potential development in the Taiwanese opto-electronic industry which has a solid foundation and is under-developed. This article analyzes the current situation of the opto-electronics industry, using the Delphi method to forecast future developments of the Taiwanese opto-electronic industry up to the year 2010. The simulated results will be a reference to those who are interested in studying the future of the opto-electronics industry in Taiwan. 2002 Elsevier Science Ltd. All rights reserved.
Keywords: Opto-electronics industry; Industrial forecasting; Delphi method
1. Introduction
The opto-electronics industry in Taiwan has
developed rapidly over the past ten years. The annual production value in 1994 was US$2.3 billion [excluding cathode ray tubes (CRT)] and hit US$5.8 billion in 1998 with an average annual growth rate of 26% (OES/ITRI, 1999), which is as high as that of the information tech-nology (IT) and semi-conductor industries. The high growth potential of this industry might be attributed to the special features listed below:
1. Employing optical methods in inspection and con-trolling applications offers high precision and
non-* Corresponding author at: Industrial Development Bureau, Minis-try of Economic Affairs in R.O.C., 41-3 Hsinyi Road, Sec. 3, Taipei, Taiwan, R.O.C. Tel.:+886-2-2754-1255; fax:+886-2-2703-8616.
0166-4972/02/$ - see front matter2002 Elsevier Science Ltd. All rights reserved.
PII: S 0 1 6 6 - 4 9 7 2 ( 0 1 ) 0 0 0 0 8 - 6
touch operations with EMI resistibility and quick responses.
2. Opto-electronics products are suitable for IT appli-cations that require high speed, large capacity, pre-mium quality and low noise.
3. Opto-electronics products can meet the market demand for light, thin and compact products. 4. Opto-electronics products are low energy dependent
and are less polluted. Given the wide range of product applications (such as IT, consumer electronics, aeros-pace, and automatic products), high added value and great economic returns, this industry is well suited to industrialized countries such as South Korea, which have invested heavily in this industry.
Presently, the main opto-electronics products in Tai-wan are LCD (liquid crystal display), LED (laser emit-ting diode), CD-ROM and digital cameras. Some key optical communication components such as fibers and optical cables are also major targets of development for
this industry. However, some high-end opto-electronics materials and key components are impossible to produce locally and must rely on imports. It is important to study how the Taiwanese opto-electronics industry should respond to the extremely competitive market. This report is aimed at making some concrete suggestions for those who are doing planning jobs in the private sectors and policy-making studies in the government sectors.
The Taiwanese opto-electronics industry including its history and it present status will be reviewed initially with a SWOT (strength, weakness, opportunity and threats) analysis being made after an introduction to the global opto-electronic industry. This detailed back-ground material should help the reader understand the object and results of the subsequent forecast.
1.1. Background of opto-electronics industry
The opto-electronics industry covers a very broad range in five main sectors including the: optical infor-mation sector; optical electronic components sector; optical communication sector; optical device and equip-ment sector; and opto-electronic application sector as indicated in Table 1 (OES/ITRI, 1999). Due to the broad spectrum of the downstream markets from the products of the opto-electronics industry, for sake of clarity and brevity only a limited study on the products selectively in some key sectors will be covered.
1.1.1. Optical storage
CD-ROM is important for PCs. The development of domestic CD-ROM was initiated by the R&D of CD
devices by OES (Opto-Electronics and Systems
Laboratories) of ITRI (Industrial Technology Research Institute Industry Researching Institute). This technology
was then transferred to⬎20 manufacturers in 1993. By
1998, the industry in Taiwan has achieved an annual pro-duction volume of 35 million sets, valued at US$1.46 billion, which was considered to be successful relative
Table 1
Opto-electronics industry
NO Sectors Products
A Optical technology Information (1) Optical storage CD-ROM/DVD-ROM, CD-R, CD-RW/DVD-RAM, CD/ROM/DVD, R, CD-RW/DVD-RAM (2) Optical output Fax, printer (3) Optical input Scanner, DSC B Optical communications Fiber and optical cable, optical connector, optical active
component, optical passive component, optical communication equipment
C Optical components Electronic Laser diode, LED, LCD
D Optical device and equipment Optical elements, optical equipment
E Optical application Electronic Optical electronic measurement, laser medical instrument, laser machinery, solar application
to other new industries in Taiwan. CD-ROM production volume in Taiwan now accounts for 38% of the total global market in 1998, and optical disk production vol-ume accounts for the even higher share of 55% in 1998. New DVD technology is being heavily developed in line with future global market trends. Major projects under development in Taiwan involve DVD, DVD– RAM devices and key components such as pick-up heads, ASIC, spindle motors and optical disks (Tseng and Chung, 1999; Fujiwara, 1999; Disk/Trend Inc., 1998).
1.1.2. Optical output
Since the first set of fax machines was produced by TECO Information System Co.), many other Taiwanese manufacturers have also entered this industry, and Tai-wan now has about 10% of global production. Since direct thermal documents are not suitable for long-term storage and are not considered to be environmentally fri-endly, the plain-paper fax has become increasingly popular. In 1994, DBTEL Inc. placed Taiwan’s first plain-paper fax machine on the market. Now many manufacturers in this field are also participating in R& D for a multifunction peripheral (MFP) machine (Huang, 1999; Lyra Research, 1999).
1.1.3. Optical input
Using IC memory cards rather than conventional film, the digital still camera (DSC) can instantly display pic-tures on a TV or monitor, and can transmit such picpic-tures to a remote terminal via a phone line. With its con-venient features, DSC is now enjoying a high growth rate along with the high growth rate in the computer and communication industries. The first prototype DSC made in Taiwan was made in 1993. Now, DSC with 4 million pixels is under research and development (Lai, 1999).
1.1.4. LED
The LED industry has been developing in Taiwan for 20 years, and covers the full range of high, intermediate and low-end products. About ten large manufacturers exist in this industry, and they are particularly strong in low-end encapsulation. The total production value of the Taiwan LED industry ranked third in the world and accounted for up to 17% of total world production value in 1998. Taiwanese firms are now targeting the high light product field (Cheng, 1999).
1.1.5. Optical communication
The optical communication industry began to emerge in Taiwan in 1975. Now, thanks to the popularity of the internet, the world optical communication market is rap-idly growing. Taiwan also invested enthusiastically into this industry and the current prospects of fiber and optical cables, optical connectors, optical passive components and optical active components are very good (Yeh, 1999).
1.1.6. LCD
Although the LCD industry in Taiwan started late, it has great potential. A few large manufactures are now planning investment in large size TFT-LCD. Their pro-posals will bring several million US dollars of invest-ment on high-end raw materials, which is sure to sig-nificantly help the establishment of the LCD industry in Taiwan (Tsou and Chao, 1999).
1.2. Global opto-electronics industry
According to the industrial research reports from
Opto-Electronic Laboratories, ITRI of Taiwan
(OES/ITRI, 1999; The Optical Industry and Technology Association, 1999), the global opto-electronics market value was US$158.2 billion in 1998; an increase of 8.7% from 1997 as demonstrated in Table 2. The optical infor-mation sector, the largest of the five sectors, had a mar-ket value of US$87.94 billion in 1998 representing 55.6% of the total market. The optical communication sector was at the second place with a market value of up to US$23.2 billion or 14.7% of the total market. Meanwhile, the optical devices and equipment sector ranked third, with a market value of U$20.67 billion or 13.1% of the total market value. The optical electronic components sector was in the fourth place, with US$20.15 billion, accounting for 12.7% of the total share. Finally the opto-electronics application sector was the smallest representing only 4.0% in 1998.
The study from the OES report forecasted (as stated in Table 2) that the global opto-electronics market was expected to grow to US$229.9 billion by 2002. A similar market share structure in terms of the market value in each sector was also observed in the projected global market for 2002. The optical information sector was
esti-mated to remain as the dominant category, accounting for 50.6% of the total market value. Next came the optical communication sector, with 20.8% of the total market value for the same year. The report indicated that this business will benefit largely from international efforts to get on the ‘information highway’. Optical elec-tronics components was projected to be in third place, accounting for 13.6% of the total market value for 2002. 1.3. Taiwanese opto-electronics industry
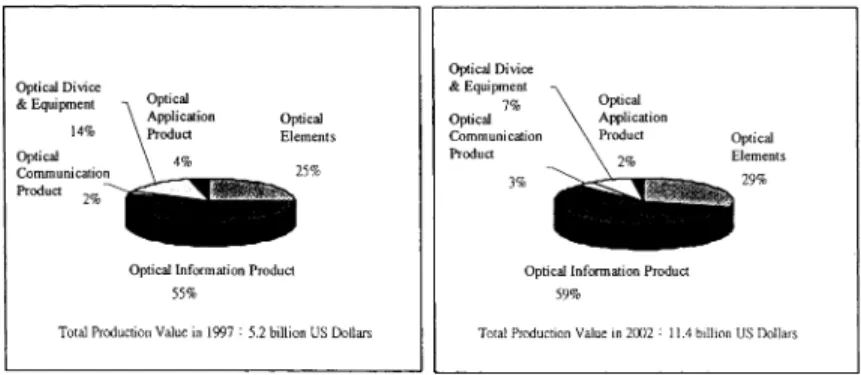
The production value of Taiwanese opto-electronics industry reached up to US$5.8 billion in 1998, growing 11.3% over 1997’s US$5.21 billion, as illustrated in Table 3 (quoted from OES reports; OES/ITRI, 1999). The optical information sector, the largest sector of the five main sectors, had a production value of US$3.52 billion accounting for 60.6% of the total production value in 1998. The optical electronic components sector with US$1.29 billion or 22.2% of the total production value, ranked second. The optical devices and equipment sector with a production value of US$0.65 billion and the opto-electronics application sector with a production value of US$0.19 billion shared 11.2 and 3.3% of the 1998 value, respectively. The smallest sector was optical communication, which was US$0.16 billion or 2.7% of the total shares.
It was estimated by the OES study that the total opto-electronics market could reach US$11.41 billion by 2002 as shown in Fig. 3 (OES/ITRI, 1999). The optical infor-mation sector will remain the largest business accounting for 57.8% of the total market value. Next will come the optical electronic components sector, accounting for 29.4% of the total market value, and the optical device and equipment sector will come third at 7.4%.
In comparison with the numbers between 1997 and 1998 indicated in Table 3, the optical information sector increased 23.2% from 1997 to 1998. Optical electronic components, declined by 1.2% mainly due to the depreciation of the NT dollar in 1998. The normalized growth rate for this part of business should be 15% if it is calculated in NT dollars. Optical devices and equip-ment decreased 1.2%, also due to the currency depreciation problem; its normalized growth rate should be 4.0% if calculated in NT dollars.
A similar pattern could be observed in the global mar-ket as shown in Table 2 when a comparison is made. The optical information sector, the largest sector in Tai-wan, had a 55.6% share of the total market in 1998. The optical communication sector came next, with a market share of 14.7%, and optical devices and equipment came third, with a share of 13.1%. The Taiwanese opto-elec-tronics industry has performed extremely well within the above sectors and is now a global leader in many down-stream application areas, such as CD-ROM, optical disks, and scanners. However, because it is technology
Table 2 Statistical report on the global opto-electronics market (unit: million US$) a Year and product item 1997 S hare 1998 Share 1999 Share 2000 Share (%) 2001 Share (%) 2 002 Share(%) C ompound (%) (%) (%) growth Optical electronic 20755 14.3 20152 1 2.7 21846 12.7 24646 12.9 27627 13.2 31226 13.6 8.5 components Laser emitting 6 085 4.2 6 864 4.3 7831 4.6 8727 4.6 9 381 4.5 10065 4.4 1 0.6 components Light d etecting 7 76 0.5 9 06 0.6 1061 0.6 1262 0.7 1 468 0.7 1686 0.7 1 6.8 components Displaying 13894 9.5 1 2382 7.8 12954 7.5 14657 7.7 16778 8.0 19475 8.5 – components Optical information 80474 55.3 87939 5 5.6 94213 54.8 102271 53.7 109735 52.4 1 16415 50.6 7.7 Optical storage 18963 13.0 21305 1 3.5 24633 14.3 29034 15.2 32523 15.5 3 5363 15.4 13.3 Optical output 51667 35.5 56012 3 5.4 57772 33.6 59955 31.5 62268 29.7 6 4614 28.1 4.6 Optical input 5556 3.8 5 867 3.7 6543 3.8 7268 3.8 8 104 3.9 8728 3.8 9.5 Optical display 4288 2.9 4 755 3.0 5265 3.1 6015 3.2 6 840 3.3 7710 3.4 1 2.5 Optical communication 18905 13.0 23203 1 4.7 27335 15.9 33134 17.4 39775 19.0 4 7783 20.8 20.4 Fiber and optical cable 5808 4.0 6 439 4.1 72*91 4.2 8268 4.3 9 345 4.5 10567 4.6 1 2.7 Optical connector 4 95 0.3 6 09 0.4 749 0.4 921 0.5 1 124 0.5 1371 22.6 Optical active 4 861 3.3 6 431 4.1 7116 4.1 8610 4.5 9 987 4.8 11585 0.6 1 9.0 component Optical passive 541 0 .4 649 0.4 779 0.5 935 0.5 1 169 0.6 1460 5.0 2 2.0 component Optical 7200 4.9 9 075 5.7 11400 6.6 14400 7.6 18150 8.7 22800 0.6 2 5.9
communication equipment Optical
d evice and 19790 13.6 20668 1 3.1 21684 12.6 22767 11.9 23857 11.4 2 5026 9.9 4.8 equipment Optical device 12598 8.7 1 3117 8.3 13713 8.0 14344 7.5 14978 7.1 15656 6.8 4.4 Optical equipment 7192 4.9 7 551 4.8 7971 4.6 8423 4.4 8 878 4.2 9371 4.1 5.4 Opto-electronics 5684 3.9 6 320 4.0 6980 4.1 7724 4.1 8 561 4.1 9477 4.1 1 0.8 application Total 14560 100.0 1 58282 100.0 172057 100.0 190542 100.0 20955 100.0 2 2992 100.0 9.6 a Source: ITIS project, OES/ITRI (1999).
Table 3
Statistical report on the production value of the Taiwanese opto-electronics industry (unit: million US dollars)a
1997 Share (%) 1998 Share (%)
Optical electronic components 1301 25.0 1286 22.2
Laser emitting components 654 12.6 652 11.2
Light detecting components 41 0.8 36 0.6
Displaying components 606 11.6 598 10.3 Optical information 2855 54.8 3518 60.6 Optical storage 1628 31.2 2209 38.1 Optical output 245 4.7 266 4.6 Optical input 966 18.5 995 17.1 Optical communication 127 2.4 159 2.7
Fiber and optical cable 72 1.4 76 1.3
Optical connector 15 0.3 22 0.4
Optical active component 0 0.0 5 0.1
Optical passive component 7 0.1 9 0.2
Optical communication equipment 33 0.6 46 0.8
Optical device and equipment 722 13.8 647 11.2
Optical device 307 5.9 263 4.5
Optical equipment 415 8.0 384 6.6
Opto-electronics application 208 4.0 192 3.3
Total 5123 100.0 5802 100.0
aSources: ITIS project, OES/ITRI (1999). Note: currency exchange rate as per Executive Councils ‘statistic abstract of Taiwan resident’s income’.
and capital intensive, and because of various barriers imposed by communication regulations in Taiwan, the market value of the optical communication sector is rela-tively small in Taiwan, only 2.7% of the total Taiwanese market in 1998 as seen in Table 3, far behind the same sector of 14.7% in the global opto-electronics market shown in Table 2. However, the fact that there are many new investors entering the optical communication sector with competitive product strategy could increase the growth rate for some products under this sector by as much as 25% by year 2002 as projected in the previous study (OES/ITRI, 1999).
Opto-electronics product technologies are now mov-ing towards 3D, full color, multifunction, high speed, high density, compact and smart applications. The government funding research programs are now moving the industry in two major directions: establishing tech-nology related key elements; and integrating the high, intermediate with low-end products. With a rapidly growing multimedia and internet market, new investors are enthusiastically entering this emerging business. It was estimated in the OES report that production for the Taiwanese opto-electronics industry will reach US$11.4 billion by 2002 as demonstrated in Fig. 2 (OES/ITRI, 1999). Out of the five main sectors in the industry, the optical information sector will remain the dominant one with 57.8% of total production value projected to 2002. Optical electronic components will follow, with 29.4%, optical devices and equipment will come next, with a reduced share of 7.4%, and the optical communication sector will increase its share of total market value to 3.3%.
1.4. SWOT analysis of the Taiwanese opto-electronics industry
The strengths, weaknesses, opportunities and threats to the Taiwanese opto-electronics industry, in addition to some statistics data in the previous reports, are sum-marized below as the background for the in-depth analy-sis and survey study.
1.4.1. Strength(S)
앫 Research organizations in Taiwan have sufficient
technical ability, and developing experience in inte-grating optic, mechanic, electrical and material areas.
앫 The existing solid electronic information industry
pro-vides strong support to the development of the opto-electronics business.
앫 Well-educated human workforce.
앫 The strength and potential of the IC industry are
help-ful to high value added development.
앫 Abundant and flexible venture capital available.
1.4.2. Weakness(W)
앫 High technology entry barrier and sophisticated
inte-gration from optical, mechanical, electrical and material engineering.
앫 Less experience in mass-production technology. 앫 Some key elements depend on imports.
앫 Taiwan has a very limited local market for the related
1.4.3. Opportunities(O)
앫 The opto-electronics market has entered its growing
stage, and new application areas are being developed, various products are available, and mainstream pro-ducts offer an attractive market profit.
앫 The energetic and active electronic information
indus-try in Taiwan can support the development of the opto-electronics industry.
앫 The fiber and optical communication components
market grows quickly, with investment it can expand the industry scale and increase competitiveness.
1.4.4. Threats(T)
앫 Taiwan has many key elements depending on imports
from Japan which is leading the industry.
앫 Some developing neighboring countries such as
China, Korea and Malaysia are also aggressively developing the opto-electronics business putting pressure on Taiwan’s industry.
2. Methodology and research structure
It is necessary to have an overview of the method-ologies that could be applied to make projections for the future potential products and applied key technologies in the Taiwanese opto-electronics industry. More details will be made in elucidating the purpose and process using Delphi method in this research. The conclusions and suggestions are available from the in-depth analy-sis afterwards.
2.1. Methodologies
Numerous methods exist for technology forecasting (Cheng et al., 1998). While the forecasting results may appear different as the subject is probed more deeply, or as perspectives/circumstances change as one probes into the subject, or the starting point of a matter or nature varies. Generally, the technology forecasting methods may be roughly classified into the following categories (Porter et al., 1991):
1. “In terms of the forecasting time range taken, two kinds of forecasting methods exist” namely long-range and short-long-range forecasting. Long-long-range
fore-casting usually looks ahead ⬎10 years, while
short-range forecasting usually deals with not more than 1 year ahead. Methods that fall into the middle range are termed intermediate range forecasting.
2. In terms of forecasting scopes, macro-forecasting and micro-forecasting exist. Macro-forecasting generally takes a broad scope, like the constitutional economic system of a country as a whole. The items analyzed
are usually general social indexes, such as production,
consumption, investment, saving and imports–
exports. Naturally, the forecasting results are also somewhat general. Meanwhile, micro-forecasting tar-gets individual manufacturers or consumers within a small area, and the results are very specific. The inter-mediate approach is industry forecasting, which tar-gets a particular industry.
3. In terms of forecasting approach, two kinds also exist,
namely quantitative and qualitative forecasting.
Quantitative forecasting may be further divided into time-sequential or causal forecasting. Methods of quantitative forecasting include moving average fore-casting, exponential smoothing forecasting and simple regression analysis. All of the above quantitative fore-casting methods attempt to reveal the forms of histori-cal data, which are connected by time. In short, the original form of historical data may effect its future outcome. Meanwhile, qualitative forecasting is not influenced by the form of historical documents, nor does it presume that original forms influence future outcome. Qualitative forecasting requires no specific calculation process and does not produce precise fore-casting results. Mostly it relies on experts’ under-standing of certain matters and applies their knowl-edge, intelligence and insight to make a forecast. Owing to the uncertainty and risk of technological trend forecasting, the qualitative approaches are prac-tical here. Since qualitative approaches generally involve instinct, thinking, judgment and accumulated experience, involvement of a panel with special skills is necessary. Common qualitative approaches include the market survey, probabilistic, analogy, Delphi and scenario methods. They are used to make enlightening forecasts (Cheng et al., 1998).
The Science and Technology association of Japan began to study future science and technology forecasting in 1971. The method they most generally employed was the Delphi method (Kuwahara, 1999). This method remains popular for forecasting in Japan, and forecasting results are published every 5 years. Simultaneously many other methods emerged, and are employed to prioritize industries in terms of government investment and highlight the implementing of innovative systems. Among various methods, the Delphi method is the most popular one (Heraud and Cuhls, 1999). The Delphi method is also the most important tool for technology foresight (Grupp and Linstone, 1999).
2.2. Research structure
The Delphi method is applied in this research mainly due to its advantage over the long term qualitative indus-trial forecasting. The study was conducted from Sep-tember 1998 to April 1999 and the process as illustrated in the flowchart of Fig. 1 is detailed below.
Fig. 1. Flow chart of this study.
Fig. 2. Profile of the global opto-electronics industry. Source: ITIS project, OES/ITRI (1999).
Fig. 3. Taiwanese opto-electronics industry. Source: ITIS project, OES/ITRI (1999).
1. The questionnaire was designed.
2. A list of experts was created and experts were invited. The experts who are qualified to make the projections in this study using Delphi method should be pos-sessed of enough knowledge and experiences in the taiwanese opto-electronic industry. Only those who could meet all three criteria below are qualified to be selected.
2.1. The individual must have been employed in a related field for a minimum of 10 years. 2.2. The individual must hold at least a college
degree.
2.3. The individual must have held the position of manager or lead researcher for a research project for a minimum of 3 years.Based on the above
requirements, a team of 11 experts was
organized. Two additional researchers and two statistical analysts were added to make the total number of team members 15.
3. For the first round of questionnaires (from 14 October 1998 to 14 November 1998), the team experts were provided with reference information such as yearly production value of the opto-electronics industry, export value, and growth rate data. The experts then independently provided their forecasting opinions on the topics.
4. For the second round of questionnaires (from 1 December to 31 December 1998), the forecasting
results from the first questionnaire were tabulated. Based on these results, the experts provided their second forecasting opinions.
5. Conclusions: conclusions were drawn after the com-pletion of the final questionnaire. Initial observations of the opinions expressed by the experts indicated clearly that their opinions authentically reflected actual conditions. Moreover, the experts all shared similar opportunities to freely express their opinions.
3. Forecasting analysis
This study employs the Delphi methods for fore-casting, which mainly focuses on the development of the Taiwanese opto-electronics industry up to 2010. The scopes of forecasting are limited to the five products in three main sectors: (1) the products of optical storage; (2) the products of optical output; and (3) optical input products in the optical information sector; (4) the ducts in the optical communication sector; (5) the pro-ducts of LED; and (6) LCD in the optical electronic components sector. The remaining two sectors of optical device and equipment and opto-electronic application are not covered due to their lower impact on the industry. Table 4 lists the statistically calculated results from the survey study. Comments to each product sectors col-lected from the two rounds are also further elucidated and analyzed in terms of their SWOT study resulting in the final recommendations.
3.1. Statistics survey analysis
The study for the six major products in the first round clearly indicated a huge difference in the projections from the base sample numbers of 8–9 in the team as shown in Table 4. A three- or four-folds difference for the maximum and minimum for each product in the study was observed. The second round reduced the dif-ference to two-fold and the contracted numbers of aver-age were transferred to Table 5. The optical storaver-age pro-ducts received the most promising response with the calculated growth rate at 32.3% for 1998–2000 based on the projected fast growing CD-ROM and DVD business. Optical output business was estimated to have a lower growth rate than that of optical input, which is 26.4% by projection. LCD products also receive significant attention from the team giving a growth rate of 29.4% for the same period, due to the inspiring facts that large new investment is undergoing and new plants are expected. The main stream in long term speculation for the period after 2005 is expected to shift gear to optical communication with assumption that this industry will gain a considerable portion of the global optical com-munication market due to the high competitiveness of
active components and passive components from Tai-wanese products.
As projected from this study and shown in Table 4, by 2010 the industry with the highest production value will be optical communication products, whose average growth rate will be ca 21.6%. The sector in the second place will be the optical inputs, with a growth rate of 19.4%.
In addition to the forecasting statistics available from the study, the team also provided their professional com-ments, which are further elucidated in the SWOT study for the six major products.
3.2. Swot study
Comments collected from the survey in terms of the SWOT analysis are elaborated below before the final recommendations are made.
3.2.1. Optical storage products (CD-ROM, VCD, DVD)
3.2.1.1. Opportunities and strength
앫 CD-ROM and VCD will grow rapidly and
signifi-cantly, but DVD will become mainstream in the medium and long term projection. The local CD-ROM manufacturers in Taiwan can enter the DVD market through their competitive advantage in the existing channels.
앫 Key components are being gradually moved to local
production, giving Taiwanese manufacturers a com-petitive advantage over their competitors in South Korea.
앫 Taiwan has already established the capability of
rap-idly developing new products in the PC Industry.
3.2.1.2. Threats and weakness
앫 As the market matures, Japanese companies normally
move their production lines to Mainland China and Southeast Asia, creating price competition problems.
앫 Mainland China is already capable of producing VCD
products, especially in the field of man–machine interfaces and voice treatments.
앫 The impact of regional protectionism in the EU and
US.
앫 Independent fundamental R&D capability in Taiwan
has not been established.
3.2.2. Optical output (MFP, printers and consumables)
3.2.2.1. Opportunities and strengths
앫 With fax machine market growth in Taiwan slowing
Table 4 Growth rate forecasting survey study o f each sector in opto-electronics industry a Year 1998 – 2000 2001 – 2005 2006 – 2010 Item Max. Min. Average Mid S D E ffi cient o f S ample M ax. Min. Average M id SD Ef fi cient of Sample M ax. M in. Average M id SD Ef fi cient o f S ample deviation base deviation base deviation base (%) (%) (%) Optical storage First round 50 20 30.9 30 10.04 3 2 9 60 15 25.56 20 14.24 5 6 9 40 10 20.13 1 6 11.99 60 8 Second round 50 25 32.3 30 7.96 25 8 3 5 2 0 2 4.63 24 5.45 22 8 2 5 1 5 1 8.75 18 4.23 23 8 Optical o utput First round 25 3 1 5.4 1 5 6 .19 4 0 8 30 3 1 7.88 18 8.71 49 8 3 0 3 15.7 12 9.57 61 7 Second round 20 10 15.6 15 3.20 21 8 2 0 1 2 1 6.50 15 3.07 19 8 2 0 1 0 1 3.7 1 4 3 .88 2 8 8 Optical input First round 38 10 27.3 30 8.89 33 8 6 0 1 0 2 5.63 23 15.22 5 9 8 40 8 2 1.14 20 11.44 54 7 Second round 30 15 26.4 29 5.71 22 8 4 0 2 0 2 5.25 25 6.36 25 8 2 5 1 5 1 9.38 20 4.17 22 8 Optical communication First round 40 8 2 5.8 3 0 1 0.97 4 3 9 40 10 23.89 25 8.94 37 9 3 0 6 21.22 2 5 8 .84 4 2 9 Second round 30 15 24.6 28 6.52 26 8 3 0 2 0 2 3.75 25 3.54 15 8 2 5 1 5 2 1.63 23 3.93 18 8 LED First round 28 5 1 7.9 2 0 8 .05 4 5 9 30 5 1 8.89 20 9.28 49 9 3 5 3 19.5 20 10.73 55 8 Second round 25 10 18.1 20 5.79 32 8 2 5 1 0 1 7.88 15 5.51 31 8 2 5 8 17.25 1 8 5 .12 3 0 8 LCD First round 50 15 29.1 30 11.59 4 0 9 35 8 2 4.10 28 9.13 38 8 3 5 8 22.25 2 3 8 .48 3 8 8 Second round 40 20 29.4 30 5.83 20 9 3 5 1 5 2 4.00 25 6.46 27 9 3 0 1 4 2 1.0 2 0 5 .02 2 4 9 a Max, maximum of the compound annual growth rate forecast by experts; min, minimum of the compound annual growth rate forecast by experts; average, ave rage of the compound annual growth rate forecast by experts; mid, median taken from the list sorted according to the experts ’ forecast values; coef fi cient of variation, C V = (s /x ) × 100%. In this investigation, CV is ideal if ⬍ 30%; ⬍ 50% is also acceptable; ⬎ 50% shall be supplied with specialist ’s explanation of the cause.
Table 5
Projected average growth rate of Taiwanese opto-electronics industry (unit: %) Year item 1998–2000 2001–2005 2006–2010 Optical storage 32.3 24.6 18.8 Optical output 15.6 16.5 13.8 Optical input 26.4 25.3 19.4 Optical communication 24.6 23.8 21.6 LED 18.1 17.9 17.3 LCD 29.4 24.0 21.0
have gradually become mainstream instead, so opportunity should exist to develop this area.
앫 The market for printer consumables, such as
car-tridges, has development potential.
앫 With the establishment of industries such as fax
machines and scanners, the opportunities for entering the MFP and printer industries are much greater and easier.
3.2.2.2. Threats and weakness
앫 The printer industry is a monopoly market, so it is
difficult for Taiwan to enter.
앫 Patent problems cannot be solved and so it is very
difficult to develop printers and MFP.
앫 Product brand image must be developed.
앫 Taiwan’s precision machinery industry remains
unde-veloped, and there is a lot of work to do in this area.
3.2.3. Optical input (PC camera, digital cameras and digital photography)
3.2.3.1. Opportunities and strengths
앫 The PC camera business has great potential if the
communication infrastructure is improved
앫 Digital cameras are gradually developing, and
opport-unities should appear given the existing basis of Tai-wan’s camera and scanner industries.
앫 PC collocation rate of scanners is gradually
increas-ing.
앫 The development opportunities for digital photograph
products may be improved by the support of a well developed output and storage device industry, and by rapid developments in key component techniques.
3.2.3.2. Threats and weakness
앫 The scanner market is mature, limiting its growth. 앫 The key components rely on imports.
앫 Market order in the Taiwanese scanner business is
confusing. Competition through price cuts damages the scanner industry.
앫 Strong competition from Japan
3.2.4. Optical communication [passive and active elements, DWDM (dense wavelength division multiplexer)]
3.2.4.1. Opportunities and strengths
앫 Products such as passive elements and light
connec-tors have already formed good local bases, so they should develop significantly.
앫 The US, EU and Japan have monopolized product
specifications, because local technique development started late. However, the related techniques have already been developed in Taiwan, making it possible to enter the industries of passive elements and active elements.
앫 DWDM is the key for large scale information
trans-mission which is a high growth market.
3.2.4.2. Threats and weakness
앫 Communication infrastructure in Taiwan needs
improvement.
앫 Only low-end products such as cable and wire exist
in the Taiwanese market. High-end communication products still depend on imports. No mechanism of system integration exists for Taiwan’s light communi-cation industry.
앫 Taiwan’s domestic market is too small, and
Tai-wanese manufacturer’s capability for international market competition is weak. Thus Taiwan is very dependent on the markets of Mainland China and Southeast Asia.
3.2.5. LED (white light LED, blue light LED, high brightness LED)
3.2.5.1. Opportunities and strengths
앫 With the government’s long-term investment in
tech-nological development programs, the epitaxial kernel technique has being established.
앫 The construction of the LED industry structure has
been gradually completed, with the effect that the medium-end of the epitaxial industry has strengthen-ed.
앫 The capacity put into the medium- and high-end of
this industry will become influential and the appli-cation of lower-end products will continue to expand.
3.2.5.2. Threats
앫 Taiwan remains focused on low-end processes and
encapsulation techniques, and is dependent on the imported high-end materials from USA and Japan suppliers.
been transferred to Mainland China, which will become Taiwan’s major competitor.
3.2.6. LCD (large size TFT-LCD, low temperature multi-crystal silicone)
3.2.6.1. Opportunities and strengths
앫 The techniques of Japanese companies have been
transferred to Taiwanese manufacturers, and several local companies have already entered this area and thus the industry should develop significantly.
앫 The market of small sized applications for projection
TVs remains in its initial stage.
앫 The portable consumption market is booming. 앫 The market of high-end key material is gradually
for-ming.
3.2.6.2. Threats and weakness
앫 Lack of necessary techniques.
앫 Japan and Korea will not give up their TFT advantage
easily. Meanwhile, the low price strategy of South Korea and high quality strategy of Japan have strong impact on Taiwanese related business.
앫 Japanese supply is necessary for preliminary key
components.
앫 Taiwan has overcapacity problems in the LCD
indus-try.
3.3. Recommendations
On the basis of SWOT analysis, the targets for each product or sector could be further contracted and details for recommendations are as follows.
3.3.1. Optical storage products
앫 HD-DVD is the main product in this segment. 앫 Improve R&D ability, participate in global activities
in discussion for new standard setting, and strive to cooperate with Japanese companies.
앫 Good control of key component sources, building
mass production technology and quantity purchase ability. It is predicted that the DVD mechanism is to (5–10 years) be changed into a blue light laser system which needs more attention in Taiwanese future development plans.
앫 Assist manufacturers to participate in DVD
authenti-cation.
앫 Actively enter alliances with global multimedia
com-panies, participate in brand image establishment in local markets and enter the Mainland Chinese market with an own-brand image.
3.3.2. Optical output
앫 MFP is the development target.
앫 With the tendency for high brand loyalty for optical
output products in this market, Taiwan should initially develop digital cameras and sell photo-printers to establish a base. Then, Taiwan can gradually develop the high quality and reliable bubble and laser printer systems (including mechanical parts).
앫 Invest in developing key components and printer
con-sumables to establish related industries.
앫 To strengthen system integration technology and enter
high quality color printing products.
앫 To increase fax machine transmission speed and
improve transmission quality.
앫 To develop the new bubble printer heads, or OEM
for famous brand companies with patent rights.
3.3.3. Optical Input
앫 3D Scanner, web camera and DVC (digital video
camcorder) are the main products in this category.
앫 To develop market separation of digital cameras. 앫 To strengthen CMOS development and increase the
ratio of locally made key components.
앫 DVC can be sold for daily life consumption related
products and in marketing with multimedia devices.
앫 Investment in 3D-color scanner system development
should be undertaken.
앫 Image treatment skills should be cultivated.
앫 Integrate sensor technologies for high quality digital
image processing and lightweight mechanisms.
3.3.4. Optical communication
앫 With the fast growing demand in the bandwidth of
data communication, Terabit Ethernet, fiber to the home (FTTH), and fiber to the desk (FTTD) are pro-posed as the major business directions from the study.
앫 Look for OEM opportunities, or enter the
inter-national market by merging with overseas companies.
앫 Deregulate the public communications regulatory to
enhance international competitiveness.
앫 Resort to overseas large companies for systematic
integration opportunities.
앫 Enter the market through the key components sector. 앫 Prioritize mass-production of high value added
pro-ducts (such as fiber transmitters).
앫 Need more effort to develop DWDM which is
nor-mally integrated with some large communications equipment, making it important to enter a captive market of larger equipment manufacturers.
3.3.5. LED
앫 Target developing the brightness of LED.
pro-duce LED low-end products, but the core technology of the intermediate class products must remain in Tai-wan.
앫 Taiwan should actively and independently develop
new techniques and patents, then negotiate with over-seas manufacturers for licenses and cross-licenses.
앫 Enhance international cooperation and solicit
over-seas hi-tech talent LED. AlGaInp (I) technology has been fully mastered with the recent new development resulting in the expansion of the red LED market share. Blue and green LED GaN products should be the major research targets in the coming decade.
앫 Develop high light blue and green LED
3.3.6. LCD
앫 large size TFT-LCD, low temperature multi-crystal
silicone should be in the main products.
앫 Establish a supply source of local TFT-LCD
periph-eral components.
앫 To participate actively in substitution mass production
technology (such as FED).
앫 Develop mini polyps LCD and Single X’tal LCD used
in projection display.
앫 Start developing mass production techniques for
sin-gle-crystal TFT-LCD to meet the growing demand of the reflective projection display market.
앫 Taiwan possesses excellent production techniques in
semi-conduction IC industry which is a plus in developing the LCD production technique. It is poss-ible that these techniques could also support the development of projection display and head mount display.
4. Conclusions and suggestions
Conclusions and recommendations to each of major six series of products under this study are proposed based on the projected statistics survey and in-depth SWOT analysis input from the team. In the optical infor-mation sector, optical storage products could focus on DVD, which attracted most attention from the team. MFP of the optical output products are the mainstream development for integrated features. For the optical input business, 3D-image pickup devices, such as 3D scanners, and web cameras and DVCs have potential for expan-sion. Terabit Ethernet, FTTH, and FTTD point the way for future development in the optical communication sector. In the optical electronic sector, high brightness, such as white light, should be the direction for develop-ment in the aspect of LEDs, whereas large size TFT-LCD and low temperature P-Si products are the way to go for the LCD market.
References
Cheng, C.I., Yu, S.J., Hsu, G.I., 1998. The Theory of Technology Man-agement. Wu Nan, Taipei, pp. 79–90.
Cheng, C.L., 1999. The Investigation of Taiwan’s Optical Semicond-uctor Industry. OES/ITRI, Taiwan, pp. 25–32.
Disk/Trend Inc, 1998. Disk/Trend Report: 0ptical Disk Drives. Disk/Trend Inc, USA.
Fujiwara, 1999. Scenario of Optical Disk Growth. Fujiwara, Japan. Grupp, H., Linstone, A.H., 1999. National technology foresight
activi-ties around the globe. Technological Forecasting and Social Change 60 (1), 85–94.
Heraud, J.A., Cuhls, K., 1999. Current foresight activities in France, Spain, and Italy. Technological Forecasting and Social Change 60 (1), 55–70.
Huang, C.C., 1999. The Investment Opportunity Survey of Taiwan’s Printer Industry-Inkjet and Therma. OES/ITRI, Taiwan, pp. 87–93. Kuwahara, T., 1999. Technology forecasting activities in Japan.
Tech-nological Forecasting and Social Change 60 (1), 5–14.
Lai, Y.W., 1999. The Investigation of Input Industry. OES/ITRI, Tai-wan, pp. 25–40.
Lyra Research, 1999. Observer, Supply, IAS, DPS Report. Lyra Research, USA.
OES/ITRI (Opto-Electronics and Systems Laboratories/Industrial Technology Research Institute), 1999. The Investigation of Optical Electronic Industry. OES/ITRI, Taiwan.
Porter, A.L., Roper, A.T., Mason, T.W., 1991. Forecasting and Man-agement of Technology. Wiley, New York, pp. 200–220. The Optical Industry and Technology Association, 1999. The Market
and Forecast of Optical Industry, Japan, pp. 8–14.
Tseng, S.H., Chung, C.Y., 1999. The Investigation of DVD Drive Industry. OES/ITRI, Taiwan, pp. 30–34.
Tsou, Y.I.L., Chao, C.Y., 1999. The Investigation of Taiwan’s Display Industry. OES/ITRI, Taiwan.
Yeh, C.C., 1999. The Investigation of Optical Communication Indus-try. OES/ITRI, Taiwan, pp. 53–68.
Pao-Cheng Chang received a BS degree in Chemical Engineering in 1974 from Taipei Institute Technology, and an MSc in paper-making Engineer-ing in 1988 from the Chinese culture university. In 1976, he joined the Bureau of Commodity Inspection and Quarantine Ministry of Economic Affairs (MOEA). In 1989, he moved to the Industry Development Bureau, MOEA. He is currently a chief secretary at this Bureay, a Ph.D. candidate at the Institute of Management of Technology, National Chiao Tung Uni-versity in Taiwan. His major research interests are planning industrial planning, R&D policy and performance evaluation, project management and industrial development forecasting.
Nien-Tao Tsou received a BSc degree in Aeronautical Engineering from Tarn Kang University in 1983. In 1986, he joined the Industrial Tech-nology Research Institute’s (ITRI) Mechanical Industry Research Labora-tory, where he currently works at the Info System Development Division II as a director.
Benjamin J.C. Yuan graduated from the State University of New York at Buffalo in 1978 with a Ph.D. degree in Electrical Engineering. He pur-sued an industrial career with a multinational minicomputer company with a wide range of technical and international marketing management responsibilities in the USA. He joined National Chiao Tung University and setup the first Institute of Management of Technology in Taiwan. He served as a visiting scholar of the Center for Technology, Policy and Industrial Development, Massachusetts Institute of Technology, 1996–97. He served as a visiting scholar in London invited by the British Royal Society and studied the topic on technology foresight in summer 1999. His research interests focus on technology forecasting and assessment, project management, R&D performance evaluation, technology foresight and incubators.
Cul-ture University in 1981. In 1982 she joined the Industrial Technology Research Institute’s (ITRI) Mechanical Industry Research Laboratory,
where she currently works at the Opto-Electronics and Systems Laboratory as an industry analyst.