國立交通大學
生物資訊研究所
碩 士 論 文
以計算方法探討抗氧化能力在補陽類中藥的
補益機轉中之角色
Computational characterization of the role of antioxidant
potential in the tonifying mechanism of
Yang-invigorating Chinese tonifying herbs
研 究 生:朱昭昉
指導教授:黃憲達 博士
以計算方法探討抗氧化能力在補陽類中藥的
補益機轉中之角色
Computational characterization of the role of antioxidant
potential in the tonifying mechanism of
Yang-invigorating Chinese tonifying herbs
研 究 生:朱昭昉
Student:Chao-Fang Chu
指導教授:黃憲達
Advisor:Hsien-Da Huang
國 立 交 通 大 學
生 物 資 訊 研 究 所
碩 士 論 文
A ThesisSubmitted to Institute of Bioinformatics College of Biological Science and Technology
National Chiao Tung University in partial Fulfillment of the Requirements
for the Degree of Master
in
Bioinformatics
July 2009
Hsinchu, Taiwan, Republic of China
中華民國九十八年七月
i
以計算方法探討抗氧化能力在補陽類中藥的
補益機轉中之角色
學生:朱昭昉
指導教授:黃憲達
國立交通大學 生物資訊研究所 碩士班
摘要
補益類中藥分為四類:補陰(Yin-nourishing)、補陽(Yang-invigorating)、 補氣(Qi-invigorating)以及補血(Blood-enriching)。補陽類與補陰類中藥的特 性,目前已知分別為刺激 ATP 的產生(ATP generation)以及免疫的調節作用 (immunomodulatory activity)。然而,在補陽藥中卻發現了高度的抗氧化能力, 而抗氧化能力被認為是一種陰的特性。這不合直覺,並且一直是個不解之謎。 在尋找補陽與補陰本質的過程中,在補陽藥裡並未找到共同的化合物,亦即 能代表補陽作用的化合物。在我們使用支持向量機(SVM)的機器學習方法中, 有一衍伸性的特徵,也就是每單位酚類化合物的 ex vivo(生物組織內、生物體之 外)的抗氧化能力,可用來區分補陽藥與補陰藥。這顯示補陽藥、補陰藥本質上 的差別,是在其單位抗氧化物質的 ex vivo 抗氧化能力。為了探討在粒線體中抗 氧化能力以及生產 ATP 兩者之間的因果關係,以經過驗證之粒線體數學模型進行 了模擬實驗,其模型範圍是粒線體的能量流轉以及自由基的代謝。粒線體系統的 數學模型及代謝控制分析(MCA)之結果均指出,抗氧化作用對於 ATP 產生速 率的影響有限。 本研究測試了抗氧化能力與產生 ATP 的因果關係;提出了一個全新的生化 特徵,可用以區分補陽類與補陰類中藥;並且提出了補陽、補陰類中藥在中醫藥 典中之所以被分為該類的可能原因。本研究的結果也顯示,現代中醫藥研究若要 發掘出中醫藥的內在意義,必須築基於足夠的細胞或生理背景上。ii
Computational characterization of the role of antioxidant
potential in the tonifying mechanism of Yang-invigorating
Chinese tonifying herbs
Student:
Chao-Fang
Chu
Advisor:
Dr.
Hsien-Da
Huang
Institute of Bioinformatics and Systems Biology
National Chiao Tung University
ABSTRACT
Chinese tonifying herbs are classified into four categories: Yin-nourishing, Yang-invigorating, Qi-invigorating and Blood-enriching. Yang- and Yin-tonifying herbs are known to promote ATP-generation and exhibit immunomodulatory activity respectively. However, the high antioxidant activity, a supposedly Yin property, in Yang-tonifying herbs was counter-intuitive and remained an unresolved question.
In search of the essence of being Yang- and Yin-tonifying, common compounds present in and thus representative of Yang-tonifying herbs were not found. In our machine learning approach using support vector machine (SVM), the derived feature of ex vivo antioxidant activity divided by unit phenolic content was able to distinguish Yang- from Yin-tonifying herbs, suggesting that it is ex vivo antioxidant activity per unit antioxidants that is essentially different between Yang- and Yin-tonifying herbs. To characterize the causal relationship between antioxidant activity and ATP generation within mitochondria, simulations were performed using a validated mathematical model of mitochondrial energetics with ROS metabolism. Both mathematical modeling and metabolic control analysis (MCA) of the mitochondrial system showed a limited influence of antioxidation on ATP generation rate.
In the present study, the causal relationship between antioxidant activity and ATP-generation is examined, a novel biochemical feature distinguishing between Yang- and Yin-tonifying herbs presented, and a possible explanation of Yang- and Yin-tonifying herbs being categorized as such in TCM pharmacopoeia proposed. Results from this study also suggest that modern TCM investigations, in terms of TCM’s essence, should be fruitful only if they are based on sufficient cellular or physiological context.
iii
誌謝
這篇碩士論文的完成,首先要感謝我的指導教授 黃憲達老師。我從老師 身上學到最多的是何為「研究的邏輯」及如何「解釋研究的價值」。碩士班的頭 兩個學期,我各在不同的研究題目上花了許多時間,看似走了許多冤枉路,卻累 積了許多經驗。感謝老師一直相當支持我的想法,給我許多鼓勵與自由,去探索 我有興趣的主題,甚至是我論文中這個實驗室裡沒有人接觸過的主題。還要感謝 交大生資所的楊騰芳老師,及陽明大學傳統醫學研究所的黃怡超老師,撥冗閱讀 我的論文提案,提出重要的建議。 感謝宗夷學長,在我還是大學專題生時,就解答我許多問題,並帶我認識了 生物資訊的核心概念;感謝文綺學姐,在很多緊要關頭,提供相當專業的建議以 及溫柔的關心;感謝豐茂學長,在待人方式、處事態度和研究習慣上,親自作了 好榜樣給我非常多指教;感謝助理憶汝,在許多事務上積極協助與提醒我。感謝 雯玲學姐、熙淵學長、博凱學長、威霽學長、佳宏學長、勝達學長,願意在我研 究上有疑難雜症時伸出援手;感謝同實驗室的煒志、恆毅、致宏,以及生資所其 他同學的同窗之誼。 感謝父母的養育照料,也幫我分析進退兩難的情況,還有在心理上的全力支 持,讓我能順利完成研究所的學業。 感謝新竹市教會的弟兄姊妹們長久的扶持、包容以及代禱,讓我在新竹能安 家,能領略基督的闊、長、高、深以及那超越知識的愛。感謝我的好同伴文凡, 還有宗穎、家胤、達恩等幾位兄長的幫助與陪伴;還要感謝盧正五弟兄、譚昌琳 弟兄、陳富強老師、李崇仁老師、吳耀銓老師,以及諸多未能提及的長輩們,在 我就學的這段日子,如親人般地照顧我這樣一個不夠成熟、缺乏智慧的年輕學 生。 最後要感謝網路上許多研究中醫的同好,與我一同切磋中醫藥方面的知識, 尤其是幫助我認識正統中醫的 d 學長。衷心希望以上所提及的大家,都能有健康 的身心,人生路上滿有亮光與祝福。 國立交通大學 生物資訊研究所 碩士班研究生 朱昭昉 謹誌於 整合系統生物學實驗室(ISBLAB) 2009/7/24iv
TABLE OF CONTENTS
摘要 ... i ABSTRACT ... ii 誌謝 ... iii TABLE OF CONTENTS ...iv TABLES ... vii FIGURES ... ix CHAPTER 1 INTRODUCTION ... 1 1.1 Background ... 1 1.1.1 Yin vs. Yang: Core Theory in Traditional Chinese Medicine ... 1 1.1.2 Pharmacological Basis of Chinese Tonifying Herbs ... 1 1.1.3 Mitochondrial Energy Metabolism and Its Mathematical Models ... 3 1.2 Motivation ... 51.2.1 The Counter‐intuitive Presence of Antioxidant Potentials in Yang‐tonifying Herbs ... 5 1.2.2 Unresolved Systemic Roles of Antioxidant Potential in Yang‐tonifying Herbs ... 5 1.2.3 Summary... 6 1.3 Research Goals ... 7 CHAPTER 2 MATERIALS AND METHOD ... 8 2.1 Data Mining of Common Compounds Using Decision Tree ... 9 2.1.1 ID3 Decision Tree Algorithm ... 9 2.1.2 Data collection and preprocessing ... 10 2.1.3 Classification ... 12 2.2 Data Mining of Useful Features Using Support Vector Machine ... 13 2.2.1 Support vector machines ... 13
v 2.2.2 Data collection ... 14 2.2.3 Data preprocessing ... 15 2.2.4 Defining and Computing Derived Features ... 18 2.2.5 Filling in missing values ... 22 2.2.6 Implementation ... 27 2.3 Sensitivity Analysis by Computational Modeling ... 28 2.3.1 Scope of the Model ... 28 2.3.2 Sensitivity Analysis: Perturbation Studies ... 30 2.3.3 Implementation ... 31 2.4 Metabolic Control Analysis ... 32 2.4.1 Rationale ... 32 2.4.2 Implementation ... 33 CHAPTER 3 RESULTS ... 35 3.1 Finding Common Compounds of Yang‐tonifying Herbs by Decision Tree... 35 3.2 Finding Significant Features Shared by Yang‐tonifying Herbs by SVM ... 36 3.3 Sensitivity Analysis by Computational Modeling of the Mitochondrial System 38 3.3.1 Perturbations of [H2O2], [O2.‐]i and [O2.‐]m respectively ... 38
3.3.2 Perturbation of two and three metabolites at a time ... 43 3.4 Finding the Effects of Antioxidation on the Mitochondrial System by MCA ... 46 CHAPTER 4 DISCUSSION ... 52 4.1 Absence of Common Active Compounds Responsible for Yang‐tonifying Actions ... 52 4.2 New Insights from Data Analysis ... 52 4.3 Limited Influence Over ATP Generation By Antioxidation ... 56 4.4 Control Over ATP Synthesis Is Evenly Distributed In Mitochondria ... 57 CHAPTER 5 CONCLUSION ... 58 5.1 Summary of Procedures and Results ... 58
vi
5.2 Goals Achieved and Major Contributions ... 58
BIBLIOGRAPHY ... 60
APPENDIX A List of Chemical Compounds Found in 65 Chinese Herbs ... 64
vii
TABLES
Table 1. Forty Chinese tonifying herbs of which the chemical compounds were
collected and analyzed for association with the category of tonifying actions. . 11
Table 2. Sources of raw data that are subject to data preprocessing and analysis. .... 15
Table 3. Original data of total phenolic content sorted in descending order. Yang-tonifying herbs are colored red and Yin-tonifying herbs colored blue. .... 16
Table 4. Original data of total antioxidant power sorted in descending order. Yang-tonifying herbs are colored red and Yin-tonifying herbs colored light blue. ... 17
Table 5. Original data of glutathione regeneration capacity sorted in descending order. Yang- and Yin-tonifying herbs are colored red and light blue respectively. ... 19
Table 6. Unit in vitro antioxidant activity list in descending order. ... 20
Table 7. Unit ex vivo antioxidant activity listed in descending order. ... 21
Table 8. Physiological factor listed in descending order. ... 22
Table 9. Original data of ATP generation capacity by each ... 22
Table 10. Description of the total 11 features of after data processing. ... 24
Table 11. Dataset for SVM classification with attribute means used to fill in missing values. All original data were normalized. ... 25
Table 12. Dataset for SVM classification with attribute medians used to fill in missing values. All original data were normalized. ... 26
Table 13. Summary of inputs and outputs in the sensitivity analysis performed. ... 31
Table 14. Results of ID3 decision tree learning in order to find common compounds in Yang-tonifying herbs. ... 35
viii
features. ... 37
Table 16. Summary of sensitivity analysis of ROS inputs on VATPase outputs. ... 45
Table 17. Elasticities (scaled) from metabolic control analysis of the system under
study. ... 47
Table 18. Flux control coefficients (scaled) from metabolic control analysis of the
system under study. ... 48
Table 19. Concentration control coefficients (scaled) from metabolic control analysis
of the system under study. ... 50
Table 20. The biochemical features that characterize Yin- and Yang-tonifying herbs.
... 53
ix
FIGURES
Figure 1. The currently accepted anti-aging rationale of Chinese tonifying herbs. (Ko
and Leung, 2007) ... 2
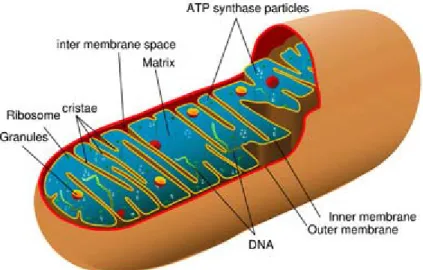
Figure 2. Simplified structure of a mitochondrion. This is a public-domain image. ... 3
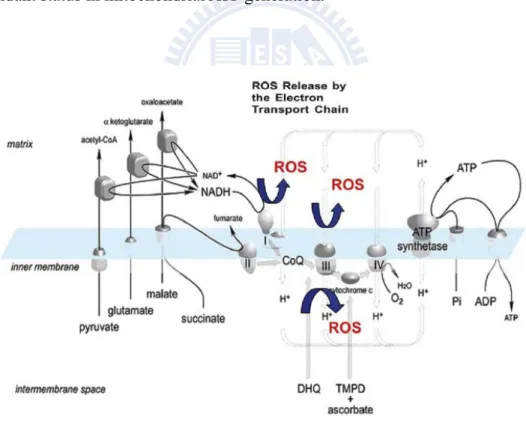
Figure 3. The integration of steps necessary for oxidative phosphorylation and the generation of ROS. (Sedensky and G. Morgan, 2006) ... 4
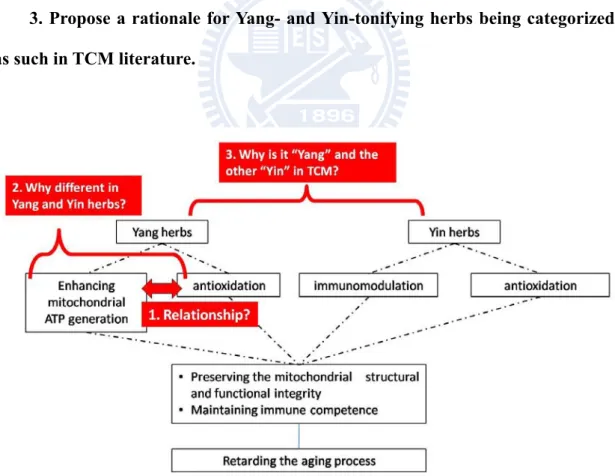
Figure 4. Research goals in the present study: answering these specific questions. ... 7
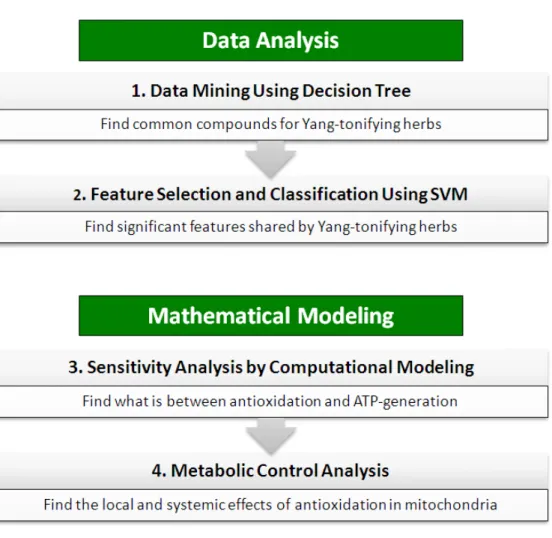
Figure 5. Scheme of analysis on the role of antioxidant activity in Yang-invigorating Chinese tonifying herbs. ... 8
Figure 6. An example of decision tree. A public-domain image. ... 9
Figure 7. ID3 decision tree algorithm (Han and Kamber, 2001) ... 10
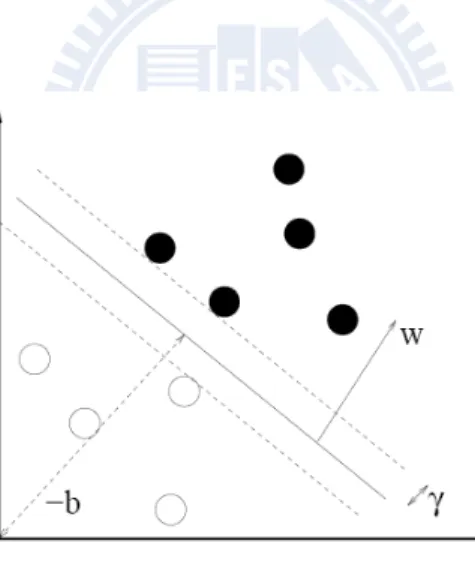
Figure 8. Definition of the margin in SVM learning method (Fradkin and Muchnik, 2006). White and black dots represent data from different classes. ... 13
Figure 9. Diagram of Cortassa’s previous model of mitochondrial energetics and calcium dynamics, before extension with ROS metabolism (Cortassa et al., 2003). ... 29
Figure 10. Diagram of Cortassa’s model of mitochondrial metabolism extended with ROS production, transport and scavenging (Cortassa et al., 2004). ... 29
Figure 11. VATPase at 0s vs. [H2O2] at 0s. ... 38
Figure 12. VATPase (% change) at 0s vs. [H2O2] at 0s. ... 39
Figure 13. Time-course VATPase vs. [H2O2] at 0s. ... 39
Figure 14. Time-course VATPase (% change) vs. [H2O2] at 0s ... 40
Figure 15. Time-course VATPase vs. [O2.-]c at 0s ... 41
Figure 16. Time-course VATPase (% change) vs. [O2.-]c at 0s ... 41
x
Figure 18. Time VATPase (% change) vs. [O2.-]m at 0s ... 42
Figure 19. Time-course VATPase (% change) vs. [O2.-]m and [H2O2] at 0s. ... 43
Figure 20. Time-course VATPase (% change) vs. [O2]c and [H2O2] at 0s. ... 44
Figure 21. Time-course VATPase (% change) vs. [O2.-]c and [O2.-]m at 0s. ... 44
Figure 22. The excluded possibility of Yang- and Yin-tonifying to stand for a measure of change in unit antioxidation. ... 55
Figure 23. The ideas of Yang- and Yin-tonifying should be considered in a system of living organism to make its sense in TCM. ... 56
1
CHAPTER 1 INTRODUCTION
1.1 Background
1.1.1 Yin vs. Yang: Core Theory in Traditional Chinese Medicine
Traditional Chinese medicine, in its unique understanding of pharmacology and human physiology, has effectively guided Chinese medical practitioners over thousands of years. In the core of TCM is the Yin-Yang theory, representing the dual qualities of matter; and a balance of Yin and Yang is essential to sustain optimal body function, akin to the modern concept of maintaining homeostasis. Counteractive properties such as water, coldness, stillness, inhibition and darkness belong to Yin, whereas those with proactive properties like fire, heat, movement, brightness, outward and upward direction, pertain to Yang (Liu et al., 1995, Ou et al., 2003). One instance to exemplify the Yin-Yang relationship is the association of decreased parasympathetic and sympathetic activities with the deficiency in Yin and Yang respectively in the human body, as shown in a psychophysiological study (Taitano, 2003).
1.1.2 Pharmacological Basis of Chinese Tonifying Herbs
Chinese tonifying herbs, or, according to the WHO International Standard Terminologies on Traditional Medicine in the Western Pacific Region (2007), “tonifying and replenishing medicinals” (code: 6.1.99) are “a category of medicinals
2
that replenish the healthy qi and strengthen the body resistance, used for treating deficiency conditions.”
These herbs are classified in TCM by their health-promoting actions into four tonifying categories: Yin-nourishing, Yang-invigorating, Qi-invigorating and Blood-enriching (Geng and Su, 1991). Yang- and Qi-tonifying herbs are further grouped in to the Yang family, whereas the Yin- and Blood-tonifying herbs are in the Yin family. Because of their potential in anti-aging remedies (Figure 1), much effort has been made to study the pharmacological basis of Yin- and Yang-tonifying herbs. An equivalence of antioxidation-oxidation to the action of Yin- and Yang-tonifying herbs was proposed (Ou et al., 2003), but was not supported by data on DNA protection against oxidative stress (Szeto and Benzie, 2006). Other studies on
Figure 1. The currently accepted anti-aging rationale of Chinese tonifying herbs.
3
Yang-tonifying herbs reported protective effects and enhancement of antioxidant status in human or rats (Mak et al., 2004, Leung et al., 2005, Chiu et al., 2008, Poon et al., 2008), indicating that antioxidant potential plays a physiologically significant role in the actions of Yang-tonifying herbs.
Currently, the characteristic pharmacological property of Yang-tonifying herbs is identified to be enhancement of mitochondrial ATP generation capacity (Yim and Ko, 2002, Ko et al., 2006, Ko and Leung, 2007).
Figure 2. Simplified structure of a mitochondrion. This is a public-domain
image.
1.1.3 Mitochondrial Energy Metabolism and Its Mathematical Models
Mitochondria are the main sites of ATP production in aerobic cells, containing two very different membranes, an outer one and an inner one, separated by the intermembrane space (Figure 2). The mitochondrion is a system with a level of
4
complexity that needs computational modeling to aid in the study of mitochondrial energy metabolism (Wu et al., 2007). Therefore, numerous mathematical models based on experimental data and thermodynamic relations have been proposed (Korzeniewski and Zoladz, 2001, Vendelin et al., 2000, Cortassa et al., 2003, Cortassa et al., 2004, Beard, 2005, Zhou et al., 2005, Cortassa et al., 2006, Wu et al., 2007). Some of these models were expanded and modified, including the one expanded with reactive oxygen species production and scavenging (Cortassa et al., 2004, Cortassa et al., 2006, Wu et al., 2007). Since ROS production and scavenging are closely linked oxidative phosphorylation and hence ATP production (Figure 3), this Cortassa’s model with ROS metabolism would be very valuable in studying the effect of antioxidant status in mitochondrial ATP generation.
Figure 3. The integration of steps necessary for oxidative phosphorylation and
5
1.2 Motivation
1.2.1 The Counter-intuitive Presence of Antioxidant Potentials in Yang-tonifying
Herbs
It is counter-intuitive for antioxidant potentials, which are considered a “Yin” property (Ko et al., 2004), to be present and even prevalent in “Yang”-tonifying herbs. Though antioxidant defense is known to be essential in sustaining mitochondrial ATP-generation (Melov, 2002), it remains a pharmacologically valuable question whether mitochondrial ATP generation is enhanced directly by accelerating the mitochondrial respiratory chain and/or indirectly by boosting mitochondrial antioxidant status (Ko et al., 2004, Ko et al., 2006).
1.2.2 Unresolved Systemic Roles of Antioxidant Potential in Yang-tonifying
Herbs
The source of stimulated ATP generation was reported to be possibly caused by heightened activities of complex I and III (Leung, 2006, Leung and Ko, 2008) and antioxidation was not found to play a primary role in stimulating ATP generation (Ko et al., 2006). However, whether antioxidant potential or varied ROS-scavenging activities may at least play an adjunct role in stimulating ATP generation is still elusive. How is the dynamics of ATP generation affected by an enhanced antioxidant status? What is the systemic role of antioxidation exerted by Yang-invigorating herbs
6
within cells? Such a systems topic is best prospectively addressed in silico, i.e., by computational modeling of the biochemical system of interest. The mathematical model will be described in detail in Materials and Methods.
1.2.3 Summary
In summary, the present study is motivated by (1) that the coexistence of ATP-generation capacity and high antioxidant potentials in Yang-tonifying herbs remains to be reconciled; (2) that a cross-talk and better mutual understanding between Western and traditional Chinese medicine in the science community is necessary; and (3) that identification of the systemic roles of these Chinese tonifying herbs within a particular system (e.g., mitochondria) can provide additional criteria for functional quality assessment of Chinese herbal products.
7
1.3 Research Goals
The following are the three main goals of this study (Figure 4) :
1. Determine the causal relationship between antioxidation and mitochondrial ATP generation; that is, clarify whether antioxidant potential in
Yang-tonifying herbs is simply Nature’s protective measure against oxidative stress created by accelerated ATP synthesis, or is causally related to ATP synthesis.
2. Discover the mechanism behind different antioxidant potentials and ATP generation capacities between Yang- and Yin-tonifying herbs.
3. Propose a rationale for Yang- and Yin-tonifying herbs being categorized as such in TCM literature.
Figure 4. Research goals in the present study: answering these specific
8
CHAPTER 2 MATERIALS AND METHOD
Figure 5. Scheme of analysis on the role of antioxidant activity in
Yang-invigorating Chinese tonifying herbs.
The methods employed in this study are divided into two main parts: data analysis and mathematical modeling. The procedure is summarized in Figure 5.
9
2.1 Data Mining of Common Compounds Using Decision Tree
2.1.1 ID3 Decision Tree Algorithm
Decision tree is the classification method used to find common compounds in Yang-tonifying herbs. The structure of a decision tree is like a flow chart, where each internal node represents a test on an attribute, each branch the test outcome, and leaf nodes are the classes or class distributions (Han and Kamber, 2001). An example is the maximization of pay-off in investment decisions, as shown in Figure 6.
Figure 6. An example of decision tree. A public-domain image.
ID3 decision tree (Quinlan, 1986) is a well-known decision tree algorithm. Its basic strategy can be summarized as follows:
1. Take all unused attributes and calculate their entropies concerning test samples. 2. Choose an attribute for which the entropy is maximum.
3. Create a node that contains the attribute.
10 Algorithm: Generate_decision_tree (ID3). Generate a decision tree from the training data.
Input: The training samples, samples; the set of candidate attributes, attribute-list. Output: A decision tree.
Proecdure:
1. Create a node N.
2. if samples are all of the same class, C then
3. return N as a leaf node labled with the class C; 4. if attribute-list is empty then
5. return N as a leaf node labeled with the most common class in the samples// majority voting
6. select test-attribute, the attribute among attribute-list with the highest information gain; 7. label node N with test-attribute
8. for each known value ai of the test-attribute // partition the samples
9. grow a branch from node N for the condition test-attribute = ai
10. let si be the set of samples in samples for which test-attribute = ai // a partition
11. if si is empty then
12. attach a leaf labeled with the most common class in samples
13. else attach the node returned by Generate_decision_tree(si, attribute-list-test-attribute); Figure 7. ID3 decision tree algorithm (Han and Kamber, 2001)
2.1.2 Data collection and preprocessing
Traditional Chinese Medicine Database System (2007) was accessed for the presence of chemical species in the Chinese tonifying herbs. A large list of chemical compounds associated with 65 Chinese tonifying herbs was collected (Appendix A).
11
The list was then condensed to the compounds present in a total of 40 Chinese tonifying herbs consisting of 9 Yin-, 12 Yang-, 10 Qi- and 9 Blood-tonifying herbs (Table 1), of which the compound data appeared fuller and more credible. Data duplicates and errors, mainly typing errors and confused use of full-form with half-form characters, were manually corrected. In cases of data ambiguities, TCM pharmacopoeia were consulted.
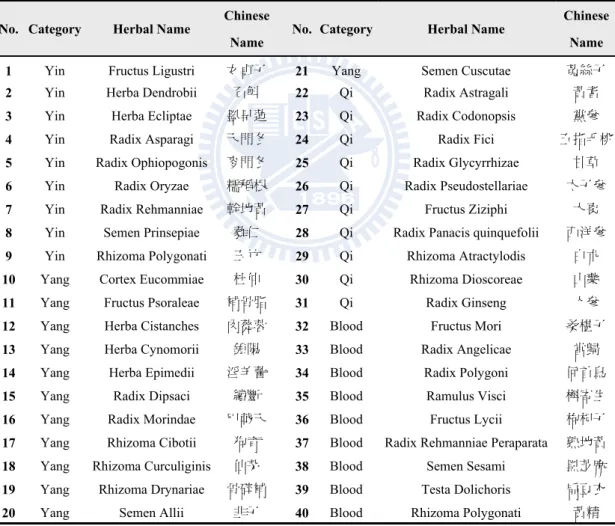
Table 1. Forty Chinese tonifying herbs of which the chemical compounds were
collected and analyzed for association with the category of tonifying actions.
No. Category Herbal Name Chinese
Name No. Category Herbal Name
Chinese Name 1 Yin Fructus Ligustri 女貞子 21 Yang Semen Cuscutae 菟絲子
2 Yin Herba Dendrobii 石斛 22 Qi Radix Astragali 黃耆
3 Yin Herba Ecliptae 墨旱蓮 23 Qi Radix Codonopsis 黨參
4 Yin Radix Asparagi 天門冬 24 Qi Radix Fici 五指毛桃
5 Yin Radix Ophiopogonis 麥門冬 25 Qi Radix Glycyrrhizae 甘草
6 Yin Radix Oryzae 糯稻根 26 Qi Radix Pseudostellariae 太子參
7 Yin Radix Rehmanniae 幹地黃 27 Qi Fructus Ziziphi 大棗
8 Yin Semen Prinsepiae 蕤仁 28 Qi Radix Panacis quinquefolii 西洋參
9 Yin Rhizoma Polygonati 玉竹 29 Qi Rhizoma Atractylodis 白朮
10 Yang Cortex Eucommiae 杜仲 30 Qi Rhizoma Dioscoreae 山藥
11 Yang Fructus Psoraleae 補骨脂 31 Qi Radix Ginseng 人參
12 Yang Herba Cistanches 肉蓯蓉 32 Blood Fructus Mori 桑椹子
13 Yang Herba Cynomorii 鎖陽 33 Blood Radix Angelicae 當歸
14 Yang Herba Epimedii 淫羊藿 34 Blood Radix Polygoni 何首烏
15 Yang Radix Dipsaci 續斷 35 Blood Ramulus Visci 槲寄生
16 Yang Radix Morindae 巴戟天 36 Blood Fructus Lycii 枸杞子
17 Yang Rhizoma Cibotii 狗脊 37 Blood Radix Rehmanniae Peraparata 熟地黃
18 Yang Rhizoma Curculiginis 仙茅 38 Blood Semen Sesami 黑芝麻
19 Yang Rhizoma Drynariae 骨碎補 39 Blood Testa Dolichoris 扁豆衣
12
2.1.3 Classification
ID3 decision tree, an unsupervised learning method, was used as the classifier to find the compounds common in Yang-tonifying herbs. The classification was implemented in Weka, a data mining software in Java (Witten and Frank, 2005). Leave-one-out cross-validation was used (k set to be equal to data size in k-fold cross-validation).
13
2.2 Data Mining of Useful Features Using Support Vector Machine
2.2.1 Support vector machines
Support vector machines (SVMs) are a set of related supervised learning methods used for classification and regression. They are used in a variety of applications such as text classification, facial expression recognition, gene analysis and many others. In SVMs, a special kind of rule called a linear classifier is first constructed, and then classifiers are produced with theoretical guarantees of good predictive performance, i.e., the quality of classification on unseen data. The theoretical foundation of SVMs is given by statistical learning theory. (Fradkin and Muchnik, 2000)
Figure 8. Definition of the margin in SVM learning method (Fradkin and
Muchnik, 2006). White and black dots represent data from different classes.
A number of good reviews of SVMs with theoretical and mathematical details being freely available, a brief description of SVM is as follows (Fradkin and Muchnik, 2006):
14
A hyperplane
, 0; 1
(1) is called γ-margin separating hyperplane if
,
(2) for all , in set S. Here γ (clearly γ > 0) is the margin. Any separating hyperplane can be converted into this form.
Second, if the two classes are separable, maximize the margin. Since the probability of classification error is inversely proportional to the margin size, it is desired that the largest margin be found for a classifier which still correctly separates the training data.
The maximal-margin separating hyperplane can be found by solving the following optimization problem:
Minimizew,b , (3) subject to: , 1, 1, … , (4) 2.2.2 Data collection
Antioxidant activity and related data of Chinese tonifying herbs were collected from literature focused on numerous medicinal plants (Liu et al., 2001, Cai et al., 2006,
15
Wong et al., 2006, Lee et al., 2003, Katalinic et al., 2006, Liao et al., 2007). Sources of raw data from literature are listed in Table 2.
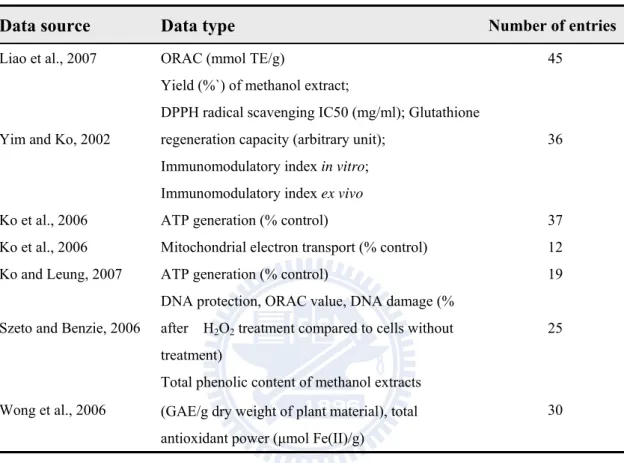
Table 2. Sources of raw data that are subject to data preprocessing and analysis.
Data source Data type Number of entries
Liao et al., 2007 ORAC (mmol TE/g) 45
Yim and Ko, 2002
Yield (%`) of methanol extract;
DPPH radical scavenging IC50 (mg/ml); Glutathione regeneration capacity (arbitrary unit);
Immunomodulatory index in vitro; Immunomodulatory index ex vivo
36
Ko et al., 2006 ATP generation (% control) 37 Ko et al., 2006 Mitochondrial electron transport (% control) 12 Ko and Leung, 2007 ATP generation (% control) 19 Szeto and Benzie, 2006
DNA protection, ORAC value, DNA damage (% after H2O2 treatment compared to cells without
treatment)
25
Wong et al., 2006
Total phenolic content of methanol extracts
30 (GAE/g dry weight of plant material), total
antioxidant power (μmol Fe(II)/g)
2.2.3 Data preprocessing
Discarding features with too few available entries led to a total of 8 features, including DPPH radical scavenging IC50 (mg/ml), glutathione regeneration capacity (arbitrary unit), immunomodulatory index in vitro, immunomodulatory index ex vivo, ATP generation (% control), mitochondrial electron transport (% control), total antioxidant power and total phenolic content. Data duplicates were removed and errors corrected by cross-checking the references.
16
Table 3 shows the original data of total phenolic content of Chinese tonifying
herbs, sorted in descending order. The total amount of phenolics in Chinese medicinal plants (Wong et al., 2006) is generally higher in Yang- than in Yin-tonifying herbs, with one exception being Radix Rehmanniae. Unit of total phenolic content was expressed in gallic acid equivalents(GAE)/g dry weight of plant material. Latin bionomials were used to represent different medicinal plants.
Table 3. Original data of total phenolic content sorted in descending order.
Yang-tonifying herbs are colored red and Yin-tonifying herbs colored blue. Category Herbal Name 中藥名 Total phenolic content (GAE/g Blood Radix Polygoni 何首烏 24.2
Yang Fructus Psoraleae 補骨脂 20.5 Yang Radix Dipsaci 續斷 18.5 Yang Herba Epimedii 淫羊藿 16.8 Yin Radix Rehmanniae 幹地黃 15.8 Qi Radix Glycyrrhizae 甘草 14.5 Yang Herba Cistanches 肉蓯蓉 13 Yang Herba Cynomorii 鎖陽 12.3 Blood Rhizoma Polygonati 黃精 10.3 Blood Fructus Lycii 枸杞子 8.42 Yang Semen Cuscutae 菟絲子 6.69 Yang Cortex Eucommiae 杜仲 4.99 Blood Radix Angelicae 當歸 4.79 Yang Rhizoma Curculiginis 仙茅 4.59 Qi Radix Astragali 黃耆 3.87 Yang Radix Morindae 巴戟天 3.71 Yin Herba Dendrobii 石斛 2.97 Qi Rhizoma Atractylodis 白朮 2.84 Yin Radix Asparagi 天門冬 2.32 Qi Rhizoma Dioscoreae 山藥 1.44 Yin Rhizoma Polygonati 玉竹 1.39 Yin Radix Ophiopogonis 麥門冬 1.31
17
Table 4 shows the original data of total antioxidant power in Chinese medicinal plants (Wong et al., 2006). As can be seen, the total antioxidant power is generally higher in Yang- than in Yin-tonifying herbs, with two exceptions being the Yin-tonifying Radix Rehmanniae and the Yang-tonifying Radix Morindae. Unit of total antioxidant power was expressed in μmol Fe(II)/g dry weight of plant material.
Table 4. Original data of total antioxidant power sorted in descending order.
Yang-tonifying herbs are colored red and Yin-tonifying herbs colored light blue.
Category Herbal Name 中藥名 Total antioxidant power (μmol Fe(II)/g dry weight of plant material) Blood Radix Polygoni 何首烏 302
Yang Radix Dipsaci 續斷 95.6 Yang Herba Epimedii 淫羊藿 81.8 Yang Fructus Psoraleae 補骨脂 72.7 Yin Radix Rehmanniae 幹地黃 67.2 Yang Herba Cistanches 肉蓯蓉 62.8 Yang Herba Cynomorii 鎖陽 51.7 Qi Radix Glycyrrhizae 甘草 32.4 Blood Rhizoma Polygonati 黃精 27.5 Blood Radix Angelicae 當歸 27.3 Yang Semen Cuscutae 菟絲子 21.7 Blood Fructus Lycii 枸杞子 21.7 Yang Cortex Eucommiae 杜仲 20.4 Yang Rhizoma Curculiginis 仙茅 12.3 Yin Radix Asparagi 天門冬 9.3 Yin Herba Dendrobii 石斛 9.3 Qi Radix Astragali 黃耆 9.1 Qi Rhizoma Atractylodis 白朮 9 Yin Radix Ophiopogonis 麥門冬 8.8 Yang Radix Morindae 巴戟天 6.1 Qi Rhizoma Dioscoreae 山藥 4.1 Yin Rhizoma Polygonati 玉竹 3.6
18
Listed in Table 5 are the glutathione regeneration capacities of 41 Chinese
tonifying herbs (Yim and Ko, 2002). Data being also sorted in descending order, Yang- and Yin-tonifying herbs did not seem to differ much in GRC, which represents a measure of an ex vivo antioxidative effect.
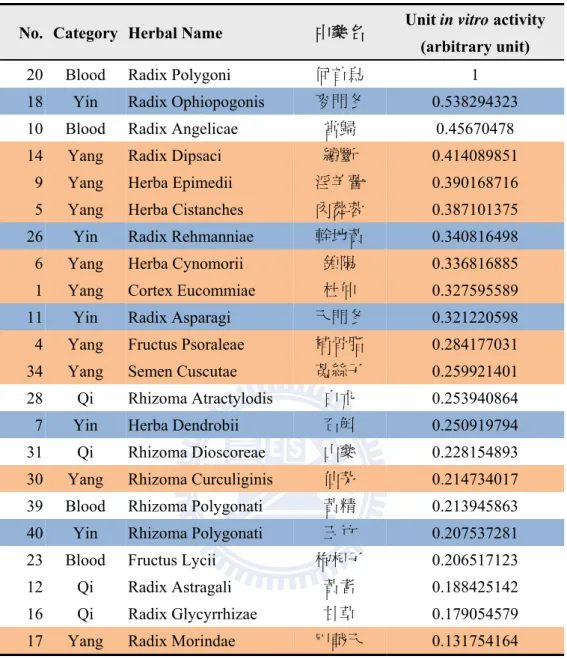
2.2.4 Defining and Computing Derived Features
Since data of antioxidant power in both in vitro and ex vivo conditions and the amount of phenolics—the main source of antioxidants in medicinal plants—are available, a measure of unit antioxidant activity is calculable. Unit antioxidant activities will reflect effects the environment has on the antioxidant power.
The derived features are: (1) unit in vitro antioxidant ability, calculated from total antioxidant power divided by total phenolics; (2) unit ex vivo antioxidant ability, calculated from glutathione regeneration capacity divided by total phenolics; and (3) the “physiological factor,” representing the relative change of antioxidant ability when the environment changes from in vitro to ex vivo, is defined to be the ratio of unit ex vivo over unit in vitro antioxidant ability just computed.
Following normalization of antioxidant activities and amount of phenolics for all the 40 herbs, the derived features were calculated for all entries with sufficient data. To preview their discrimination performance, the data were listed in descending order in Table 6, Table 7, and Table 8, with missing values left untreated until next step.
Among the three derived features, the Yang- and Yin-tonifying herbs form the clearest clusters when sorted unit ex vivo antioxidant activity, as in the case of original data of ATP generation capacity (Table 9).
19
Table 5. Original data of glutathione regeneration capacity sorted in descending order.
Yang- and Yin-tonifying herbs are colored red and light blue respectively.
Category Herbal Name 中藥名 Glutathione regeneration capacity (arbitrary unit) Qi Radix Glycyrrhizae 甘草 1707
Yang Cortex Eucommiae 杜仲 1611 Blood Semen Sesami 黑芝麻 1576 Qi Radix Ginseng 人參 1555 Qi Radix Astragali 黃耆 1550 Yang Herba Epimedii 淫羊藿 1491 Yang Fructus Psoraleae 補骨脂 1491 Yin Fructus Ligustri 女貞子 1482 Yang Radix Dipsaci 續斷 1433 Yin Herba Ecliptae 墨旱蓮 1368 Blood Radix Polygoni 何首烏 1350 Qi Radix Codonopsis 黨參 1348 Qi Fructus Ziziphi 大棗 1318 Blood Testa Dolichoris 扁豆衣 1245 Qi Radix Panacis quinquefolii 西洋參 1225 Qi Rhizoma Atractylodis 白朮 1205 Yin Herba Dendrobii 石斛 1190 Blood Fructus Mori 桑椹子 1184 Blood Radix Rehmanniae Peraparata 熟地黃 1179 Blood Fructus Lycii 枸杞子 1167 Qi Rhizoma Dioscoreae 山藥 1148 Yang Rhizoma Cibotii 狗脊 1129 Qi Radix Pseudostellariae 太子參 1125 Yin Radix Asparagi 天門冬 1121 Yin Radix Ophiopogonis 麥門冬 1106 Yang Radix Morindae 巴戟天 1089 Yin Semen Prinsepiae 蕤仁 1057 Yang Herba Cistanches 肉蓯蓉 1035 Yang Semen Cuscutae 菟絲子 1018 Yang Rhizoma Drynariae 骨碎補 1015 Blood Rhizoma Polygonati 黃精 993
Qi Radix Fici 五指毛桃 982
Blood Ramulus Visci 槲寄生 973 Yin Rhizoma Polygonati 玉竹 969 Blood Radix Angelicae 當歸 721 Yin Radix Oryzae 糯稻根 674
20
Table 6. Unit in vitro antioxidant activity list in descending order.
No. Category Herbal Name 中藥名 Unit in vitro activity (arbitrary unit) 20 Blood Radix Polygoni 何首烏 1
18 Yin Radix Ophiopogonis 麥門冬 0.538294323 10 Blood Radix Angelicae 當歸 0.45670478 14 Yang Radix Dipsaci 續斷 0.414089851
9 Yang Herba Epimedii 淫羊藿 0.390168716 5 Yang Herba Cistanches 肉蓯蓉 0.387101375 26 Yin Radix Rehmanniae 幹地黃 0.340816498 6 Yang Herba Cynomorii 鎖陽 0.336816885 1 Yang Cortex Eucommiae 杜仲 0.327595589 11 Yin Radix Asparagi 天門冬 0.321220598 4 Yang Fructus Psoraleae 補骨脂 0.284177031 34 Yang Semen Cuscutae 菟絲子 0.259921401 28 Qi Rhizoma Atractylodis 白朮 0.253940864 7 Yin Herba Dendrobii 石斛 0.250919794 31 Qi Rhizoma Dioscoreae 山藥 0.228154893 30 Yang Rhizoma Curculiginis 仙茅 0.214734017 39 Blood Rhizoma Polygonati 黃精 0.213945863 40 Yin Rhizoma Polygonati 玉竹 0.207537281 23 Blood Fructus Lycii 枸杞子 0.206517123 12 Qi Radix Astragali 黃耆 0.188425142 16 Qi Radix Glycyrrhizae 甘草 0.179054579 17 Yang Radix Morindae 巴戟天 0.131754164
21
Table 7. Unit ex vivo antioxidant activity listed in descending order.
No. Category Herbal Name 中藥名 Unit ex vivo activity (arbitrary unit) 18 Yin Radix Ophiopogonis 麥門冬 11.96921522 31 Qi Rhizoma Dioscoreae 山藥 11.30215453 40 Yin Rhizoma Polygonati 玉竹 9.883046111 11 Yin Radix Asparagi 天門冬 6.850140396 28 Qi Rhizoma Atractylodis 白朮 6.015206647 7 Yin Herba Dendrobii 石斛 5.680314175 12 Qi Radix Astragali 黃耆 5.678094001 1 Yang Cortex Eucommiae 杜仲 4.576957078 17 Yang Radix Morindae 巴戟天 4.161365047 34 Yang Semen Cuscutae 菟絲子 2.157265038 10 Blood Radix Angelicae 當歸 2.133937012 23 Blood Fructus Lycii 枸杞子 1.964900709 16 Qi Radix Glycyrrhizae 甘草 1.668965517 39 Blood Rhizoma Polygonati 黃精 1.366765062 9 Yang Herba Epimedii 淫羊藿 1.258201523 5 Yang Herba Cistanches 肉蓯蓉 1.128700825 14 Yang Radix Dipsaci 續斷 1.098136449 4 Yang Fructus Psoraleae 補骨脂 1.031111492 20 Blood Radix Polygoni 何首烏 0.79086116
22
Table 8. Physiological factor listed in descending order.
No. Category Herbal Name 中藥名 Physiological factor (arbitrary unit) 31 Qi Rhizoma Dioscoreae 山藥 49.53719977 40 Yin Rhizoma Polygonati 玉竹 47.62058192 17 Yang Radix Morindae 巴戟天 31.58431531 12 Qi Radix Astragali 黃耆 30.1344818 28 Qi Rhizoma Atractylodis 白朮 23.68743084
7 Yin Herba Dendrobii 石斛 22.63796763 18 Yin Radix Ophiopogonis 麥門冬 22.23544762 11 Yin Radix Asparagi 天門冬 21.32534598 1 Yang Cortex Eucommiae 杜仲 13.97136359 23 Blood Fructus Lycii 枸杞子 9.51446875 16 Qi Radix Glycyrrhizae 甘草 9.320987654 34 Yang Semen Cuscutae 菟絲子 8.299682252 39 Blood Rhizoma Polygonati 黃精 6.388368749 10 Blood Radix Angelicae 當歸 4.672464813 4 Yang Fructus Psoraleae 補骨脂 3.6284125 9 Yang Herba Epimedii 淫羊藿 3.224762699 5 Yang Herba Cistanches 肉蓯蓉 2.915775805 14 Yang Radix Dipsaci 續斷 2.651927946 20 Blood Radix Polygoni 何首烏 0.79086116
2.2.5 Filling in missing values
After data cleaning, the 6 features collected from literature plus the 3 derived features led to a final list of 9 features, which are summarized in Table 10. To fill in the missing values, either attribute mean or attribute median was used in the classification, producing two sets of results. Finally, a total of 21 herbs composed of 12 Yang-tonifying herbs and 9 Yin-tonifying herbs with 11 features were prepared for classification. Data with both kinds of filled missing value are shown in Table 11 and
23
Table 9. Original data of ATP generation capacity by each Chinese tonifying
herb (% control).
No. Category Herbal Name 中藥名 ATP generation (% control)
16 Qi Radix Glycyrrhizae 甘草 285
6 Yang Herba Cynomorii 鎖陽 230
34 Yang Semen Cuscutae 菟絲子 222
5 Yang Herba Cistanches 肉蓯蓉 191
4 Yang Fructus Psoraleae 補骨脂 175
1 Yang Cortex Eucommiae 杜仲 157
32 Yang Rhizoma Drynariae 骨碎補 154
30 Yang Rhizoma Curculiginis 仙茅 149
17 Yang Radix Morindae 巴戟天 142
33 Yang Semen Allii 韭子 133
9 Yang Herba Epimedii 淫羊藿 130
3 Blood Fructus Mori 桑椹子 129
10 Blood Radix Angelicae 當歸 126
14 Yang Radix Dipsaci 續斷 120
23 Blood Fructus Lycii 枸杞子 118
26 Yin Radix Rehmanniae 幹地黃 117
20 Blood Radix Polygoni 何首烏 114
12 Qi Radix Astragali 黃耆(黃芪) 110
22 Blood Ramulus Visci 槲寄生 106
38 Blood Testa Dolichoris 扁豆衣 105
40 Yin Rhizoma Polygonati 玉竹 102
18 Yin Radix Ophiopogonis 麥門冬 102
2 Yin Fructus Ligustri 女貞子 101
36 Blood Semen Sesami 黑芝麻 100
11 Yin Radix Asparagi 天門冬 98.2
35 Yin Semen Prinsepiae 蕤仁 95.5
25 Qi Radix Panacis quinquefolii 西洋參 93.5
21 Qi Radix Pseudostellariae 太子參 88.3
24 Qi Fructus Ziziphi 大棗 85.1
19 Yin Radix Oryzae 糯稻根 85
31 Qi Rhizoma Dioscoreae 山藥 84.2
28 Qi Rhizoma Atractylodis 白朮 84.2
7 Yin Herba Dendrobii 石斛 82.7
13 Qi Radix Codonopsis 黨參 81.7
15 Qi Radix Fici 五指毛桃 80.6
24
Table 10. Description of the total 9 features to be classified by SVM.
Feature Biological Meaning Brief Description of Measurement Method Source Reference
1. Glutathione regeneration capacity (arbitrary unit)
Ex vivo antioxidant activity
A mouse model of hepatic glutathione regeneration capacity is used. The prepared hepatic tissue homogenate from treatment and control groups is challenged with tBHP at 0.1 mM, and the time-dependent change in reduced glutathione (GSH) content is monitored.
Experimental Yim and Ko, 2002 2. Immunomodulatory
index in vitro
In vitro immunomodulatory activity
Murine splenocytes were cultured in medium, in the presence or absence of Con A, with
or without herbal extracts. Experimental Yim and Ko, 2002
3. Immunomodulatory index ex vivo
Ex vivo immunomodulatory activity
Female Balb/c mice are randomly divided into groups of 3-5 animals an treated with the
herbal extracts in the same way as in the ex vivo antioxidant activity assay. Experimental Yim and Ko, 2002 4. ATP generation (%
control)
Myocardial ATP-generation capacity, an indirect measure of mitochondrial oxidative phosphorylation
Nucleus-free myocardial homogenate is harvested from adult male Balb/c mice in treatment and control groups as described in the reference. The ATP level is measured and estimated from the standard curve after incubating the homogenate with ADP solution for 10 min. at 37 ℃.
Experimental Ko et al., 2006 Ko and Leung, 2007
5. Total antioxidant power
Antioxidant power per unit dry weight of plant material
Ferric-reducing antioxidant power assay was performed as described in the reference. After a 4-min reaction with FRAP reagent, absorbance of the mixture at 593 nm was recorded. Results were expressed in μmol Fe(II)/g dry weight of plant material.
Experimental Wong et al., 2006 6. Total phenolic content
Folin-Ciocalteu method as described in reference was used to estimate total phenolics.
After incubation with Folin-Ciocalteu reagent, absorbance at 765 nm was recorded. Experimental Wong et al., 2006 7. Unit in vitro activity In vitro antioxidant activity per unit phenolic content Total antioxidant power / Total phenolic content Computational
8. Unit ex vivo activity Ex vitro antioxidant activity per unit phenolic content Glutathione regeneration capacity / Total phenolic content Computational
9. Physiological factor
The factor influencing antioxidant activity from an in vitro to an ex vivo environment
25
Table 11. Dataset for SVM classification with attribute means used to fill in missing values. All original data were normalized.
No. Category Herbal Name Chinese name
Raw features (normalized) Derived features
Glutathione regeneration capacity Immuno- modulatory index in vitro Immuno- modulatory index ex vivo ATP generation Total antioxidant power Total phenolic content Unit in vitro
activity Unit ex vivo activity factor Phys.
1 Yin Fructus Ligustri 女貞子 0.8682 0.5242 1.0000 0.3544 0.0650 0.1966 0.3308 3.3398 10.0969
2 Yin Herba Dendrobii 石斛 0.6971 0.7697 0.8833 0.2902 0.0308 0.1227 0.2509 5.6803 22.6380
3 Yin Herba Ecliptae 墨旱蓮 0.8014 0.5000 0.7056 0.2818 0.0650 0.1966 0.3308 3.3398 10.0969
4 Yin Radix Asparagi 天門冬 0.6567 0.2121 0.6889 0.3446 0.0308 0.0959 0.3212 6.8501 21.3254
5 Yin Radix Ophiopogonis 麥門冬 0.6479 0.5000 0.8000 0.3579 0.0291 0.0541 0.5383 11.9692 22.2355
6 Yin Radix Oryzae 糯稻根 0.3948 0.2364 0.5389 0.2983 0.0650 0.1966 0.3308 3.3398 10.0969
7 Yin Radix Rehmanniae 幹地黃 0.6566 0.4614 0.7576 0.4105 0.2225 0.6529 0.3408 3.3398 10.0969
8 Yin Semen Prinsepiae 蕤仁 0.6192 0.5152 0.7722 0.3351 0.0650 0.1966 0.3308 3.3398 10.0969
9 Yin Rhizoma Polygonati 玉竹 0.5677 0.4333 0.6722 0.3579 0.0119 0.0574 0.2075 9.8831 47.6206
10 Yang Cortex Eucommiae 杜仲 0.9438 0.1394 0.5778 0.5509 0.0676 0.2062 0.3276 4.5770 13.9714
11 Yang Fructus Psoraleae 補骨脂 0.8735 0.4303 0.6833 0.6140 0.2407 0.8471 0.2842 1.0311 3.6284
12 Yang Herba Cistanches 肉蓯蓉 0.6063 0.2273 0.5278 0.6702 0.2080 0.5372 0.3871 1.1287 2.9158
13 Yang Herba Cynomorii 鎖陽 0.7363 0.3310 0.6167 0.8070 0.1712 0.5083 0.3368 1.5866 4.7078
14 Yang Herba Epimedii 淫羊藿 0.8735 0.1727 0.5444 0.4561 0.2709 0.6942 0.3902 1.2582 3.2248
15 Yang Radix Dipsaci 續斷 0.8395 0.1273 0.5667 0.4211 0.3166 0.7645 0.4141 1.0981 2.6519
16 Yang Radix Morindae 巴戟天 0.6380 0.6546 0.7278 0.4983 0.0202 0.1533 0.1318 4.1614 31.5843
17 Yang Rhizoma Cibotii 狗脊 0.6614 0.0485 0.5389 0.5751 0.1564 0.4641 0.3370 1.5866 4.7078
18 Yang Rhizoma Curculiginis 仙茅 0.7363 0.3310 0.6167 0.5228 0.0407 0.1897 0.2147 1.5866 4.7078
19 Yang Rhizoma Drynariae 骨碎補 0.5946 0.1788 0.5444 0.5404 0.1564 0.4641 0.3370 1.5866 4.7078
20 Yang Semen Allii 韭子 0.7363 0.3310 0.6167 0.4667 0.1564 0.4641 0.3370 1.5866 4.7078
26
Table 12. Dataset for SVM classification with attribute medians used to fill in missing values. All original data were normalized.
No. Category Herbal Name Chinese name
Raw features (normalized) Derived features
Glutathione regeneration capacity Immuno- modulatory index in vitro Immuno- modulatory index ex vivo ATP generation Total antioxidant power Total phenolic content Unit in vitro activity Unit ex vivo
activity Phys. factor
1 Yin Fructus Ligustri 女貞子 0.8682 0.5242 1.0000 0.3544 0.0308 0.0959 0.3212 9.0561 28.1928
2 Yin Herba Dendrobii 石斛 0.6971 0.7697 0.8833 0.2902 0.0308 0.1227 0.2509 5.6803 22.6380
3 Yin Herba Ecliptae 墨旱蓮 0.8014 0.5000 0.7056 0.2818 0.0308 0.0959 0.3212 8.3595 26.0242
4 Yin Radix Asparagi 天門冬 0.6567 0.2121 0.6889 0.3446 0.0308 0.0959 0.3212 6.8501 21.3254
5 Yin Radix Ophiopogonis 麥門冬 0.6479 0.5000 0.8000 0.3579 0.0291 0.0541 0.5383 11.9692 22.2355
6 Yin Radix Oryzae 糯稻根 0.3948 0.2364 0.5389 0.2983 0.0308 0.0959 0.3212 4.1186 12.8218
7 Yin Radix Rehmanniae 幹地黃 0.6912 0.5000 0.7389 0.4105 0.2225 0.6529 0.3408 1.0587 3.1062
8 Yin Semen Prinsepiae 蕤仁 0.6192 0.5152 0.7722 0.3351 0.0308 0.0959 0.3212 6.4591 20.1078
9 Yin Rhizoma Polygonati 玉竹 0.5677 0.4333 0.6722 0.3579 0.0119 0.0574 0.2075 9.8831 47.6206
10 Yang Cortex Eucommiae 杜仲 0.9438 0.1394 0.5778 0.5509 0.0676 0.2062 0.3276 4.5770 13.9714
11 Yang Fructus Psoraleae 補骨脂 0.8735 0.4303 0.6833 0.6140 0.2407 0.8471 0.2842 1.0311 3.6284
12 Yang Herba Cistanches 肉蓯蓉 0.6063 0.2273 0.5278 0.6702 0.2080 0.5372 0.3871 1.1287 2.9158
13 Yang Herba Cynomorii 鎖陽 0.6614 0.1788 0.5667 0.8070 0.1712 0.5083 0.3368 1.3013 3.8635
14 Yang Herba Epimedii 淫羊藿 0.8735 0.1727 0.5444 0.4561 0.2709 0.6942 0.3902 1.2582 3.2248
15 Yang Radix Dipsaci 續斷 0.8395 0.1273 0.5667 0.4211 0.3166 0.7645 0.4141 1.0981 2.6519
16 Yang Radix Morindae 巴戟天 0.6380 0.6546 0.7278 0.4983 0.0202 0.1533 0.1318 4.1614 31.5843
17 Yang Rhizoma Cibotii 狗脊 0.6614 0.0485 0.5389 0.5404 0.1712 0.5083 0.3368 1.3013 3.8635
18 Yang Rhizoma Curculiginis 仙茅 0.6614 0.1788 0.5667 0.5228 0.0407 0.1897 0.2147 3.4871 16.2391
19 Yang Rhizoma Drynariae 骨碎補 0.5946 0.1788 0.5444 0.5404 0.1712 0.5083 0.3368 1.1699 3.4734
20 Yang Semen Allii 韭子 0.6614 0.1788 0.5667 0.4667 0.1712 0.5083 0.3368 1.3013 3.8635
27
2.2.6 Implementation
Data entries of Yang-tonifying herbs were used as the positive dataset and Yin-tonifying herbs as the negative dataset. Leave-one-out cross-validation was used. The performance of classifiers using features in different combinations was compared to disclose the ability of the various features to differentiate Yang- from Yin-tonifying herbs.
LIBSVM (Chang and Lin, 2001) is an integrated software for support vector classification, (C-SVC, nu-SVC), regression (epsilon-SVR, nu-SVR) and distribution estimation (one-class SVM ). It also supports multi-class classification. The LIBSVM package was implemented in Weka, a data mining software in Java (Witten and Frank, 2005).
28
2.3 Sensitivity Analysis by Computational Modeling
2.3.1 Scope of the Model
To simulate the effects of oxidation and antioxidation, employed in the present study is a validated mathematical model of oxidative phosphorylation, tricarboxylic acid cycle and ion transport, mitochondrial ROS generation and scavenging system in cardiac myocytes (Cortassa et al., 2004, Cortassa et al., 2003) The diagrams of the original and expanded models are in Figure 9 and Figure 10.
The expanded model is able to qualitatively and semiquantitatively reproduce experimental data concerning mitochondrial bioenergetics, Ca2+ dynamics, respiratory control (Cortassa et al., 2003), as well as the experimentally observed oscillations in mitochondrial membrane potential (ΔΨm), NADH and ROS production (Cortassa et
al., 2004). The main reactive oxygen species (ROS) associated with the system of mitochondrial energetics include hydrogen peroxide (H2O2) and superoxide anions in
either mitochondrial matrix (O2.-m) or cytoplasm (intermembrane space) (O2.-i).
Effects of antioxidant activities were simulated by instantly lowered concentrations of reactive oxygen species; rate of ATP production of ATP synthase reflects mitochondrial ATP generation capacity.
29
Figure 9. Diagram of Cortassa’s previous model of mitochondrial energetics and calcium dynamics, before extension with ROS metabolism (Cortassa et al., 2003).
Figure 10. Diagram of Cortassa’s model of mitochondrial metabolism extended with ROS production, transport and scavenging (Cortassa et al., 2004).
30
2.3.2 Sensitivity Analysis: Perturbation Studies
Sensitivity analysis is “the study of how the variation (uncertainty) in the output of a mathematical model can be apportioned, qualitatively or quantitatively, to different sources of variation in the input of a model (Cacuci, 2005).” In order to see whether ATP generation is causally related to mitochondrial antioxidant status, these two variables are set to be the output and input respectively.
The inputs in the present sensitivity analysis are: initial concentrations of hydrogen peroxide ([H2O2]), superoxide anions in mitochondrial matrix ([O2.-m]) and
in cytoplasm (intermembrane space) ([O2.-i
]
), which were modified by one variable ata time, two variables at a time, and all three variables at a time. The output variables being monitored are (1) the rate of production of O2.-i, or VSO2m; (2) the concentration
of O2.-i; (3) the rate of production of ATP, or VATPase ; (4) the concentration of O2.-m;
and (5) the concentration of H2O2. The basic elements of a sensitivity analysis, inputs
31
Table 13. Summary of inputs and outputs in the sensitivity analysis performed.
Varied Inputs Monitored Outputs
1. the concentration of O2.-i at 0s 1. the rate of production of O2.-m at 0s
2. the concentration of O2.-m at 0s 2. the rate of production of ATP at 0s
3. the concentration of H2O2 at 0s
3. the rate of production of O2.-m
at various time points 4. the concentration of O2.-i at 0s;
the concentration of O2.-m at 0s
4. the rate of production of ATP at various time points
5. the concentration of O2.-m at 0s; the concentration of H2O2 at 0s 6. the concentration of O2.-i at 0s; the concentration of H2O2 at 0s 7. the concentration of O2.-i at 0s; the concentration of O2.-m at 0s; the concentration of H2O2 at 0s
The perturbation range was set to be -90% to +1000% of the value of the perturbed variable at reference point, covering a wide 1090% so that any observable trend in the outputs such as an asymptotic line or asymptotic surface could be obvious.
2.3.3 Implementation
All variables and parameters at the reference point for perturbation studies are from the original publication of the model (Cortassa et al., 2004), with corrections by referring to model codes requested from the author. The mathematical model was implemented in MATLAB® (Version 7.0.1.24704 (R14) Service Pack 1, The MathWorks, Inc., Natick, MA).
32
2.4 Metabolic Control Analysis
2.4.1 Rationale
Metabolic control analysis (Kacser and Burns, 1973, Heinrich and Rapoport, 1974) is a useful mathematical approach to quantitatively analyze how control of a pathway is shared among the contributing enzymes and modulators. Almost all original results of MCA are based on three main concepts: flux control coefficient (FCC), concentration control coefficient (CCC) and the elasticity (Torres and Voit, 2002).
The flux control coefficient of an enzyme, , is a system property describing its effect on the steady-state flux J:
· ln
ln
(5) Likewise, the concentration control coefficient of an enzyme describes the effect of a change in enzyme on the steady-state concentration of metabolite :
· ln
ln
6 The above two control coefficients both characterize systemic properties of an enzyme, in which a slight local perturbation is related to a global system response. A crucial property uncovered by the MCA formalism is that the summation of all FCCs (all steps) of a pathway is equal to unity:
33
(7) Moreover, the sum of all CCCs for a given reference metabolite concentration is equal to zero:
0
(8) The summations above represent sums of all steps in the metabolic system. MCA was once well-described as being “not really a theory, but rather a formal model that allows the expression of parameters that describe, in quantitative terms, the global behavior of an enzyme system (Ricard, 1999).” Hence MCA is well-suited here to study the global effects of all antioxidation-related metabolites and enzymes on the steady-state of the mitochondrial energetics system.
On the other hand, the elasticity is a local property that relates a perturbation in metabolite to the subsequent change in one particular reaction rate:
· ln
ln
(9) Elasticity is used here to study the local influence of antioxidation on ATP synthesis.
2.4.2 Implementation
MCA in the present study was performed by using COPASI 4.5 (Build 30) (Hoops et al., 2006), a simulator of biochemical systems. All initial concentrations of metabolites, parameter values and reaction kinetics were set according to Cortassa’s
34
mitochondrial energetics model expanded with ROS metabolism (Cortassa et al., 2004), with corrections and tunings according to model codes requested from the author.
35
CHAPTER 3 RESULTS
3.1 Finding Common Compounds of Yang-tonifying Herbs by Decision Tree
As has been recognized as one pharmacological basis of the actions of Yang-tonifying herbs, ATP-generation capacity is shown by results of ID3 decision tree (Table 14) to be a crucial feature to distinguish Yang-tonifying herbs from other tonifying herbs. When ATP-generation is removed from the features, sensitivity of the classifier becomes as low as 20% for all four kinds of Chinese tonifying herbs, 31.6% for Yin- and Yang-tonifying herbs, and 51.4% for Yin and Yang families. The data of chemical compound names did not appear to be informative in distinguishing Yang-tonifying herbs from all Chinese tonifying herbs, Yang-tonifying from Yin-tonifying herbs, or herbs under the Yang family from those under the Yin family.
Table 14. Results of ID3 decision tree learning in order to find common
compounds in Yang-tonifying herbs.
Features Class Sen. Spe. Pre. Recall F-
measure ROC Area Chemical compounds plus ATP-generation capacity
Yin, Yang, Qi, and Blood 0.486 0.838 0.438 0.486 0.455 0.662 Yin- and Yang-tonifying
herbs 0.947 0.962 0.953 0.947 0.948 0.955 Yin and Yang families 0.657 0.676 0.677 0.657 0.658 0.667 Chemical
compounds only
Yin, Yang, Qi, and Blood 0.200 0.727 0.206 0.200 0.201 0.463 Yin- and Yang-tonifying
herbs 0.316 0.332 0.332 0.316 0.316 0.324 Yin and Yang families 0.514 0.502 0.518 0.514 0.516 0.508
36
However, the specificity for all Chinese tonifying herbs after removal of the ATP-generation feature is still as high 72.7%, suggesting that the compounds list is still usable in rejecting false claims of tonifying actions.
In Appendix B are the full reports from ID3 decision tree algorithm
3.2 Finding Significant Features Shared by Yang-tonifying Herbs by SVM
Results of the supervised learning method SVM are shown in Table 15.
For the data normalized with respect to maximum values in all the four Chinese tonifying herbs, various combinations of the 6 original features produced a sensitivity of 57.1%, a specificity of 42.9%, and a precision 32.7%. After the derived features of unit in vitro and ex vivo activity were taken into consideration, the classifier produced sensitivities from 66.7% to 90.5%, specificities from 66.7% to 92.9%, and precisions from 67.3% to 92.2%. If only the derived features were considered, the classifier gave sensitivities from 71.4% to 90.5%, specificities from 73.0% to 92.9%, and precisions from 73.0% to 92.2%. The numbers clearly showed better classification results from derived features over the original features.
Moreover, considering unit in vitro antioxidant activity with unit ex vivo antioxidant activity only, without any other features, could have high accuracies over 90%; whereas the inclusion of physiological factor never made the classification accuracy to 80%, suggesting the physiological factor to be the least important among the three derived features.
37
Table 15. Results of SVM classification using different combinations numerical features.
No. Filling missing value GRC I.I. in vitro I.I. ex vivo ATP generation Total antioxidant power Total phenolic content Unit in vitro activity Unit ex vivo activity Phys.
factor Sen Spe Pre Recall
F- ROC Area measure 1 attribute means o o o o o o 0.571 0.429 0.327 0.571 0.416 0.500 2 o o o 0.571 0.429 0.327 0.571 0.416 0.500 3 o o o o o 0.905 0.929 0.922 0.905 0.905 0.917 4 o o o o o o 0.762 0.766 0.768 0.762 0.763 0.764 5 o o 0.905 0.929 0.922 0.905 0.905 0.917 6 o o o 0.762 0.766 0.768 0.762 0.763 0.764 7 attribute medians o o o o o o 0.571 0.429 0.327 0.571 0.416 0.500 8 o o o 0.571 0.429 0.327 0.571 0.416 0.500 9 o o o o o 0.857 0.837 0.859 0.857 0.856 0.847 10 o o o o o o 0.667 0.667 0.673 0.667 0.668 0.667 11 o o 0.857 0.837 0.859 0.857 0.856 0.847 12 o o o 0.714 0.730 0.730 0.714 0.716 0.722
38
3.3 Sensitivity Analysis by Computational Modeling of the Mitochondrial
System
3.3.1 Perturbations of [H2O2], [O2.-]i and [O2.-]m respectively
VATPase at 0s is unaffected by change in [H2O2] (Figure 11 and Figure 12).
VATPase plunges fast in the first 10s of simulation time, levels off thereafter and
appears intact under the perturbation of [H2O2] (Figure 13). It is because the
amplitude of change is small and the its value stays between ± 4×10⁻⁶ % (Figure 14).
39
Figure 12. VATPase (% change) at 0s vs. [H2O2] at 0s.
40
Figure 14. Time-course VATPase (% change) vs. [H2O2] at 0s
Under various extents of [O2.-]I perturbation, the time-course VATPase looks
unaffected (Figure 15) but the amplitude (Figure 16) is around 10-2 %, which is four orders of magnitude higher compared with that from [H2O2] perturbations.
The time-course VATPase still appears largely unaffected to perturbations in [O2.-]m
(Figure 17). VATPase actually inversely responds to perturbations in [O2.-]m within the
2×10⁻⁷to 5×10⁻⁷% range, exhibiting a trend opposite to that under [O2.-]i perturbations
41
Figure 15. Time-course VATPase vs. [O2.-]c at 0s
42
Figure 17. Time VATPase vs. [O2.-]m at 0s
43
3.3.2 Perturbation of two and three metabolites at a time
As can be seen in Figure 19, the surface of time-course VATPase plotted against
simulation time and percent perturbation of [H2O2] and [O2.-]m displays an overlap
shape of the perturbation results from [H2O2] and [O2.-]m.. However, when [H2O2] and
[O2.-]c or [O2.-]m and [O2.-]c are perturbed together, the surface shapes are dominated
by single-variable perturbation in [O2.-]c (Figure 20 and Figure 21).
Since no other behavior than additive effects is observed for multi-variable perturbations, it suggests that each of these three reactive oxygen species is independent in, if any, soliciting changes in VATPase instantly or subsequently.
Therefore, the variable under perturbation to which VATPase is more sensitive, i.e., the
percent change is higher, will dominate in multi-variable perturbations.
44
Figure 20. Time-course VATPase (% change) vs. [O2]c and [H2O2] at 0s.
45
In terms of amplitude in the response of VATPase, perturbations in [O2.-]i brings the
greatest (10-3–10-2%), [H2O2] brings smaller (10-6–10-5%), and [O2.-]m brings the
smallest change (10-7–10-6%). In terms of the relationship between metabolite perturbations and the response of VATPase, [O2.-]i appears to be directly related, [O2.-]m
inversely related and [H2O2] unrelated. A summary of their effects on VATPase is
provided in Table 16.
Table 16. Summary of sensitivity analysis of ROS inputs on VATPase outputs.
Perturbed Metabolite (Perturbation Range = -90% to +1000%)
Order of Magnitude of Change in VATPase Output (%)
Relationship With Change of VATPase Output
[O2.-]i 10-3–10-2 Directly related
[H2O2] 10-6–10-5 Unrelated