Validation of the Chinese Version “Satisfaction with Amplification in Daily Life (SADL)” Survey for Hearing Aid Users
Te-Yung Fang, M.D.,1 Hsin-Jen Chang, M.D.,1 Tan-Kuai Wan, M.D.,1 Pa-Chun Wang,
M.D., M.Sc.,1,2,3,4 Ya-Hui Chen, M.H.A.1
1 Department of Otolaryngology, Cathay General Hospital, Taipei, Taiwan 2 Fu Jen Catholic University School of Medicine, Taipei, Taiwan
3 Department of Public Health, China Medical University, Taichung, Taiwan 4 School of Medicine, Taipei Medical University, Taipei, Taiwan
Running title: Chinese version Satisfaction with Amplification in Daily Life
Key words: Quality of life, ear, auditory system, sensorineural
Abbreviations: SADL, Satisfaction with Amplification in Daily Life; CSADL, Chinese version of SADL
Correspondence: Pa-Chun Wang, M.D., M.Sc., Department of Otolaryngology, Cathay General Hospital, 280 Sec. 4, Jen-Ai Road, 106 Taipei, Taiwan
Telephone: 8862-27082121 ext. 3333; Fax: 8862-27074949E-mail: drtony@tpts4.seed.net.tw
ABSTRACT
Objective: Satisfaction with Amplification in Daily Life (SADL) may quantify
satisfaction with hearing aids. We translated and validated a Chinese version of SADL (CSADL).
Design: The SADL was translated from English to Mandarin Chinese by 2 bilingual
physicians. The CSADL was administered to hearing aid users and tested for reliability and validity.
Study Sample: There were 155 hearing aid users who completed the CSADL
prospectively, and 39 subjects were retested after 4 to 6 weeks for test-retest reliability. Results: The CSADL had good internal consistency (Cronbach α = 0.63 to 0.92), within survey reliability (r = 0.54 to 0.69; P ≤ .05), and test-retest reliability (r = 0.93 to 0.98; P ≤ .05). The CSADL dimensions correlated well with worse-ear speech discrimination score (P ≤ .05). The CSADL global score significantly correlated with the general health (r = 0.236; P ≤ .05), vitality (r = 0.162; P ≤ .05), social functioning (r = 0.190; P ≤ .05), and mental health (r = 0.224; P ≤ .05) subscales of the Mandarin Chinese Taiwan version of the Medical Outcome 36-item Short Form Health Survey.
Conclusions: The CSADL is a valid and reliable questionnaire to evaluate satisfaction
INTRODUCTION
Hearing aids provide important auditory rehabilitation for hearing impaired patients and facilitate communication with other people. However, the acceptance of hearing aids is low because of the history of poor sound clarity and noisy background sound. The advanced technology of sound processing has improved hearing aids. Satisfaction surveys for hearing aids may assess current fitting, give feedback from users, and optimize professional service. Several hearing aid inventories had been developed, including Client Oriented Scale of Improvement (Dillon et al, 1997), Glasgow Hearing Aid Benefit Profile (Gatehouse, 1999), The International Outcome Inventory for Hearing Aids (Cox et al, 2002), MarkeTrak Survey (Kochkin, 2005), and Satisfaction with
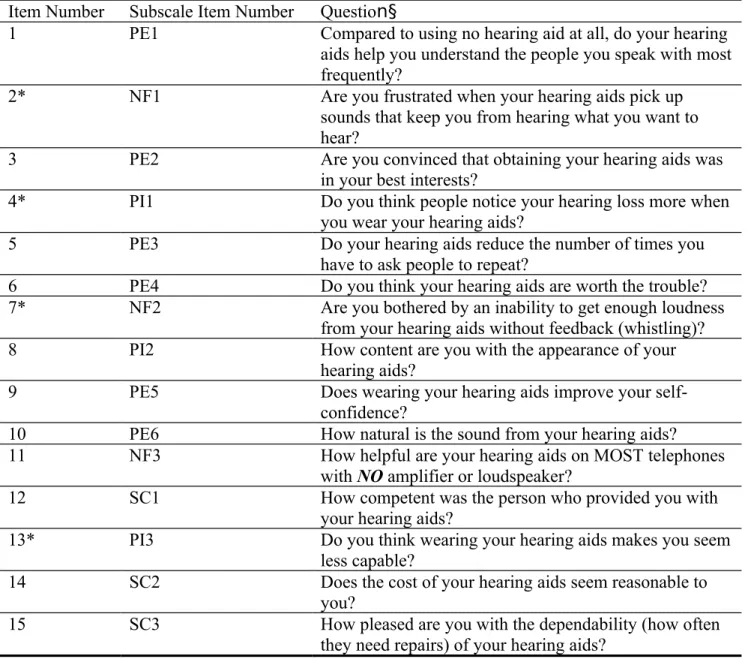
Amplification in Daily Life (SADL) survey (Cox & Alexander, 1999; Cox & Alexander, 2001) (Table 1).
The SADL survey is commonly used to measure overall satisfaction of using hearing aids (Hosford-Dunn & Halpern, 2000; Hosford-Dunn & Halpern, 2001). Aside from its original English version, there are translations in Danish, Spanish, Portugese (Brazilian), Swedish, German, and Odia. ( http://www.harlmemphis.org//index.php?cID=131 ) . This questionnaire includes 15 items that evaluate usage, benefit, and satisfaction associated with hearing aid use. The SADL survey generates a global satisfaction score and 4 subscale scores: (1) Positive Effects (PE) score evaluates improved functioning in psychoacoustic and psychological domains (6 items); (2) Service and Cost (SC) score includes dispenser competence and hearing aid value (3 items); (3) Negative Features
(NF) score assesses effect of potentially unpleasant aspects of hearing aid use (3 items); and (4) Personal Image (PI) score estimates both internalized and externalized view of the self as a hearing aid wearer (3 items). The SADL items are each scored on a 7-point scale, and the global and subscale SADL scores range from 1 (lowest satisfaction) to 7 (greatest satisfaction). The Global Score (GS) is the mean of the scores for all items completed by the user, excluding items 11 in the cases who indicated they can hear telephone well without hearing aid. Hearing aid users were also asked to rate a single-item overall satisfaction score (range from 1 to 5). The SADL survey may be an indirect measure of satisfaction, but it has been validated and is reliable for use in clinical settings (Cox & Alexander, 1999; Cox & Alexander, 2001).
Translation of the original SADL survey from English to another language, such as Chinese, may not guarantee the same measurement properties. The purpose of this study was to translate SADL survey into Chinese and validate the Chinese version of SADL (CSADL). The CSADL was tested against a single-item overall satisfaction score, the Mandarin Chinese Taiwan version of the Medical Outcome Study 36-item Short Form Health Survey (TSF-36), which is a generic quality-of-life measure. In addition, the results of CSADL in the present study were compared with previous data from the SADL (Cox & Alexander, 1999) to evaluate differences in outcome between 2 different medical and health care environments and cultures.
MATERIALS AND METHODS
Instrument translation
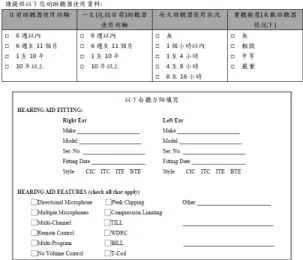
The CSADL (Figure 1) was created by translating the SADL from English to Mandarin Chinese with forward, backward, and pretest steps for instrument translation previously described (Shumaker & Berzon, 1995). Authorization to translate was secured in
advance. Translation was done by 2 bilingual physicians, and the CSADL was translated back to English iteratively until the 2 versions were considered completely
interchangeable . A bilingual lay panel with 3 bilingual individuals was used to measure comprehensibility, test translation alternatives, highlight unexpected errors, and reveal inappropriate items (Shumaker & Berzon, 1995).
Subjects and surveys
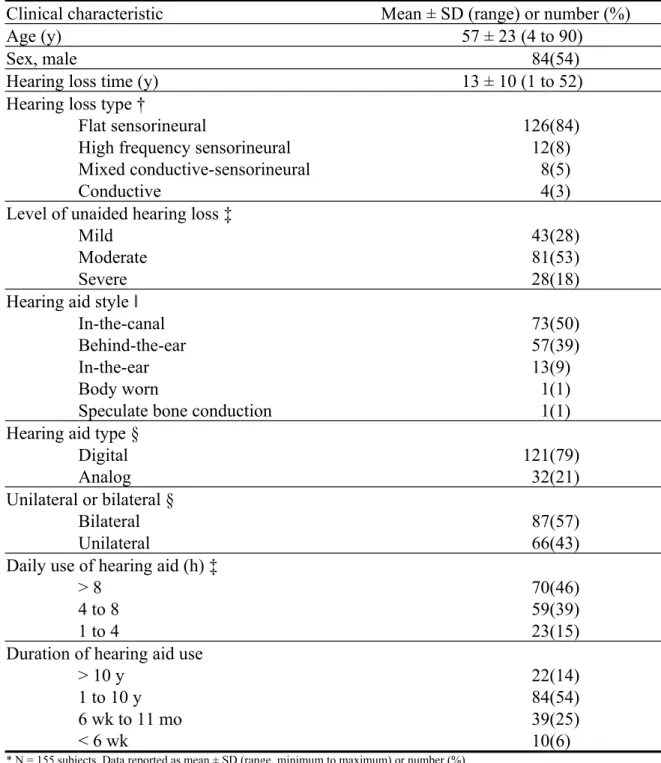
We enrolled 155 consecutive adult hearing aid users (first-time and experienced users) prospectively from an academic hearing clinic. All users had complete pre- and post- fitting, pure tone and speech hearing test information.
The 155 subjects had a broad range of subject age and hearing loss time (Table 2 ). Most subjects had flat sensorineural hearing loss, and level of hearing loss was most frequently moderate (Table 2 ) (Clark, 1981) . Most subjects used in-the-canal or behind-the-ear hearing aids, and most hearing aids were digital (Table 2 ). Most subjects used bilateral hearing aids (Table 2 ) . Most subjects used hearing aids > 4 h ours daily, and most used hearing aids for > 1 y ear (Table 2 ).
There were 3 surveys used in this study. At entry into the study, all respondents received the self-report CSADL, a single-item overall satisfaction index, and the validated
Mandarin Chinese Taiwan version of Medical Outcome Study 36-item Short-Form Health Survey (TSF-36) (McHorney et al, 1993; Ware & Sherbourne, 1992) after at least 4 weeks following initial fitting. T he single-item overall satisfaction index is a 5-point Likert- type scale, in which 1 represents very dissatisfied and 5 represents very satisfied. A
score of 3 is considered neutral. The TSF-36 has been available since June 1996, and permission to use TSF-36 was obtained from the Medical Outcomes Trust of Boston. The TSF-36 is a commonly used, generic quality-of-life measure with 8 domains of general health including: role functioning, role physical, bodily pain, general health, vitality, social functioning, role emotional, and mental health. Subscale scores for the TSF-36 were tabulated from 0 (worst) to 100 (best), according to published algorithms (Brazier et al., 1992; Ware, 1993). The 8 subscale scores of the TSF-36 were compared with the 4 subscale scores and the global score of the CSADL by correlation analysis.
Reliability and validity of CSADL
A subgroup of 39 hearing aid owners (25%) was retested with the CSADL 4 to 6 weeks after initial testing. The CSADL was assessed for convergent validity (Nunnally, 1978) by evaluating the correlation of CSADL data with concurrent pure tone audiometry, speech audiometry, and speech discrimination and by comparing CSADL data with convergence and divergence scores on the validated TSF-36 and single-item satisfaction index. There were 155 complete sets of CSADL data, hearing data, TSF-36 forms, and
single-item satisfaction index obtained.
Data analysis
All data were stored in a spreadsheet (Excel 7.0, Microsoft, Redmond, WA) and analyzed with statistical software (SAS Institute, Cary, North Carolina). Spearman rank correlation coefficients were used to determine test-retest reliability for individual items, subscales, and total survey scores; the item to subscale, item to total, and subscale to total score correlations; and also the association between the CSADL subscores with pure tone audiometry and speech discrimination scores . Cronbach α coefficients were used to evaluate internal consistency of CSADL. Statistical significance was defined by P ≤ .05.
RESULTS
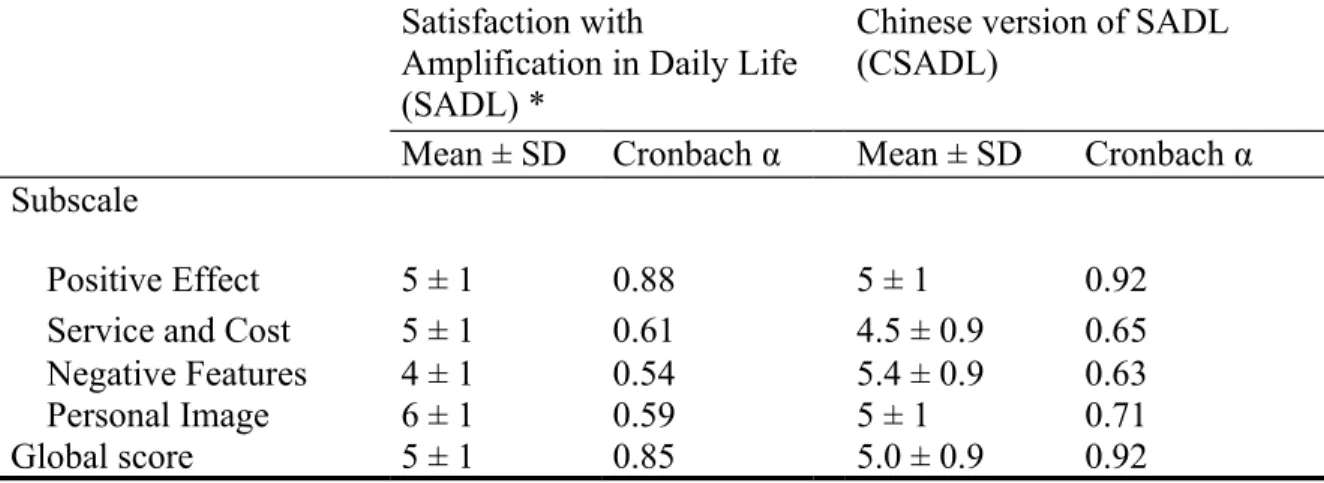
Evaluation of the internal consistency of the 4 subscales and global score of CSADL showed that the negative features subscale had the lowest Cronbach α coefficient, and the positive effect and global score had the highest Cronbach α coefficient, similar to
previously published data for the SADL (Cox & Alexander, 1999) (Table 3). The CSADL had higher or equivalent Cronbach α coefficient than SADL in each subscale (Table 3). For the CSADL, the service and cost subscale had the lowest mean score, and the negative features subscale had the highest mean score (Table 3).
The CSADL survey items correlated significantly with the corresponding subscale scores (Table 4). The correlation coefficients for CSADL item to total score varied from 0.69 to 0.90 (Table 4).
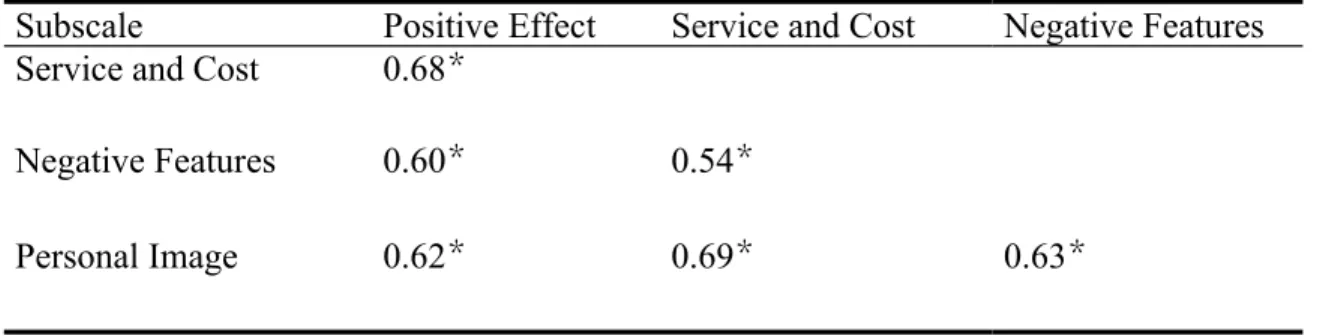
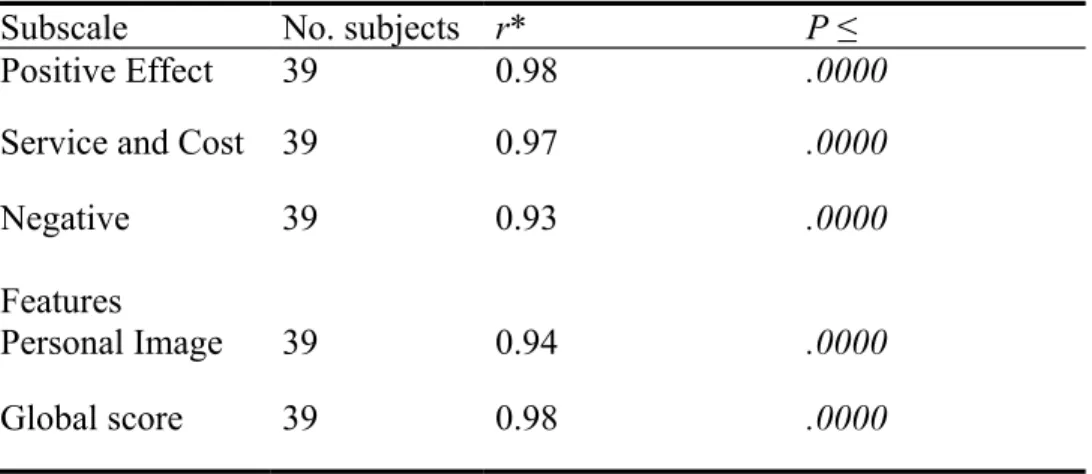
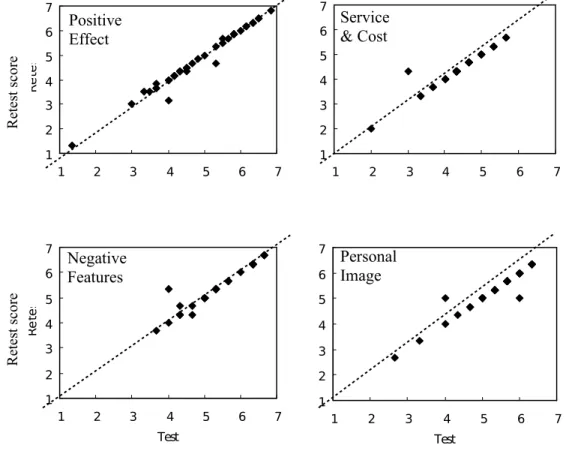
All 4 subscales of CSADL significantly correlated with each other, and the strongest correlation was noted between the service and cost subscale and personal image subscale (Table 5). Each subscale and global score had high, significant test-retest reliability (Table 6, Figure 2).
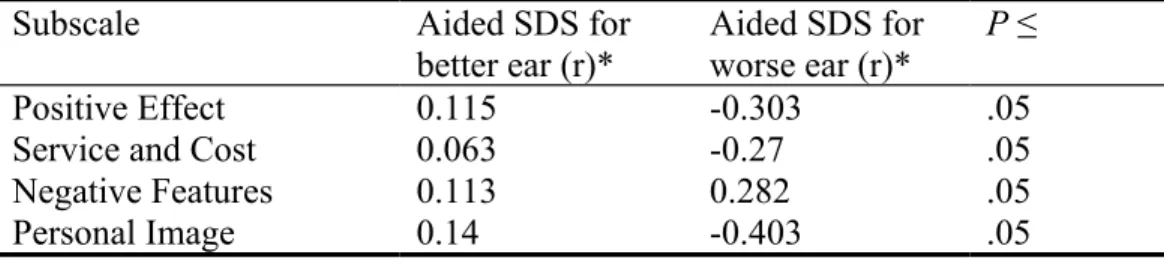
The validity of CSADL was evaluated by comparing the CSADL subscores with results from pure tone audiometry and speech discrimination score. The speech discrimination score for the worse-hearing ear had a significant negative correlation with the positive effect, service and cost, and personal image subscales of CSADL, and a significant positive correlation with the negative features subscale of CSADL (Table 7). Pure tone
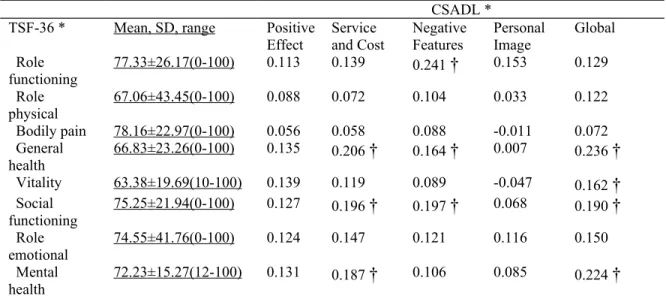
audiometry did not correlate with CSADL subscores (data not shown). Significant correlations were noted between the CSADL global score with general health, vitality, social functioning, and mental health subscales of the TSF-36 ; between the CSADL service and cost with general health, social functioning, and mental health subscales of the TSF-36 ; and between the CSADL negative feature with role functioning, general health, and social functioning subscales of the TSF-36 (Table 8 ).
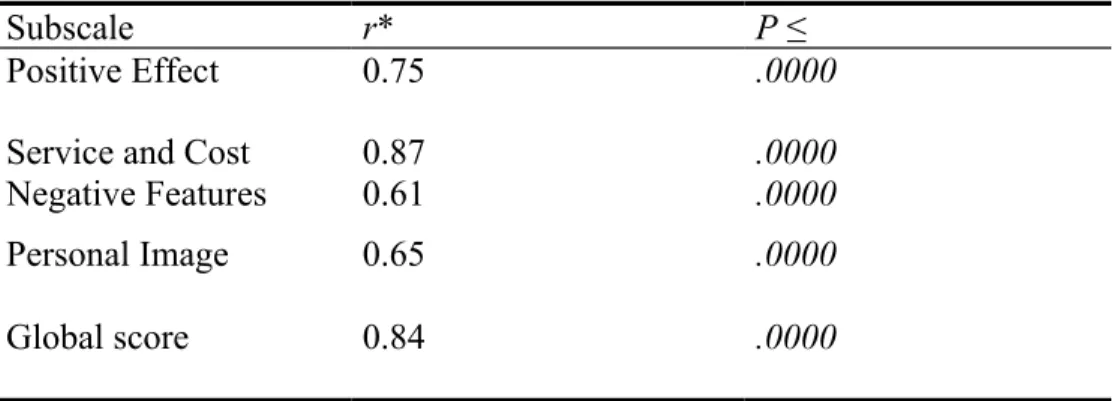
Evaluation of construct validity showed that significant correlations were noted between the single-item satisfaction index score and the 4 subscale scores and global score of CSADL (Table 9). The strongest correlations were noted between the single-item satisfaction index and the service and cost subscore and global score of CSADL (Table 9).
DISCUSSION
The present study validates the CSADL for use in clinical practice and research about satisfaction with hearing aids. The Cronbach α coefficients in the 4 subscales and global score showed high internal consistency of CSADL (Table 3). Although there was lower internal consistency for the service and cost (α = 0.65) and negative features (α = 0.63) subscales, the reliability was within acceptable range (α = 0.2 to 0.8) for patient-based surveys (Nunnally, 1978). Compared with the original SADL, the CSADL had
compatible or better item to total (Table 4) and between subscale (Table 5) reliability. Therefore, the hearing aid user satisfaction dimensions may interact with each other. User satisfaction is a composite perception of function, service, cost, and clinical efficacy, information captured with the CSADL.
The CSADL had excellent test-retest reliability (r = 0.93 to 0.98), similar to the original SADL (Cox & Alexander, 1999) (Table 6, Figure 2). Most respondents in this study received retest assessment at 4 to 6 weeks after initial fitting with the hearing aid and first completion of the CSADL; by that time, recall bias was avoided, hearing aid benefit became stable, and initial satisfaction with the device (“honeymoon effect”) was past (McLeod et al, 2001; Surr et al, 1998).
In the present study, hearing aid users who had poor speech discrimination score after fitting also had lower satisfaction in the positive effect, service and cost, and personal image domains (Table 7), indicating good validity of CSADL to identify the dissatisfied hearing aid user. Improved speech discrimination score of the worse ear was a
determinant of user satisfaction (Table 7).
The convergent validity of CSADL was confirmed by the correlation of the CSADL with the validated TSF-36 general health measure. The weak but significant correlations between the CSADL global score and some dimensions of TSF-36 (Table 8) suggested that the hearing aid use may have positive effects on general health, vitality, social functioning, and mental health.
The significant positive correlation between the single-item satisfaction index score and the CSADL service and cost subscale score (Table 9) suggests that economic factors and professionalism of hearing aid dispensers may be important for the satisfaction of hearing aid users.
The analyses of the 4 subscale scores in the Chinese-speaking Taiwanese showed specific user preferences. Positive effect, which is associated with acoustic and psychological benefit, may be the most direct benefit of hearing aids and has a strong influence on overall satisfaction (Cox & Alexander, 1999; Cox & Alexander, 2001). The present study showed a high Cronbach α coefficient for positive effect (Table 3), indicating high inter-item reliability. T he positive effect can be affected by unilateral or bilateral fitting, contra - lateral ear condition, service, and cost that would warrant future study. Service and cost are important issues in Taiwan, including professional competence, product price, and reliability of the hearing aid. Under Taiwan ’ s comprehensive National Healthcare Insurance payment system, patients may have get used to the low-cost
healthcare, and the recent economic crisis in Taiwan may further contribute to the service and price-sensitive phenomenon for self-pay products.
The negative features subscale includes problems with environmental noise, acoustic feedback, and telephone use. The negative features subscale score in the CSADL was higher (indicating less negative impression) than the original SADL data (Cox &
Alexander, 1999; Cox & Alexander, 2001) (Table 4), possibly because there was a higher proportion of digital hearing aid users in the present study population.
The personal image subscale addresses aesthetic factors and the social stigma of using a hearing aid. The population in the present study had younger hearing aids users (Table 2) than the previous study of SADL, which had a mean subject age of 75 years (Cox & Alexander, 1999). This may explain the general impression of lower capability while using hearing aids in the CSADL study population than the previous study (Cox & Alexander, 1999).
T
here are several limitations in the current study. F irst, since the primary focus of this study is instrument validation; the influences of device types and styles, daily use hours and experiences of using hearing aids on the satisfaction were not analyzed. S econd, user characteristics were not controlled, such as personality traits ( Meister et al, 2012) ,
lifestyle, motivation, and expectations . F or example, a nxious people may be less satisfied with hearing aids, and energetic people may have higher satisfaction; users with high expectation may pay more attention to services from providers; and users who have
active social life may be more concerned about personal image (Meister et al, 2012). Also, the socioeconomic level is an important factor since our data demonstrated service and cost affected the overall satisfaction a lot. B esides, we did not evaluate the self-reported hearing disability, hearing disability perceived by others, and change in the behaviors, which were shown to influence the outcome of hearing aids as well. ( Laplante-Lévesque et al, 2012) Furthermore , no specific evaluation of content validity of CSADL was done because content validity had been established in the original SADL; this may be important because diverse cultural characteristics and medical environment may result in different perceptions and attitudes about hearing aid use. Establishment of CSADL Taiwan norm to conduct comparative satisfaction studies will be our future research focus.
CONCLUSION
This study confirms that the CSADL is a valid and reliable questionnaire to assess satisfaction among Chinese-speaking hearing aid users. The CSADL survey data may be useful for international comparison.
ACKNOWLEDGEMENTS
The authors thank Professor Robyn M. Cox ‘s authorization to use SADL. Authors also thank Ms. Li-Ju Chuang of the Cathay Medical Research Institute for her assistance with data management.
DECLARATION OF INTEREST
Financial support: none. Disclosure: none.
REFERENCES
Brazier, J.E., Harper, R., Jones, N.M., O'Cathain, A., Thomas, K.J., et al. 1992. Validating the SF-36 health survey questionnaire: new outcome measure for primary care. BMJ, 305, 160-164.
Clark, J. G. (1981). Uses and abuses of hearing loss classification. ASHA , 23 , 493–500.
Cox, R.M., Alexander, G.C. 1999. Measuring satisfaction with amplification in daily life: the SADL scale. Ear Hear, 20, 306-320.
Cox, R.M., Alexander, G.C. 2001. Validation of the SADL questionnaire. Ear Hear, 22, 151-160.
Cox R.M., Stephens D. & Kramer S.E. 2002. Translations of the international outcome inventory for hearing aids (IOI-HA). Int J Audiol , 41(1), 3–26
Cox R.M. & Alexander G.C. 2002. The international outcome inventory for hearing aids (IOI-HA): Psychometric properties of the English version. Int J Audiol , 41(1), 30–5.
Dillon, H., James, A., Ginis, J. 1997. Client Oriented Scale of Improvement (COSI) and its relationship to several other measures of benefit and satisfaction provided by hearing aids. J Am Acad Audiol, 8, 27-43.
Gatehouse, S. 1999. A self-report outcome measure for the evaluation of hearing aid fittings and services. Health Bull (Edinb), 57, 424 -436.
Hosford-Dunn, H., Halpern, J. 2000. Clinical application of the satisfaction with amplification in daily life scale in private practice I: statistical, content, and factorial validity. J Am Acad Audiol, 11, 523-539.
Hosford-Dunn, H., Halpern, J. 2001. Clinical application of the SADL scale in private practice II: predictive validity of fitting variables. Satisfaction with Amplification in Daily Life. J Am Acad Audiol, 12, 15-36.
Kochkin, S. 2005. MarkeTrak VII: Consumer satisfaction with hearing instruments in the digital age. Hear J, 58, 30-43.
Laplante-Lévesque A, Hickson L, Worrall L. 2012. What makes adults with hearing impairment take up hearing AIDS or communication programs and achieve successful outcomes? Ear Hear , 33 , 79-93.
McHorney, C.A., Ware, J.E. Jr., Raczek, A.E. 1993. The MOS 36-Item Short-Form Health Survey (SF-36): II. Psychometric and clinical tests of validity in measuring physical and mental health constructs. Med Care, 31, 247-263.
inventory, satisfaction with amplification in daily life, at 2 weeks post hearing aid fitting. Ear Hear, 22, 342–347.
Meister, H., Grugel, L., Meis, M., Kiessling, J. 2012. Use of self-assessment inventories in hearing-aid provision: German versions of ECHO and SADL. Int J Audiol, 51, 135-142.
Nunnally, J.C. (ed.) 1978. Psychometric theory: second edition. New York, NY: McGraw-Hill.
Shumaker, S.D. & Berzon, R. (eds.) 1995. The international assessment of health-related quality of life: theory, translation, measurement and analysis. Oxford, UK: Rapid
Communications.
Surr, R.K., Cord, M.T., Walden, B.E. 1998. Long-term versus short-term hearing aid benefit. J Am Acad Audiol, 9, 165–171.
Ware, J.E. (1993). Validity: norm-based interpretation. Ware, JE (eds.) SF-36 health survey manual and interpretation guide. Boston, Mass: Nimrod Press, pp. 1-10.
Ware, J.E. Jr., Sherbourne, C.D. 1992. The MOS 36-item short-form health survey (SF-36). I. Conceptual framework and item selection. Med Care, 30, 473-483.
FIGURE LEGEND
Figure 1. Chinese version of the Satisfaction with Amplification in Daily Life (CSADL) Figure 2. Relation between retest and test scores for the 4 subscales of the Chinese version of Satisfaction with Amplification in Daily Life
Table 1. Original Satisfaction with Amplification in Daily Life (SADL) Survey
Item Number Subscale Item Number Question§
1 PE1 Compared to using no hearing aid at all, do your hearing aids help you understand the people you speak with most frequently?
2* NF1 Are you frustrated when your hearing aids pick up sounds that keep you from hearing what you want to hear?
3 PE2 Are you convinced that obtaining your hearing aids was in your best interests?
4* PI1 Do you think people notice your hearing loss more when you wear your hearing aids?
5 PE3 Do your hearing aids reduce the number of times you have to ask people to repeat?
6 PE4 Do you think your hearing aids are worth the trouble? 7* NF2 Are you bothered by an inability to get enough loudness
from your hearing aids without feedback (whistling)?
8 PI2 How content are you with the appearance of your
hearing aids?
9 PE5 Does wearing your hearing aids improve your
self-confidence?
10 PE6 How natural is the sound from your hearing aids?
11 NF3 How helpful are your hearing aids on MOST telephones with NO amplifier or loudspeaker?
12 SC1 How competent was the person who provided you with your hearing aids?
13* PI3 Do you think wearing your hearing aids makes you seem less capable?
14 SC2 Does the cost of your hearing aids seem reasonable to you?
15 SC3 How pleased are you with the dependability (how often they need repairs) of your hearing aids?
*Reverse item
§Answer options: A-not at all (1), B-a little(2), C-somewhat(3), D-medium(4), E-considerably(5), F-greatly(6), G-tremendously(7) PE: positive effect, NF: negative feature, SC: service and cost, PI: personal image
Table 2. Clinical Characteristics of Subjects with Hearing Loss who were Tested with the Chinese Version of Satisfaction with Amplification in Daily Life *
Clinical characteristic Mean ± SD (range) or number (%)
Age (y) 57 ± 23 (4 to 90)
Sex, male 84(54)
Hearing loss time (y) 13 ± 10 (1 to 52)
Hearing loss type †
Flat sensorineural 126(84)
High frequency sensorineural 12(8)
Mixed conductive-sensorineural 8(5)
Conductive 4(3)
Level of unaided hearing loss ‡
Mild 43(28)
Moderate 81(53)
Severe 28(18)
Hearing aid style ǁ
In-the-canal 73(50)
Behind-the-ear 57(39)
In-the-ear 13(9)
Body worn 1(1)
Speculate bone conduction 1(1)
Hearing aid type §
Digital 121(79)
Analog 32(21)
Unilateral or bilateral §
Bilateral 87(57)
Unilateral 66(43)
Daily use of hearing aid (h) ‡
> 8 70(46)
4 to 8 59(39)
1 to 4 23(15)
Duration of hearing aid use
> 10 y 22(14)
1 to 10 y 84(54)
6 wk to 11 mo 39(25)
< 6 wk 10(6)
* N = 155 subjects. Data reported as mean ± SD (range, minimum to maximum) or number (%) † N = 150 subjects; data not available in 5 subjects
‡ N = 152 subjects; data not available in 3 subjects ǁ N = 145 subjects; data not available in 10 subjects § N = 153 subjects; data not available in 2 subjects
Table 3. Subscale Results and Internal Consistency of the Chinese Version of Satisfaction with Amplification in Daily Life
Satisfaction with
Amplification in Daily Life (SADL) *
Chinese version of SADL (CSADL)
Mean ± SD Cronbach α Mean ± SD Cronbach α Subscale
Positive Effect 5 ± 1 0.88 5 ± 1 0.92
Service and Cost 5 ± 1 0.61 4.5 ± 0.9 0.65
Negative Features 4 ± 1 0.54 5.4 ± 0.9 0.63
Personal Image 6 ± 1 0.59 5 ± 1 0.71
Global score 5 ± 1 0.85 5.0 ± 0.9 0.92
* Data from Cox & Alexander, 1999
Satisfaction with Amplification in Daily Life *
--Satisfaction with Amplification-- ---Chinese version of SADL---in Daily Life
(SADL) * (CSADL) P ≤
No.
subjects Mean ± SD Item to total score correlation coefficient†
No.
subjects Mean ± SD Item to total score correlation coefficient† Positive Effect PE1 225 5 ± 1 0.76 155 5 ± 1 0.83 .05 PE3 225 6 ± 2 0.72 155 5 ± 1 0.85 .05 PE5 225 5 ± 1 0.69 155 5 ± 2 0.86 .05 PE6 225 6 ± 2 0.80 155 5 ± 1 0.86 .05 PE9 225 4 ± 2 0.67 155 5 ± 1 0.90 .05 PE10 225 4 ± 1 0.57 155 4 ± 1 0.76 .05
Service and Cost
SC12 126 6 ± 1 0.46 155 5 ± 1 0.72 .05 SC14 126 4 ± 2 0.45 154 3 ± 1 0.71 .05 SC15 126 5 ± 1 0.45 155 5 ± 1 0.87 .05 Negative Features NF2 217 4 ± 2 0.38 155 6 ± 1 0.76 .05 NF7 217 4 ± 2 0.39 155 6 ± 1 0.69 .05 NF11 217 3 ± 2 0.30 155 5 ± 2 0.84 .05 Personal Image PI4 219 6 ± 1 0.49 155 6 ± 1 0.79 .05 PI8 219 5 ± 2 0.33 155 4 ± 2 0.83 .05 PI13 219 6 ± 1 0.41 155 6 ± 1 0.77 .05
Table 5. Correlation Between the Subscales of the Chinese Version of Satisfaction with Amplification in Daily Life
---Spearman correlation
coefficient---Subscale Positive Effect Service and Cost Negative Features Service and Cost 0.68*
Negative Features 0.60* 0.54*
Personal Image 0.62* 0.69* 0.63*
Table 6. Test-Retest Reliability of the Chinese Version of Satisfaction with Amplification in Daily Life
Subscale No. subjects r* P ≤
Positive Effect 39 0.98 .0000
Service and Cost 39 0.97 .0000
Negative Features
39 0.93 .0000
Personal Image 39 0.94 .0000
Global score 39 0.98 .0000
Table 7. Relation between speech discrimination score and the Chinese Version of Satisfaction with Amplification in Daily Life
Subscale Aided SDS for
better ear (r)* Aided SDS for worse ear (r)* P ≤
Positive Effect 0.115 -0.303 .05
Service and Cost 0.063 -0.27 .05
Negative Features 0.113 0.282 .05
Personal Image 0.14 -0.403 .05
Table 8. Relation Between Subscores of the Mandarin Chinese Taiwan version of Medical Outcome Study 36-item Short-Form Health Survey and the Chinese Version of Satisfaction with Amplification in Daily Life *
---Spearman correlation coefficient---CSADL * TSF-36 * M ean, SD, range Positive
Effect Service and Cost Negative Features Personal Image Global Role functioning 77.33 ± 26.17(0-100) 0.113 0.139 0.241 † 0.153 0.129 Role physical 67.06 ± 43.45(0-100) 0.088 0.072 0.104 0.033 0.122 Bodily pain 78.16 ± 22.97(0-100) 0.056 0.058 0.088 -0.011 0.072 General health 66.83 ± 23.26(0-100) 0.135 0.206 † 0.164 † 0.007 0.236 † Vitality 63.38 ± 19.69(10-100) 0.139 0.119 0.089 -0.047 0.162 † Social functioning 75.25 ± 21.94(0-100) 0.127 0.196 † 0.197 † 0.068 0.190 † Role emotional 74.55 ± 41.76(0-100) 0.124 0.147 0.121 0.116 0.150 Mental health 72.23 ± 15.27(12-100) 0.131 0.187 † 0.106 0.085 0.224 †
* Abbreviations: TSF-36, Mandarin Chinese Taiwan version of Medical Outcome Study 36-item Short-Form Health Survey; CSADL, Chinese Version of Satisfaction with Amplification in Daily Life
Table 9. Relation between the single-item satisfaction index score and the 4 Subscales of the Chinese Version of Satisfaction with Amplification in Daily Life
Subscale r* P ≤
Positive Effect 0.75 .0000
Service and Cost 0.87 .0000
Negative Features 0.61 .0000
Personal Image 0.65 .0000
Global score 0.84 .0000
FIGURES
Figure 1. Chinese version of the Satisfaction with Amplification in Daily Life (CSADL)
Figure 2. Relation between retest and test scores for the 4 subscales of the Chinese version of Satisfaction with Amplification in Daily Life
1 2 3 4 5 6 7 1 2 3 4 5 6 7 R e te s 1 2 3 4 5 6 7 1 2 3 4 5 6 7 1 2 3 4 5 6 7 1 2 3 4 5 6 7 Test R e te s 1 2 3 4 5 6 7 1 2 3 4 5 6 7 Test Positive Effect Service & Cost Personal Image Negative Features R et es t s co re R et es t s co re Test score Test score