Labor-intensive Industrialization:
The Case of Taiwan (1954-1996)
Ts’ui-jung Liu*
This paper was originally delivered at the Osaka Workshop on Labor-intensive Industrialization in Global History: Asian Experience and Comparative Perspective, December 18-19, 2000. It was not formally published.
Abstract
This paper aims to trace the process of Taiwan’s industrialization by utilizing the data of industrial and commercial censuses. From 1954 to 1996, there are nine sets of industrial and commercial census data available. It is found that Taiwan's labor-intensive industrialization took mostly during the period from 1953 to 1978. The year 1953 marked the point when total value of industrial production exceeded the highest value ever reached during Japanese colonial period (1895-1945), and the year 1978 marked a turning point of transformation from light to heavy industry predominance.
By grouping manufacturing into four types and comparing shares of enterprise unit, persons engaged, wage paid, total assets in operation, total value of production and value added, it is found that Type I, manufacturing related to products of daily necessity, predominated in 1954. However, the shares were almost equally distributed among the four types in 1996, especially in respect to total assets in operation and value added. It is notable that after 1981, the difference of labor intensity among the four types of manufacturing gradually disappeared. A large increase was found in the degree of capital concentration during 1971-1976, and this contributed to the transformation of Taiwan's industrial structure. It is also found that relatively high wage rate helped to push Taiwan's manufacturing to upgrade technical levels and to find investment for labor-intensive industries outside the Island.
____________
INTRODUCTION
This paper aims to trace the process of Taiwan’s industrialization by utilizing the data of industrial and commercial censuses. The first census of this genre was carried out in Taiwan in 1954, and from 1961 onward such censuses were conducted once every five years. Thus, there are nine sets of industrial and commercial census data available to date.
In general, these censuses were comprehensive inquiries; the data collected were related to production, structure of industry and geographical distribution.1 The plan of each census was well designed, and personnel well organized at different administrative levels in charge of executing the program. The scope of these censuses comprised seven major lines of business: (1) mining and quarrying, (2) manufacturing, (3) construction, (4) electricity, gas and water, (5) commerce, (6) transportation, storage and warehousing, and (7) services.2 The first four lines of business belong to the industrial sector, while the last three to the commercial sector. This paper attempts to focus only on manufacturing in the industrial sector as its number of enterprise units had a share of 93 percent in 1954, remained around 85 percent until 1991, and still counted for 76 percent in 1996 [See Table 1(1)]. In other words, it is assumed that changes in the manufacturing sector should reflect to a great extent the phenomenon of industrialization in Taiwan.
In the following paper, I will start with the historical background of industrial development in Taiwan, and then apply the census statistics to trace the changing process and variation of performance among manufacturing industries. Suitable indicators are derived to serve the purpose of analysis.
1. HISTORICAL BACKGROUND
The development of modern industry in Taiwan can be traced back to the Japanese colonial period (1895-1945). Available statistics show that in Taiwan the number of factories equipped with power machinery was 642 in 1915 and 6,150 in 1936; an increase of nearly 10-fold in twenty years. From 1918 to 1940, the total horsepower used by these factories increased from 17,078 to 234,574; an increase of more than 13
1
For a study on geographical distribution of Taiwan’s manufacturing industries, see Ts’ui-jung Liu, “Regional Variation of Industrial Development in Taiwan,” (forthcoming). Note: The article was published in Ts’ui-jung Liu and Shou-chien Shih (eds.), Economic History, Urban Culture and Material Culture: Papers from the third International Conference on Sinology (經濟史、都市文化與 物質文化:第三屆國際學會議論文集), (Taipei: Institute of History and Philology, Academia Sinica, June, 2002), pp. 225-264.
2
times. Light industry persisted to be predominant; its share counted for 92 percent in 1912 and 72 percent in 1942. Moreover, among light industries, food and beverage manufacturing had a share of production value as high as 81 percent until 1942; and among this group, sugar manufacturing was the leading one with its production value counted for more than 50 percent of the total in 1939.
After the Second World War, Taiwan was returned to the Chinese Nationalist Government and production activities gradually resumed after a short period of political turmoil and hyperinflation. Calculated in terms of 1986 prices, the industrial production value totaled NT$63,721 in 1953 and surpassed the highest amount ever reached in the colonial period, NT$52,850 in 1942. It was also in 1953 that the government began to undertake the first four-year economic planning project, which was followed by later projects.
With the time series data calculated in terms of 1986 prices, it can be seen that except for the two world war periods, both the total industrial production value and industrial gross domestic products grew faster after the 1950s than before, and the growth rates appear to be more stable. On average, the annual growth rate of industrial production value was 6.73 percent during 1902-1942 and 12.71 percent during 1953-1990. Furthermore, the gap between the shares of light and heavy industries had been narrowed down by the end of the Japanese colonial period but it was actually closing in the late 1960s. After a lingering period due to the oil crisis in 1974-1976, the two industry groups finally switched their positions after 1978. This demonstrates that Taiwan’s industrial structure changed more substantially after 1978.3
With regard to policies of industrial development in Taiwan, a recent study pointed out: “There was no single model or set of policies that was pursued unchanged throughout the four decades.”4 In brief, the government’s industrial policy can be traced in three phases: (1) the import-substitution phase from 1953 to 1960, (2) the export-expansion phase from 1961 to 1972, and (3) the phase of industrial structure adjustment after 1973. The third phase can be subdivided with 1978 as the watershed; the first sub-phase emphasized a general development of chemical and heavy industry while the second one pursued development of strategic industries. Moreover, economic liberalization measures were undertaken since the mid-1980s.5
3
For the above historical background see, Yeh Shu-cheng, “An analysis on the features of Taiwan’s industrial development from historical perspective,” in Topics on History of Contemporary China (in Chinese) edited by The Historical Material Center of the Republic of China, Vol. 17 (1995), pp. 508-610.
4
Li-min Hsueh, Chen-kuo Hsu, and Dwight H. Perkins, Industrialization and the State: The Changing Role of the Taiwan Government in the Economy, 1945-1998 (Cambridge, Massachusetts: Harvard Institute for International Development, distributed by Harvard University Press, 2001), p. 1; for details see chapters 2 and 3.
5
The industries promoted by the government in the 1950s were labor-intensive ones such as textiles, food processing, leather, rubber, and plywood manufacturing to substitute for imports. During 1961-1972, the industries promoted were mainly for exports. Some of them, such as plywood, cement, sheet glass, plastic, and textiles, had already developed in the previous phase for substituting imports, and in this phase they were encouraged to expand into foreign markets under the Statute for Encouraging Investment that was enacted in 1960.6 In addition, some industries, such as canned mushrooms and asparagus and electronic parts, were newly promoted for export. The third phase began with ten major construction projects initiated in 1973 and further reinforced with an announcement in 1979 to undertake a ten-year planning project from 1980 to 1989. Thus, iron and steel products, shipbuilding, machinery, electrical and electronic machinery, communication equipment, and motor vehicles were all strategically promoted. From 1991 onwards, the Statute for Promoting Industrial Upgrading emphasized on promoting investments on technologies related to automatic equipment, resource recycling and pollution prevention, energy-saving and reutilization of industrial water.7
With the above brief overview of historical background, this paper attempts to further investigate the shift from labor-intensive to capital-intensive industrialization in Taiwan by utilizing the census data.
2. GROUPING OF MANUFACTURING INDUSTRIES
In each census report, more than one hundred manufacturing items were listed individually under certain groupings that varied slightly from one census to the other. It is necessary to regroup them to some extent for the purpose of analysis. There are various ways of grouping. This paper adopts grouping into four types with 22 subordinate categories as shown below.
Type I: Manufacturing related to products of daily necessity. This type includes eight categories: (1) food and beverage, (2) tobacco, (3) textiles, (4) apparel, (5) wood and bamboo products, (6) non-metal furniture and fixtures, (7) non-metallic mineral products, and (8) miscellaneous items.
Type II: Metal and machinery industries. This type includes four categories: (9) basic metal, (10) fabricated metal products, (11) machinery and equipment, and (12) transport equipment.
(in Chinese), paper delivered at Conference on the Development of Capitalism in Taiwan, December 27-28, 2001, Taipei: Sun Yat-sen Institute for Social Sciences and Philosophy, Academia Sinica.
6
The statute was revised several times to meet the needs of changing economic situations until it was replaced by the Statute for Promoting Industrial Upgrading in 1990. See Li-min Hsueh, Chen-kuo Hsu, and Dwight H. Perkins, pp. 30-31.
7
Type III: Chemical industry. This type includes eight categories: (13) leather and fur products, (14) pulp and paper products, (15) printing, engraving and publishing, (16) chemical matters, (17) chemical products, (18) petroleum and coal products, (19) rubber products, and (20) plastic products.
Type IV: Electrical, electronic and precision industry. This type includes two categories: (21) electrical and electronic machinery and (22) precision machinery.
3. CHANGING SHARES
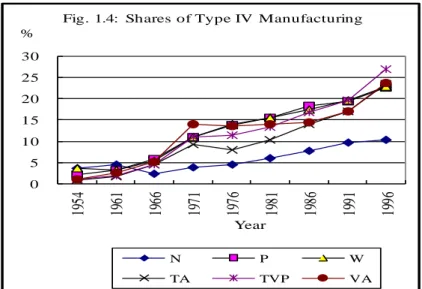
To observe the changing structure in manufacturing, six indicators of shares are presented here. These are shares of enterprise unit (N), persons engaged (P), wages paid (W), total assets in operation (TA), total value of production (TVP), and gross value added (VA). Table 1 shows a summary of these shares by four types of manufacturing. Figures 1.1 to 1.4 depict changes in these indicators by four types. Details of the 22 categories are listed in Appendix Tables 1.1 to 1.6. With these data, we may make the following observations.
To begin with manufacturing as a whole, its number of enterprise units constituted 93 percent of the industrial sector in 1954 and declined to 76 percent in 1996. Its growth rate from one time point to the other was 0.2005 (or 0.04 per year), about the same as the entire industrial sector (0.2255). In respect to number of persons engaged the share of total labor force in manufacturing increased from 10 percent in 1954 to 35 percent in 1986 and then declined to 27 percent in 1996. Yet, its growth rate of persons engaged (0.2907) was higher than that of the total labor force (0.1436). In addition, the growth rate of wages was 0.9123 (or 0.9020 counting in US$), that of total assets in operation was 0.9061 (or 0.8958), that of total value of production was 0.8319 (or 0.8215), and that of value added was 0.8195 (or 0.8091).
Type I manufacturing declined in share rather monotonically throughout the entire period under observation. Before 1976, among the six variables, N, W, TVP and VA appeared to have decreased more than P and TA. On average, from one time point to the other the share of N decreased 5.95 percentage points, P decreased 5, W decreased 5.78, TA decreased 5.12, TVP decreased 6.56, and VA decreased 6.06. It is notable that among the eight industries belonging to Type I, the largest decrease was found in food and beverage manufacturing in these six variables. The textile industry had the next largest decrease in P, TA, TVP and VA. In general, Type I manufacturing was declining, however, apparel, furniture and miscellaneous manufacturing were able to keep a small positive rate of change on average in TVP and VA.
the share of N increasing proportionately more than other variables. On average, the rate of change in N was 3.17 percentage points, P was 1.68, W was 1.36, TA was 2.02, TVP was 2.20, and VA was 2.13. Among the four industries of Type II, metal products had the largest increase in N, P, W and VA while the basic metal industry had the largest increase in TA and TVP.
Type III manufacturing had these shares increased until 1991 and then they declined slightly. On average, the rate of change in Type III was less than type II. The share of N increased 1.97 percentage points, P increased 0.83, W increased 2.10, TA increased 0.40, TVP increased 1.11, and VA increased 1.21. Variations among the six shares are quite apparent, especially from 1954 to 1981. Among the eight industries under Type III, plastic products had the largest average rate of change in all these shares.
Type IV manufacturing became important after 1971. Its share of N did not reach 10 percent until 1991; however, its shares in P, W, TVP, and VA all surpassed 10 percent in 1971. It is notable that in 1996, with a share of 10.32 percent of N, this type had a share of 22.53 percent of P, 22.94 percent of W, 23.53 percent of TA, 26.97 percent of TVP, and 23.76 percent of VA. Except for enterprise units, the average rate of change in other variables of Type VI ranged from 2.55 to 3.25 percentage points. It is obvious that the increase was gained mostly by electrical and electronic machinery manufacturing.
Table 1: Shares by Types of Manufacturing (1) Share of Enterprise Units
Year Type I % Type II % Type III % Type IV % Total Number Manufacturing Industrial Sector* Manufacturing ( %) 1954 71.27 19.02 6.05 3.66 39,748 42,897 92.66 1961 64.72 21.65 9.10 4.54 51,567 56,942 90.56 1966 65.79 18.01 13.80 2.40 27,709 33,389 82.99 1971 57.08 21.33 17.76 3.82 42,636 49,012 86.99 1976 43.97 31.68 19.84 4.51 69,517 79,301 87.66 1981 37.41 36.12 20.51 5.96 91,499 105,024 87.12 1986 32.84 36.84 22.49 7.83 113,639 129,103 88.02 1991 28.05 39.91 22.52 9.65 140,572 166,729 84.31 1996 23.64 44.39 21.77 10.32 154,675 204,033 75.81
Ave. Rate of Change -5.95 3.17 1.97 0.83
Exponential Growth Rate between intervals 0.2005 0.2155
*Each number is a summation of enterprise units in mining and quarrying, manufacturing, construction, and electricity, gas and water as given in the statistics of the censuses.
(2) Shares of Persons Engaged Year Type I % Type II % Type III % Type IV % Total Number
Manufacturing Total Labor
Force* Manufacturing (%) 1954 66.53 16.81 14.55 2.11 309,887 3,149,000 9.84 1961 63.75 16.97 16.03 3.25 445,667 3,655,000 12.19 1966 58.87 16.16 19.24 5.73 589,660 3,976,000 14.83 1971 53.77 14.28 20.95 11.00 1,201,539 4,819,000 24.93 1976 46.09 18.60 21.55 13.76 1,907,581 5,772,000 33.05 1981 40.92 20.02 23.46 15.61 2,196,691 6,764,000 32.48 1986 36.11 20.75 24.82 18.32 2,753,944 7,945,000 34.66 1991 31.41 26.38 23.45 19.38 2,665,435 8,569,000 31.11 1996 26.54 30.25 21.23 22.53 2,524,104 9,310,000 27.11
Ave. Rate of Change -5.00 1.68 0.83 2.55
Exponential Growth Rate between intervals 0.2907 0.1436
* These numbers are taken from the Statistical Yearbook of the Republic of China, 1991: p. 108, 1996: p. 48, 1999: p. 48.
(3) Share of Wage Paid
Year Type I % Type II % Type III % Type IV % Total Value NT$ Million US$ Million* 1954 71.14 18.88 6.33 3.65 1,039 66 1961 56.14 20.08 20.60 3.18 3,079 77 1966 54.59 16.96 22.98 5.47 7,409 185 1971 50.60 15.02 23.44 10.94 25,628 641 1976 43.50 19.34 23.25 13.90 97,697 2,574 1981 38.55 21.57 24.41 15.47 232,887 6,163 1986 34.46 20.95 27.06 17.53 471,923 13,312 1991 29.11 27.18 24.66 19.68 752,486 29,280 1996 24.88 29.72 23.12 22.94 1,065,272 38,822
Ave. Rate of Change -5.78 1.36 2.10 2.41
Exponential Growth Rate between intervals 0.9123 0.9020 *The exchange rates for the amount of NT$ to 1 US$ were as follows:
1954: 15.65, 1961-1971: 40.00, 1976:37.95, 1981: 37.79, 1986:35.45, 1991: 25.70, 1996: 27.44. See the Statistical Abstract of the Republic of China, 1981: p. 520; the Statistical Yearbook of the Republic of China, 1999: p. 326.
(4) Share of Total Assets in Operation
Year Type I % Type II % Type III % Type IV % Total Value NT$ million US$ million 1954 66.30 9.62 23.19 0.89 8,629 551 1961 65.62 9.99 22.69 1.69 21,549 539 1966 55.54 10.53 29.34 4.59 87,473 2,187 1971 47.34 13.82 29.62 9.21 238,136 5,953 1976 41.43 20.45 30.26 7.86 1,052,642 27,738 1981 36.26 25.41 28.07 10.26 2,052,698 54,319 1986 31.25 23.85 30.94 13.96 2,992,458 84,413 1991 29.12 27.08 27.43 17.09 6,004,837 233,651 1996 25.30 25.75 26.36 23.53 10,097,685 367,991
Ave. Rate of Change -5.12 2.02 0.40 2.83
(5) Share of Total Value of Production Year Type I % Type II % Type III % Type IV % Total Value NT$ million US$ million 1954 74.25 9.42 15.33 1.00 11,418 730 1961 65.45 12.27 20.30 1.97 37,743 944 1966 60.46 11.88 23.17 4.49 85,287 2,132 1971 52.15 12.88 23.96 11.02 242,940 6,074 1976 45.29 15.94 27.30 11.48 819,276 21,588 1981 35.48 19.55 31.73 13.25 2,044,085 54,091 1986 33.05 20.54 29.61 16.80 3,353,886 94,609 1991 26.49 27.44 26.43 19.64 4,948,378 192,544 1996 21.80 27.02 24.21 26.97 7,245,602 264,053
Ave. Rate of Change -6.56 2.20 1.11 3.25
Exponential Growth Rate between intervals 0.8319 0.8215
(6) Shares of Value Added
Year Type I % Type II % Type III % Type IV % Total Value NT$ million US$ million 1954 73.54 9.38 15.97 1.10 3,538 226 1961 65.19 13.76 18.52 2.53 19,308 483 1966 51.00 12.38 31.48 5.14 22,521 563 1971 42.24 11.81 31.94 14.02 41,336 1,033 1976 47.33 13.31 25.72 13.63 193,311 5,094 1981 40.58 19.99 25.47 13.96 536,048 14,185 1986 34.62 19.54 31.36 14.42 945,805 26,680 1991 30.01 25.20 28.73 17.02 1,610,344 62,659 1996 25.05 26.42 25.67 23.76 2,271,573 82,783
Ave. Rate of Change -6.06 2.13 1.21 2.83
Exponential Growth Rate between intervals 0.8195 0.8091
Figure 1.1: Shares of Type I Manufacturing
0 10 20 30 40 50 60 70 80 19 54 19 61 19 66 19 71 19 76 19 81 19 86 19 91 19 96 % Year
Fig. 1.1: Shares of Type I Manufacturing
N P W
Figure 1.2: Shares of Type II Manufacturing
Figure 1.3: Share of Type III Manufacturing
Figure 1.4: Shares of Type VI Manufacturing
0 10 20 30 40 50 19 54 19 61 19 66 19 71 19 76 19 81 19 86 19 91 19 96 % Year
Fig 1.2: Shares of Type II Manufacturing
N P W TA TVP VA 0 5 10 15 20 25 30 35 19 54 19 61 19 66 19 71 19 76 19 81 19 86 19 91 19 96 % Year
Fig 1.3: Shares of Type III Manufacturing
N P W TA TVP VA 0 5 10 15 20 25 30 19 54 19 61 19 66 19 71 19 76 19 81 19 86 19 91 19 96 % Year
Fig. 1.4: Shares of Type IV Manufacturing
N P W
In short, starting with a predominance of Type I in 1954, the manufacturing sector in Taiwan became almost equally shared by the four types, especially in respect to total assets in operation, total value of production and value added. This tendency of development can also be seen in the degree of labor intensity and capital concentration to be discussed below.
4. DEGREE OF EFFICIENT LABOR INTENSITY
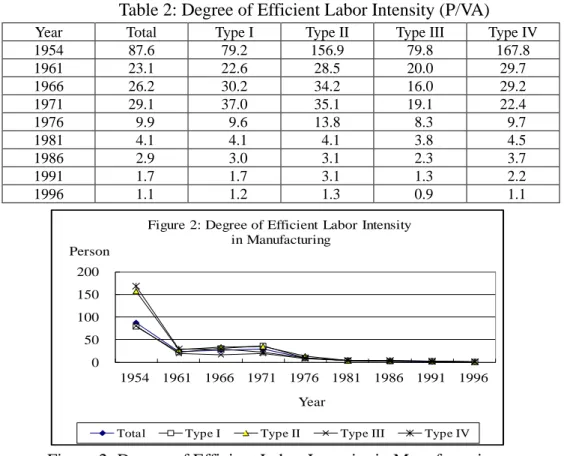
In the literature, degree of labor intensity is usually measured by the amount of labor required for producing a certain amount of domestic income by each production sector.8 With available statistics provided by the industrial and commercial censuses, this paper tries to measure labor intensity by the ratio of persons engaged in production to the value of value added (P/VA), i.e., the number of persons required to produce one million NT dollars of value added. Since value added is one way of demonstrating the efficiency of an industry, this measurement may be called a “degree of efficient labor intensity”. Table 2 lists a summary of the entire manufacturing sector with divisions into four types, and Figure 2 is a depiction of the statistics. Details of the 22 categories are listed in Appendix Tables 2.1 and 2.2.
Table 2: Degree of Efficient Labor Intensity (P/VA)
Year Total Type I Type II Type III Type IV
1954 87.6 79.2 156.9 79.8 167.8 1961 23.1 22.6 28.5 20.0 29.7 1966 26.2 30.2 34.2 16.0 29.2 1971 29.1 37.0 35.1 19.1 22.4 1976 9.9 9.6 13.8 8.3 9.7 1981 4.1 4.1 4.1 3.8 4.5 1986 2.9 3.0 3.1 2.3 3.7 1991 1.7 1.7 3.1 1.3 2.2 1996 1.1 1.2 1.3 0.9 1.1
Figure 2: Degree of Efficient Labor Intensity in Manufacturing
8
Hsiao Chih-t’ung, “An analysis on the structure of labor intensity among export commodities from Taiwan,” Monthly Journal of Taipei Bank, Vol. 26, No. 11 (November 1996), p. 64.
0 50 100 150 200 1954 1961 1966 1971 1976 1981 1986 1991 1996 Person Year
Figure 2: Degree of Efficient Labor Intensity in Manufacturing
It is not surprising that in 1954, every category of manufacturing in Taiwan was labor-intensive. For the entire manufacturing sector, to produce one million NT dollars of value added required 87.6 persons. For Type I and Type III, the number of persons required was around 80, while for Type II and Type IV the number was almost double. The statistics of 1961 show that the degree of efficient labor intensity improved rather drastically, but from then until 1971 it remained more or less around 20-35 persons. From 1976 onwards, the degree of efficient labor intensity continued to improve, and from 1981 differences among four types gradually disappeared. In 1996, to produce one million NT dollars (approximately US$ 36,443 at the 1996 exchange rate) of value added required more or less one person; Type III required 0.9, Type IV required 1.1, Type I required 1.2, and Type II required 1.3.
Details of the 22 categories reveal that in 1954 the most labor-intensive industry was precision machinery manufacturing that required 275 persons to produce one million NT$ dollars of value added. Apparel, furniture and fixture manufacturing followed suit and required about 240 persons. Metal products required 199 persons, ranking fourth. Miscellaneous manufacturing required 191 persons and ranked fifth. From the other end, the least labor-intensive industry was tobacco manufacturing that required only 8.2 persons, followed by petroleum and coal products that required 36.3 persons and chemical matter manufacturing that required 55.9 persons. It is notable that the ranking of efficient labor-intensity remained more or less the same even the degree had been greatly reduced in 1996. In 1996, ranking from the top were apparel that required 2.2 persons, wood and bamboo products together with furniture and fixtures that required 1.9 persons and precision machinery and miscellaneous manufacturing that required 1.8 persons. From the other end, tobacco and petroleum and coal products both required only 0.2 persons and chemical matters required 0.6 persons. Moreover, 13 of the 22 categories had a degree of efficient labor intensity above the average of 1.1 persons.
In short, improvement in the degree of efficient labor intensity in Taiwan from 1954 to 1996 was remarkable. The number of persons required for producing one million NT dollars of value added in manufacturing had been reduced from 88 to 1. Of course, there is room for further improvement. However, this finding suggests that Taiwan’s manufacturing was actually no longer so labor-intensive in 1996. For maintaining its competition capability, Taiwan’s manufacturing should try not only to reduce labor intensity in its export structure as has been in progress since
1991,9 but also to adjust to the division of labor in the world market.
9
5. DEGREE OF CAPITAL CONCENTRATION
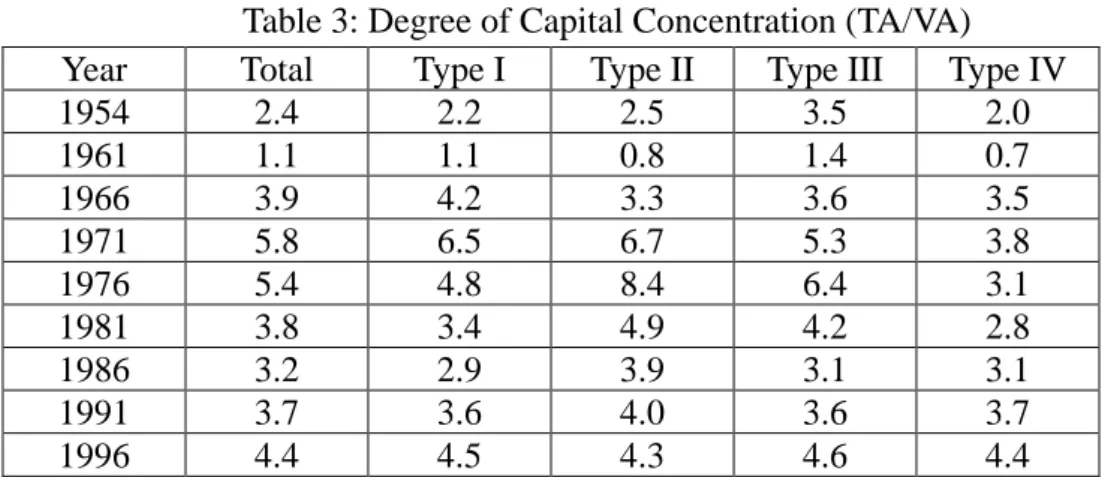
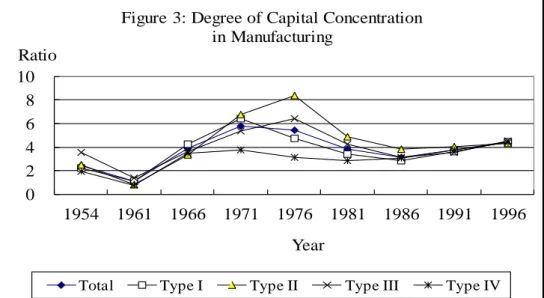
Taking the value of total assets in operation as the capital input, the degree of capital concentration can be simply measured by a ratio of total assets in operation to value added (TA/VA). Table 3 is a summary of the statistics and Figure 3 a depiction of them. Details of the 22 categories are listed in Appendix Tables 3.1 and 3.2.
Table 3: Degree of Capital Concentration (TA/VA)
Year Total Type I Type II Type III Type IV
1954 2.4 2.2 2.5 3.5 2.0 1961 1.1 1.1 0.8 1.4 0.7 1966 3.9 4.2 3.3 3.6 3.5 1971 5.8 6.5 6.7 5.3 3.8 1976 5.4 4.8 8.4 6.4 3.1 1981 3.8 3.4 4.9 4.2 2.8 1986 3.2 2.9 3.9 3.1 3.1 1991 3.7 3.6 4.0 3.6 3.7 1996 4.4 4.5 4.3 4.6 4.4
In contrary to labor intensity, which started with a high degree, the capital concentration began with a low degree in 1954. With a degree of 2.4 for the entire manufacturing sector, Type III was outstanding with a degree of 3.5 while other types followed in the order of Type II (2.5), Type I (2.2) and Type IV (2.0). In other words, the chemical industry was the most capital intensive at that time. In 1961 the degree of capital concentration decreased by more than half in general, but in 1966 it rose up to a level higher than that of 1954. It is notable that the highest degrees were realized in 1971 with 5.8 for the total, 6.5 for Type I and 6.7 for Type II. In 1976, the degree slightly declined to 5.4 for the total but it was 8.4 for Type II and 6.4 for Type III. These figures indicate that facing the global oil crisis, Taiwan had invested more rather than less in order to transform its industry. As mentioned earlier, a transformation took place in a shift from a predominance of light industry to that of heavy industry in 1978.
From 1981 to 1991, the degree of capital concentration remained around 3 to 4 and then slightly increased to around 4.5 in 1996. Again, as in the case of labor intensity, differences among four types gradually disappeared; the degrees almost converged to one point in 1996 as shown in Figure 3. Details of the 22 categories show that in 1954, the paper industry had the highest degree of capital concentration (6.2), followed by basic metals (4.9), chemical matters (4.8), petroleum and coal (3.8), and non-metallic mineral products (3.0). The lowest degree was found in tobacco (1.1) followed by furniture and fixtures (1.4), metal products (1.6), apparel (1.7) and plastic
products (1.8). In 1961, chemical matters had a degree of 3.5 that was quite outstanding compared to 1.1 for the total. In 1971, the highest degree was found in precision machinery (6.8), followed by leather and fur (6.44), textiles (6.39), chemical matters (6.0), and tobacco (5.9).
Figure 3: Degree of Capital Concentration in Manufacturing
It is notable that from 1961 to 1976, investment in textiles was quite substantial as its degree of capital concentration rose from 1.6 in 1961 to 6.4 in 1966, 8.5 in 1971 and 6.8 in 1976. This was the period when textile products occupied the top rank in Taiwan’s export trade and its share of total exports reached 35 percent in 1971 and then declined to 22 percent in 1981.10 During this early stage of development, Taiwan’s textile industry was able to utilize man-made fibers such as rayon, polyester, and acrylic, as raw materials produced by domestic chemical matter manufacturing.11 The first rayon factory was established in Taiwan in 1957 and new ones followed suit quickly.12 According to the census statistics, there were 4 units of enterprises engaged in producing man-made fibers in 1966. The number increased to 17 units in 1971, to 19 units in 1976, to 57 units in 1981, to 91 units in 1986 and then declined to 78 units in 1991 and 75 units in 1996. Owing to over-expansion these man-made fiber
10
Hsieh Kuo-hsing, “Industrial adjustment and enterprise management: Taiwan’s textile industry since the restoration,” in Topics on History of Contemporary China (in Chinese) edited by The Historical Material Center of the Republic of China, Vol. 17 (1995), p. 436. Another study shows that the export of textile products in 1971 was 30.2 percent and in 1981 was 21.2 percent, see Liu Fang-jung, “Investment promotion and the development of textile industry,” (in Chinese), Ts’ai-shui yen-chiu (Finance Studies), Vol. 14, No. 4 (July 1982), p. 46. The inclusion of apparel products explains the difference between these percentages.
11
Hsieh Kuo-hsing, pp. 432-439.
12
Hsieh Kuo-hsing, p. 438; Liu Fang-jung, p. 36; Hua Kuo-cheng, “Taiwan’s chemical industry in development,” (in Chinese), Chung-mei chi-shu (Sino-American Technology), Vol. 15, No. 4 (December 1970), p. 12. 0 2 4 6 8 10 1954 1961 1966 1971 1976 1981 1986 1991 1996 Ratio Year
Figure 3: Degree of Capital Concentration in Manufacturing
factories had a very hard time during 1974-1978 under the impact of the world economic stagflation.13 The expansion in man-made fiber and textile industries was found to be too fast as pointed out in 1977 by Li Kwoh-ting, a Minster without Portfolio, who had served as Minister of Economics (1965-1969) and Minister of Finance (1969-1976). Li also pointed out that the government came to rescue these
industries by means of loans, tax reduction and control of importing raw materials.14 Investment in the basic metal industry was very large in 1971 and 1976 as its
degree of capital concentration was 20.6 and 48.2 respectively. After this big jump, basic metals continued to rank at the top for the degree of capital concentration until 1996. Moreover, investment in tobacco manufacturing was also quite large as its degree of 11.4 was the second highest in 1971. However, this magnitude did not last, as tobacco declined to the lowest degree of capital concentration from 1976 to 1996. In 1981, ranking from the top in order the degree of capital concentration were as follows: basic metals (11.0), petroleum and coal (6.0), chemical matters (5.9), food and beverage (5.7) and paper (4.0). In addition, four industries had a degree around the average of 3.8; these were wood and bamboo (3.98), chemical products (3.97), non-metallic mineral products (3.8), and machinery (3.6). The remaining 13 categories had a much lower degree of capital concentration. In 1986, the average degree of capital concentration declined slightly to 3.2; and it is notable that the degree of food and beverage (4.3) became the second highest next to that of basic metals (6.7).
After 1991, the difference in capital concentration tended to become less than before, as the leading five categories were ranked: basic metals (5.3), wood and bamboo (4.77), paper (4.76), chemical matters (4.71), and chemical products (4.48). In 1996, the order slightly changed in the sequence of basic metals (6.8), chemical matters (6.4), food and beverage (6.2), paper (5.4), and textiles (5.2). It should be mentioned here that in the 1980’s textiles regained their importance in terms of capital concentration, a good example of the transformation from labor-intensive to capital-intensive production. On the one hand, by applying new equipment and new techniques, the textile industry was able to improve the quality of its products. On the other hand, some textile enterprises also succeeded in becoming vertically integrated and thus expanded in scale.15
Another case to be noted here is the electrical and electronic machinery industry. This industry had a largest share of 22.88 percent in total value added in 1996 (see
13
Liu Fang-jung, p. 36.
14
Li Kwoh-ting, “How to further develop domestic chemical industry,” (in Chinese), Shih-yu t’ung-hsun (Petroleum Newsletter), No. 316 (December 1977), p. 3. For details of the government promotion measure regarding the textile industry, see Liu Fang-jung, pp. 36-41.
15
appendix Table 1.6); however, its degree of capital concentration was just around the average level from 1986 to 1996 and its difference in the ranking of capital concentration and labor intensity was rather small. This case seems to suggest that besides capital concentration, other factors must have contributed substantially to gain production efficiency. This point will be brought up again below.
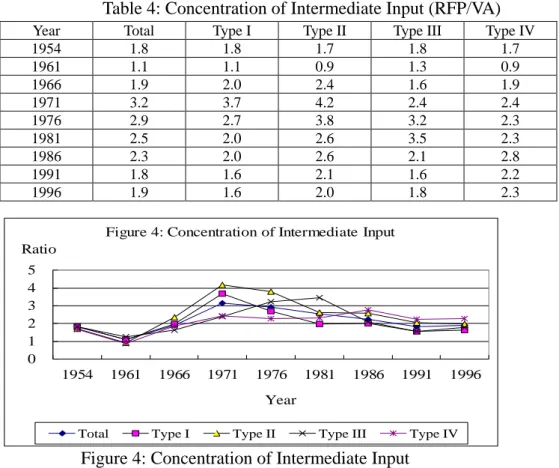
6. CONCENTRATION OF INTERMEDIATE INPUT
In the industrial and commercial census, statistics for the value of raw materials, fuel and power consumed (RFP) were also available except for the year 1961.16 This item can be considered as intermediate input of production. As in the case of capital, the concentration of intermediate input can be measured as a ratio of the value of raw materials, fuel and power consumed to that of value added (RFP/VA). Table 4 lists a summary of the statistics and Figure 4 provides a depiction. Details of the 22 categories are listed in Appendix Tables 4.1 and 4.2.
Table 4: Concentration of Intermediate Input (RFP/VA)
Year Total Type I Type II Type III Type IV
1954 1.8 1.8 1.7 1.8 1.7 1961 1.1 1.1 0.9 1.3 0.9 1966 1.9 2.0 2.4 1.6 1.9 1971 3.2 3.7 4.2 2.4 2.4 1976 2.9 2.7 3.8 3.2 2.3 1981 2.5 2.0 2.6 3.5 2.3 1986 2.3 2.0 2.6 2.1 2.8 1991 1.8 1.6 2.1 1.6 2.2 1996 1.9 1.6 2.0 1.8 2.3
Figure 4: Concentration of Intermediate Input
In general, concentration of intermediate input was less than that of capital; this can be seen by a comparison between Tables 3 and 4 (Figures 3 and 4). In terms of the
16
The ratio between RFP and TVP in 1954 is taken for an estimation of the value of RFP in 1961. 0 1 2 3 4 5 1954 1961 1966 1971 1976 1981 1986 1991 1996 Ratio Year
Figure 4: Concentration of Intermediate Input
entire manufacturing sector, the concentration of intermediate input reached a peak in 1971 (3.2), but it gradually declined; the degree in 1991 was the same as in 1954 (1.8) and that in 1996 was the same as in 1966 (1.9). Type I had a degree that peaked in 1971 (3.7) and then declined to 1996 (1.6), a degree lower than that in 1954 (1.8). Type II had a higher degree than other types, with a peak in 1971 (4.2) and then declined until 1996 (2.0), a degree that was lower than in 1966 (2.4) but higher than in 1954 (1.7). Type III had a degree of 1.8 in 1954, increased to 3.5 in 1981 and then declined to 1.6 in 1991 before slightly increasing to 1.8 in 1996. Type IV had a degree of 1.7 in 1954 and it maintained a level of 2.3-2.4 from 1971 to 1996 with a peak of 2.8 occurring in 1986. It is notable that in 1996, the degree of Type IV (2.3) was the highest among the four types.
7. ASSOCIATION OF LABOR INTENSITY, CAPITAL CONCENTRATION,
AND INTERMEDIATE INPUT CONCENTRATION
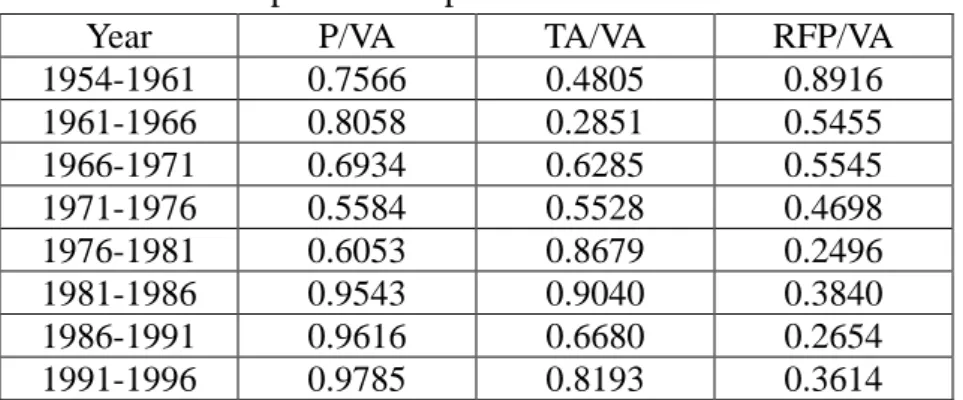
To investigate into association of labor intensity, capital concentration, and intermediate input concentration, ranking of the 22 categories can be used to calculate Spearman’s rho coefficient between two time points for each variable and between pairs of variables in each time. First, let’s look at the association between time points. Table 5.1 and Figure 5.1 provide a comparison of Spearman’s rho coefficients calculated for the three variables.
Table 5.1: A Comparison of Spearman's rho Coefficient
Year P/VA TA/VA RFP/VA
1954-1961 0.7566 0.4805 0.8916 1961-1966 0.8058 0.2851 0.5455 1966-1971 0.6934 0.6285 0.5545 1971-1976 0.5584 0.5528 0.4698 1976-1981 0.6053 0.8679 0.2496 1981-1986 0.9543 0.9040 0.3840 1986-1991 0.9616 0.6680 0.2654 1991-1996 0.9785 0.8193 0.3614
In general, from 1966 onwards the coefficient for intermediate inputs (RFP/VA) was usually below 0.5 and was the smallest among the three variables. This suggests that the pattern of utilizing intermediate inputs among the 22 manufacturing industries was not as monotonic as in the cases of labor intensity and capital concentration. The coefficient for labor intensity (P/VA) was the highest except for 1954. It declined from 0.81 in 1961-1966 to 0.56 in 1971-1976 and then increased to above 0.95 from 1981 to 1996; this suggests that the changing pattern of labor intensity was rather
monotonic. As for the coefficient for capital concentration (TA/VA), it fluctuated but was increasing and reached 0.9 in 1981-1986; it then declined and rose again to 0.82 in 1991-1996; this indicated that the changing pattern of capital concentration also tended to be quite monotonic.
Figure 5.1: A Comparison of Spearman’s rho
Figure 5.1: A Comparison of Spearman’s rho coefficient
In regard to the question of whether an industry was becoming more capital concentrated while its labor intensity was reducing, or utilizing more intermediate inputs while becoming more capital concentrated, a comparison of ranking between pairs of variables can be made. The results are shown in Table 5.2.
Table 5.2: Tendency towards Capital Concentration
Year TA/VA & P/VA TA/VA & RFP/VA RFP/VA & P/VA
1954 -0.35 0.53 -0.31 1961 0.14 0.29 -0.47 1966 -0.19 0.68 0.18 1971 -0.22 0.54 0.33 1976 -0.20 0.66 0.24 1981 -0.57 0.58 -0.19 1986 -0.59 0.26 0.20 1991 -0.13 0.57 -0.08 1996 -0.42 0.62 -0.23
Table 5.2 shows that in the case of comparing TA/VA and P/VA, the Spearman’s rho coefficient was negative for most of the years excepting 1961, but even this positive value (0.14) was rather small. This suggests that there was a tendency for manufacturing industries to become more capital concentrated while reducing labor intensity; this tendency appeared to be stronger in 1981-1986 when the coefficients were –0.57 and –0.59 respectively.
0.0 0.2 0.4 0.6 0.8 1.0 1.2 1954-1961 1961-1966 1966-1971 1971-1976 1976-1981 1981-1986 1986-1991 1991-1996 Year
Figure 5.1: A Comparison of Spearman's rho coefficient
On the contrary, a comparison of TA/VA and RFP/VA obtained a positive Spearman’s rho coefficient in each year. The coefficients fluctuated between 0.3 and 0.7, and this indicates that when manufacturing industries were becoming more capital concentrated, it also tended to consume more intermediate inputs.
In addition, a comparison between P/VA and RFP/VA was also made. The result show that there were 5 negative and 4 positive Spearman’s rho coefficients, and excepting 1961, the absolute value was mostly below 0.3. Thus it is rather difficult to say that there was a certain association between changing labor intensity and intermediate input.
With details of the 22 categories (see Appendix Tables 2.2, 3.2 and 4.2), it is notable that some industries tended to be more capital concentrated when labor intensity was reducing. These industries included food and beverage, textiles, non-metallic mineral products, basic metals, transport equipment (from 1971 on), paper, chemical matters, chemical products, and petroleum and coal products. When taking labor intensity, capital and intermediate input concentration together into consideration, the following industries are particularly notable.
For food and beverage manufacturing, its rank of labor intensity was mostly between the fourteenth and the nineteenth. It ranked among the top five with a high concentration of intermediate input except for 1961 and 1966. Its ranking in capital concentration was within the top five in 1961, 1981, 1986, and 1996. Its share of value added was the highest from 1954 to 1966, ranked the third in 1971 and 1976, the fifth in 1991 and the fourth in 1996 (see Appendix Table 1.6). Its value added per person was above the average from 1976 onwards (see Appendix Table 6). These figures suggest that food and beverage manufacturing was not particularly high labor-intensive, however, its consumption of intermediate input was proportionately large (i.e., the cost of agricultural products was not low) and it was gradually increasing in capital concentration after 1981.
For the textile industry, it ranked in labor intensity between the fifth and the sixteenth. It ranked the fourth in concentration of intermediate input in 1954, the fifth in 1966, the third in 1971, the fifth again in 1976, but fell to the eighteenth in 1981 and then rose to rank the sixth in 1996. Its ranking of capital concentration was the ninth in 1954, the second in 1961, the third in 1966 and 1971, the fifth in 1976, the eighth in 1981, the ninth in 1986, the sixth in 1991 and the fifth in 1996. Its share in value added ranked the third in 1954, the second from 1961 to 1971, the first in 1976, and again the second in 1981 and 1986, but fell to the fourth in 1991 and the tenth in 1996. Although its value added per person was always below average, in respect of being ranked always within the top five for its share in value added, the textile industry demonstrated that its utilization of labor, capital and intermediate inputs was
quite efficient at least until 1991.
For the basic metal industry, its rank in labor intensity fluctuated between the fifteenth and the twentieth, although in 1971 and 1976 it ranked the first. This industry mostly ranked the first and the second in regard to concentration of intermediate input. It also ranked the first or the second in respect of capital concentration except in 1961 and 1966. In other words, the basic metal industry was a capital-intensive industry that consumed a large amount of intermediate input. It is notable that in the 1970’s when this industry was strategically promoted by the government, it was not only highly capital concentrated but also highly labor-intensive. Its value added per person was above the average except in 1954 and 1971-1976; however, its share in value added was not particularly large until 1991 when it was ranked the fifth. In fact, according to the census, steel pipe and copper manufacturing both had a negative value added in 1971, and primary iron and steel industries had a negative value added as large as NT$ –3,126 million in 1976. This indicated that the development of the basic metal industry in Taiwan had been very expensive. This outcome can be anticipated, as Taiwan was very poor in mineral ore resources.
For the electrical and electronic machinery manufacturing, its rank in labor intensity fluctuated between the tenth and the nineteenth. This industry did not gain its importance in the ranking of concentration of intermediate input until 1986 when it was ranked the fourth and then rose to the second in 1991 before dropping again to the fourth in 1996. Its rank of capital concentration was usually between the fifteenth and the eighteenth before rising to the tenth in 1986 and to the eighth in 1996. However, from 1971 to 1996 its value added per person was above the average and its share in value added was ranked the first except in 1976 when it ranked the second. This suggests that electrical and electronic machinery manufacturing in Taiwan was very efficiently operated, its labor intensity was not high and its degree of capital concentration was around the average, but its degree of concentration of intermediate inputs was relatively high.
Among the eight categories of chemical industry, chemical matter manufacturing had the most stable ranking in labor intensity and capital concentration. This was an industry of low labor intensity (ranked around the twentieth) with high capital concentration (ranked from the first to the fourth). However, its concentration of intermediate input was not stable; except for ranking in the fourth in 1981 and the third in 1996, its position fluctuated between the eighth and the eighteenth. Its value added per person was always above the average but its share of value added was ranked the fifth only in 1971 and 1986, and thus, there is still room for this industry to
improve in respect to value added.17 The paper industry was also low labor-intensive (mostly ranked around the sixteenth and the seventeenth) and high capital concentration (ranked the first in 1954 and the third in 1961, the third again in 1991 and the fourth in 1996). However, its ranking in intermediate input concentration was rather stable, from the fourth to the seventh. On the contrary, leather and fur manufacturing was a high labor-intensive industry, its rank lay between the second and the fifth during 1966-1986 and in other years between the seventh and the ninth. Its degree of capital concentration was not high, usually ranked between the fifteenth and the twentieth. However, its ranking in concentration of intermediate input was quite high as it ranked the second in 1954, the first in 1966, the fourth in 1976, the third in 1986, and the second again in 1996. This was a labor-intensive industry with high concentration of intermediate input. In terms of value added per person, both the paper and leather industries were below the average.
Some industries sometimes ranked quite high in concentration of intermediate input, but these were exceptional rather than normal circumstances. For instance, petroleum and coal products manufacturing ranked usually near the bottom in respect to intermediate input concentration, and yet it ranked the third in 1976 and the first in 1981. This reflected fairly well the impact of the oil crisis and the response of this industry in Taiwan.
8. RATIONALITY OF WAGE RATE
It is usually contended that a labor-intensive industry loses its competitiveness at one place at the time when the wage rate is becoming higher than in another place. To look into the question of whether the wage rate of Taiwan’s manufacturing sector was too high, a comparison between wages per person (W/P), value added per person (VA/P) and total assets in operation per person (TA/P) can be done. Tables 6, 7, and 8 are the summary of these statistics and Figures 6, 7 and 8 illustrate the growth curves of W/P, VA/P and TA/P respectively. Details are listed in Appendix Tables 5, 6 and 7. Presented in terms of current prices, the statistics of W/P, VA/P and TA/P demonstrated a similar trend of exponential function. Since values of the coefficient of determination (R2) are all very high, 0.99 for W/P, 0.95 for VA/P, and 0.98 for TA/P, we may say that these statistics fit closely with exponential trend curves.
17
Studies on Taiwan’s chemical industry in general pointed out the direction of development towards higher value added products and the importance of pollution control and prevention in this industry. See Li Shu-wen and Ching Hu-shih, “General situation of Taiwan’s chemical industry in 1984,” (in Chinese), Kung-ch’eng (Engineering), Vol. 58, No. 6 (June 1985), pp. 50-59; Li Kuo-cheng, “Current situation and prospect of Taiwan’s chemical industry, ” (in Chinese), Kung-yeh chien-shun (Industry News in Brief), Vol. 25, No. 12 (December 1995), pp. 35-49.
Table 6: Wage per Person (W/P, NT$1000)
Year Total Type I Type II Type III Type IV
1954 3.4 2.9 3.8 4.9 2.5 1961 6.9 6.1 8.2 14.0 6.8 1966 12.6 11.7 13.2 15.0 12.0 1971 21.3 20.1 22.4 23.4 21.2 1976 51.2 48.3 53.2 55.3 51.8 1981 106.0 99.9 114.3 110.8 105.1 1986 171.4 163.5 173.1 186.8 164.0 1991 282.3 261.6 290.9 296.8 286.6 1996 422.0 395.6 414.6 459.7 429.8 Growth Rate 0.6217 0.6298 0.6051 0.5647 0.6436 R2 0.9927 0.9918 0.9909 0.9853 0.9899
Figure 6: Growth of Wage per Person
Figure 6.1: Type I: Wage paid per person y = 1.9896e0.6217x R² = 0.9927 0 100 200 300 400 500 600 1954 1961 1966 1971 1976 1981 1986 1991 1996 NT$1000 Year
Figure 6: Growth of Wage per Person
Total Type I Type II Type III Type IV Total
0 200 400 600 800 1000 1200 1954 1961 1966 1971 1976 1981 1986 1991 1996 NT$1000 Year
Figure 6.1: Type I: Wage paid per pers on
F&B To b Tex App
Figure 6.2: Type II: Wage paid per person
Figure 6.3: Type III: Wage paid per person
Figure 6.4: Type IV: Wage paid per person 0 200 400 600 800 1000 1200 1954 1961 1966 1971 1976 1981 1986 1991 1996 NT$1000 Year
Figure 6.2: Type II: W age paid per pers on
BM MP Mac Tr an 0 200 400 600 800 1000 1200 1954 1961 1966 1971 1976 1981 1986 1991 1996 NT$1000 Year
Figure 6.3: Type III: W age paid per pers on
L&F Pape r PEB ChM
ChP P&C Rub Pla s
0 200 400 600 800 1000 1200 1954 1961 1966 1971 1976 1981 1986 1991 1996 NT$1000 Year
Figure 6.4: Type IV: Wage paid per pers on
Table 7: Value Added per Person (VA/P, NT$ 1000)
Year Total Type I Type II Type III Type IV
1954 11.4 12.6 6.4 12.5 6.0 1961 43.3 44.3 35.1 50.1 35.5 1966 38.2 33.1 29.3 62.5 34.2 1971 34.4 27.1 28.5 59.1 43.9 1976 101.3 104.1 72.5 121.0 100.4 1981 244.0 242.0 243.7 265.0 218.3 1986 343.4 329.3 323.5 434.0 270.4 1991 604.2 577.2 577.1 740.4 530.4 1996 900.0 849.6 785.8 1,088.2 949.2 Growth Rate 0.5288 0.5221 0.5768 0.5219 0.5689 R2 0.9467 0.9254 0.9371 0.9637 0.9565
Figure 7: Growth of Value Added per Person
Figure 7: Growth of Value Added per Person
Table 8: Total Assets in Operation per Person (TA/P, NT$1000)
Year Total Type I Type II Type III Type IV
1954 27.8 27.8 15.9 44.4 11.8 1961 48.4 49.8 28.5 68.4 25.1 1966 148.3 139.9 96.7 226.2 118.9 1971 198.2 168.3 191.8 274.2 166.0 1976 551.8 496.0 606.9 774.7 315.2 1981 934.5 828.0 1,186.2 1,118.4 614.4 1986 1,086.6 940.3 1,249.1 1,354.6 827.9 1991 2,252.9 2,088.4 2,313.1 2,635.1 1,986.0 1996 4,000.5 3,813.7 3,404.9 4,967.9 4,178.3 Growth Rate 0.6155 0.6051 0.6932 0.5802 0.6966 R2 0.9819 0.9836 0.9609 0.9775 0.9765 y = 8.032e0.5288x R² = 0.9467 0 200 400 600 800 1000 1200 1954 1961 1966 1971 1976 1981 1986 1991 1996 Value (NT$1000) Year
Figure 7: Growth of Value Added per Person
Figure 8: Growth of Total Assets in Operation per Person
In terms of the entire manufacturing sector, the growth rate between intervals was 0.62 for W/P, 0.61 for TA/P, and 0.53 for VA/P. In terms of types, the growth rate varied. In the case of W/P (Table 6), the order is Type IV (0.6436), Type I (0.6298), Type II (0.6051) and Type III (0.5647). In the case of VA/P (Table 7), the order is Type II (0.5768), Type IV (0.5689), Type I (0.5221), and Type III (0.5219). In the case of TA/P (Table 8), the order is Type IV (0.6966), Type II (0.6932), Type I (0.6051), and Type III (0.5802). In other words, growth rates of Type III always ranked at the bottom among the four types, while those of Type IV were almost all on the top. In terms of money payment, the amount of Type III was the highest among the four types for the three variables in most of the time. Take W/P for an example, Figures 6.1 to 6.4 reveal that the curves of individual categories lay rather closely among each other under each type except for two exceptions, tobacco of Type I and petroleum and coal of Type III.
To investigate further into the association between W/P, VA/P and TA/P, the data of 22 categories are applied to the least square regression and results are listed in Table 9. A comparison of coefficient b (the slop) is depicted in Figure 9.
These results show that the value of slop is positive in every year and thus the correlation between TA/P and VA/P, TA/P and W/P, as well as VA/P and W/P are positive. As can be seen clearly from Figure 9, from 1966 to 1996, the value of slop between VA/P and W/P was always higher than that between TA/P and W/P. From
1961 to 1971, the value of slop between TA/P and VA/P was declining, while, on the contrary, that between VA/P and W/P was increasing. The same phenomenon appeared again from 1991 to 1996. This finding suggests that taking value added as a base of reference, the level of wage rate for Taiwan’s manufacturing sector tended to be relatively high and it might have risen sometimes beyond reasonable proportions. The relatively high wage rate no doubt was one important factor that helped in pushing Taiwan’s manufacturing to invest outside the Island in recent years.
Table 9: Correlation between Total Assets, Value added and Wage per Person
Year TA/P and VA/P TA/P and W/P VA/P and W/P
Intersect Slop R2 Intersect Slop R2 Intersect Slop R2 1954 -4.016 0.549 0.599 2.513 0.037 0.629 3.313 0.029 0.194 1961 24.779 0.639 0.137 4.691 0.054 0.521 5.881 0.025 0.339 1966 1.347 0.258 0.734 8.775 0.030 0.843 9.905 0.085 0.613 1971 4.942 0.152 0.738 17.513 0.022 0.900 18.899 0.096 0.532 1976 49.463 0.152 0.325 45.548 0.012 0.854 49.383 0.034 0.486 1981 64.135 0.236 0.448 93.590 0.015 0.611 95.586 0.047 0.781 1986 11.703 0.339 0.728 149.440 0.022 0.827 156.690 0.050 0.701 1991 -354.680 0.445 0.834 183.510 0.043 0.909 227.430 0.084 0.851 1996 -107.070 0.283 0.721 268.670 0.040 0.851 301.650 0.126 0.954
Figure 9: A Comparison of Coefficients
CONCLUDING REMARKS
1953 to 1978. The year 1953 marked the time when total value of industrial production exceeded the highest value ever reached during colonial period, and 1978 marked a turning point of transformation from light to heavy industry predominance. Utilizing the census data, this paper further illustrates this development with the following points.
By grouping manufacturing into four types and comparing shares of enterprise unit, persons engaged, wage paid, total assets in operation, total value of production and value added, it is found that Type I manufacturing predominated in 1954. However, the shares were almost equally distributed among the four types in 1996, especially in respect to total assets in operation and value added.
The improvement in efficient labor intensity was quite remarkable as the persons required in producing one million NT$ of value added was reduced on average from 88 to 1 during 1954-1996. It is notable that from 1981 onwards, the difference of labor intensity among the four types of manufacturing gradually
disappeared, although ranking among 22 categories remained rather monotonic. A large increase was found in the degree of capital concentration during
1971-1976, and this contributed to the transformation of Taiwan’s industrial structure. Moreover, there was also a tendency for manufacturing to become more capital concentrated while reducing labor intensity especially from 1981 onwards.
The degree of intermediate input concentration was less than that of capital and its pattern of ranking was also less monotonic. There was a tendency for manufacturing to utilize more intermediate input when capital concentration was increasing; however, there was not a certain association between reducing labor intensity and increasing intermediate inputs.
The growth rate of wage paid per person was higher than that of total assets per person and value added per person. An investigation into the correlation between pairs of these variables reveals that the wage rate was relatively high in Taiwan if value added per person was taken as a base of reference, and it might have risen sometimes beyond reasonable proportions. This relatively high wage rate helped to push Taiwan’s manufacturing to upgrade technical levels and to find investment for labor-intensive industries outside the Island.
References
DBGAS (Directorate-General of Budget, Accounting and Statistics),
The 1981 Statistical Abstract of the Republic of China, Taipei: Directorate-General
of Budget, Accounting and Statistics, Executive Yuan, 1981.
The 1991 Statistical Yearbook of the Republic of China, Taipei: Directorate-General
of Budget, Accounting and Statistics, Executive Yuan, 1991.
of Budget, Accounting and Statistics, Executive Yuan, 1999.
The 1954 Census: General Report on Industrial and Commerce Census of Taiwan,
1954. Published by the Executive Group of ICCT, May 1956.
The 1961 Census: General Report 1961, Industry and Commerce Census of Taiwan. Published by the Executive Group of ICCT, December 1962.
The 1966 Census: General Report on the Third Industrial and Commercial Census of
Taiwan. Published by the Commission of ICCT, June 1968.
The 1971 Census: The 1971 Industrial and Commercial Censuses of Taiwan and
Fukien Area. Published by The Committee on Industrial and Commercial Censuses
of Taiwan and Fukien Area, Executive Yuan, June 1973.
The 1976 Census: The Report of 1976 Industrial and Commercial Censuses of
Taiwan-Fukien District of the Republic of China. Published by the Committee on
Industrial and Commercial Censuses of Taiwan-Fukien district of the Republic of China, Executive Yuan, December 1978.
The 1981 Census: The Report on 1981 Industrial and Commercial Census,
Taiwan-Fukien Area, The Republic of China. Published by Directorate-General of
Budget, Accounting and Statistics, Executive Yuan, June 1983.
The 1986 Census: The Report on 1986 Industrial and Commercial Census,
Taiwan-Fukien Area, The Republic of China. Published by Directorate-General of
Budget, Accounting and Statistics, Executive Yuan, October 1988.
The 1991 Census: The Report on 1991 Industrial and Commercial Census,
Taiwan-Fukien Area, The Republic of China. Published by Directorate-General of
Budget, Accounting and Statistics, Executive Yuan, December 1993.
The 1996 Census: The Report on 1996 Industry, Commerce and Service Census,
Taiwan-Fukien Area, The Republic of China. Published by Directorate-General of
Budget, Accounting and Statistics, Executive Yuan, December 1998.
Chu, Wan-wen 瞿宛文, “Tzu-yu-hua hou te Taiwan ch’an-yeh cheng-ts’e 自由化後的 臺灣產業政策 (Industrial Policy in Taiwan’s Post-Liberalization Economy),” paper delivered at Conference on the Development of Capitalism in Taiwan, December 27-28, 2001, Taipei: Sun Yat-sen Institute for Social Sciences and Philosophy, Academia Sinica.
Hsiao Chih-t’ung 蕭志同, “Taiwan ti-ch’ü ch’u-k’ou huo-pin lao-li-mi-chi-tu chieh-kou fen-hsi 臺灣地區出口貨品勞力密集度結構分析 (An analysis of the structure of labor intensity among export commodities from Taiwan),” Monthly
Journal of Taipei Bank, Vol. 26, No. 11 (November 1996), pp. 63-71.
Hsieh Kuo-hsing 謝國興, “ Ch’an-yeh t’iao-cheng yu ch’I-yeh ching-ying—kuang-fu yi-lai te Taiwan fang-chih-yeh 產業調整與企業經營—光復以來的臺灣紡織業
(Industrial adjustment and enterprise management: Taiwan’s textile industry since the restoration,” in Topics on History of Contemporary China edited by The
Historical Material Center of the Republic of China, Vol. 17 (1995), pp. 430-462. Hua Kuo-cheng 華國楨, “Fa-chan-chung te Taiwan hua-hsüeh kung-yeh 發展中的
臺灣化學工業 (Taiwan’s chemical industry in development),” Chung-mei chi-shu 中美技術 (Sino-American Technology), Vol. 15, No. 4 (December 1970), pp. 10-13.
Li Kuo-cheng 李國貞, “O-kuo hua-hsüeh kung-yeh hsien-k’uang yu chan-wang 我國 化學工業現況與展望 (Current situation and prospect of Taiwan’s chemical
industry, ” Kung-yeh chien-shun 工業簡訊(Industry News in Brief), Vol. 25, No. 12 (December 1995), pp. 35-49.
Li Kwoh-ting 李國鼎, “Ju-ho chin-yi-pu fa-chan kuo-nei te hua-hsüeh kung-yeh 如何 進一步發展國內的化學工業 (How to further develop domestic chemical
industry,” Shih-yu t’ung-hsun 石油通訊 (Petroleum Newsletter), No. 316 (December 1977), pp. 2-4.
Li-min Hsueh, Chen-kuo Hsu, and Dwight H. Perkins, Industrialization and the State:
The Changing role of the Taiwan Government in the Economy, 1945-1998
(Cambridge, Massachusetts: Harvard Institute for International Development, distributed by Harvard University Press, 2001).
Li Shu-wen 李樹文 and Ching Hu-shih 景虎士, “Ch’I-shih-san-nien o-kuo hua-hsüeh kung-yeh fa-chan kai-k’uang 七十三年我國化學工業發展概況 (General situation of Taiwan’s chemical industry in 1984,” Kung-ch’eng 工程 (Engineering), Vol. 58, No. 6 (June 1985), pp. 50-59.
Liu Fang-jung 劉芳瑢, “Chiang-li t’oi-tzu yu fang-chih-yeh te fa-chan 獎勵投資與 紡織業的發展 (Investment promotion and the development of textile industry),”
Ts’ai-shui yen-chiu 財稅研究 (Finance Studies), Vol. 14, No. 4 (July 1982), pp.
35-46.
Liu, Ts’ui-jung, “Regional Variation of Industrial Development in Taiwan,” in Ts’ui-jung Liu and Shou-chien Shih (eds.), Economic History, Urban Culture and
Material Culture: Papers from the third International Conference on Sinology 經
濟史、都市文化與物質文化:第三屆國際學會議論文集, Taipei: Institute of History and Philology, Academia Sinica, June, 2002, pp. 225-264.
Yeh Shu-cheng 葉淑貞, “Ts’ung li-shih chiao-tu po-hsi Taiwan chan-hou kung-yeh fan-chan te t’e-cheng 從歷史角度剖析臺灣戰後工業發展的特徵 (An analysis on the features of Taiwan’s industrial development from historical perspective),” in
Topics on History of Contemporary China edited by The Historical Material Center
Appendix Table 1.1: Share of Enterprise Units in Manufacturing Year Category 1954 1961 1966 1971 1976 1981 1986 1991 1996 Average Rate of Change Total (N) 39,748 51,567 27,709 42,636 69,517 91,499 113,639 140,572 154,675 Type I 71.27 64.72 65.79 57.08 43.97 37.41 32.84 28.05 23.64 -5.96 Food & Beverage 30.69 28.75 45.16 30.33 15.75 9.50 7.23 5.27 4.08 -3.33 Tobacco 0.00 0.00 0.00 0.00 0.00 0.00 0.00 0.00 0.00 0.00 Textile 5.06 4.12 4.26 5.03 6.76 6.58 6.84 5.59 4.07 -0.12 Apparel 12.65 10.82 1.41 2.52 2.95 3.19 2.90 2.62 3.40 -1.16 Wood & Bamboo 7.42 5.52 5.14 6.72 7.79 6.98 5.38 3.71 2.94 -0.56 Furniture & Fixtures 5.13 6.89 0.95 2.16 1.85 2.48 1.80 2.84 2.35 -0.35 Non-metallic mineral 4.87 4.40 7.24 5.99 5.05 4.06 3.52 3.18 2.90 -0.25 Miscellaneous 5.44 4.21 1.63 4.33 3.81 4.61 5.16 4.83 3.90 -0.19 Type II 19.02 21.65 18.01 21.33 31.68 36.12 36.84 39.91 44.39 3.17 Basic metals 0.17 0.17 0.56 1.06 1.68 2.19 2.52 3.44 3.66 0.44 Metal Products 7.57 6.02 6.19 7.62 17.56 21.24 22.03 21.82 24.94 2.17 Machinery 2.63 3.35 7.69 9.93 8.85 9.25 8.68 10.75 11.93 1.16 Transport equipment 8.66 12.10 3.58 2.73 3.59 3.44 3.61 3.89 3.86 -0.60 Type III 6.05 9.10 13.80 17.76 19.84 20.51 22.49 22.52 21.77 1.76 Leather & Fur 0.51 0.58 0.49 0.74 0.94 1.15 1.00 0.96 0.76 0.03 Paper 0.54 1.49 1.23 2.17 2.23 2.48 2.63 2.75 2.59 0.26 Printing etc. 1.86 1.99 3.37 3.53 4.03 4.55 5.44 5.49 5.94 0.51 Chemical matters 0.11 0.09 0.47 0.72 0.73 0.68 0.87 0.82 0.74 0.08 Chemicals products 1.57 2.49 4.40 3.74 2.46 2.00 1.86 1.59 1.47 -0.21 Petroleum & Coal 0.46 0.79 0.43 0.29 0.12 0.08 0.05 0.10 0.14 -0.04 Rubber products 0.80 1.01 1.09 1.21 1.41 1.36 1.41 1.44 1.31 0.06 Plastic products 0.19 0.65 2.31 5.37 7.94 8.22 9.24 9.38 8.82 1.08 Type IV 3.66 4.54 2.40 3.82 4.51 5.96 7.83 9.65 10.32 0.83 Electrical machinery 1.83 2.95 2.08 3.41 3.91 5.27 6.66 8.35 9.11 0.91 Precision machinery 1.82 1.59 0.32 0.41 0.60 0.69 1.17 1.30 1.21 -0.08
Appendix Table 1.2: Shares of Persons Engaged in Manufacturing Year Category 1954 1961 1966 1971 1976 1981 1986 1991 1996 Average Rate of Change Total (N) 309,887 445,667 589,660 1,201,539 1,907,581 2,196,691 2,753,944 2,665,435 2,524,104 Type I 66.53 63.75 58.87 53.62 46.09 40.92 36.11 31.41 26.54 -5.00 Food & Beverage 21.91 21.85 21.42 11.26 7.44 5.94 5.20 5.59 5.51 -2.05 Tobacco 1.58 1.21 1.94 0.86 0.64 0.62 0.52 0.55 0.50 -0.13 Textile 16.88 15.84 17.43 19.02 17.79 13.79 10.58 7.89 5.97 -1.36 Apparel 5.04 5.07 2.28 5.98 5.34 5.92 5.40 3.88 4.12 -0.12 Wood & Bamboo 5.75 5.91 5.43 6.06 4.94 3.68 3.08 2.05 1.37 -0.55 Furniture & Fixtures 2.01 2.63 0.61 0.77 0.96 1.51 1.65 2.40 2.09 0.01 Non-metallic mineral 9.65 8.82 7.83 5.26 4.50 4.62 3.93 4.06 3.82 -0.73 Miscellaneous 3.71 2.42 1.92 4.41 4.48 4.86 5.74 4.99 3.17 -0.07 Type II 16.81 16.97 16.16 14.28 18.60 20.02 20.75 26.38 30.25 1.68 Basic metals 2.06 2.45 2.94 2.51 2.73 3.15 2.90 4.26 4.61 0.32 Metal Products 4.62 4.53 3.99 3.78 6.78 7.60 8.97 9.81 11.70 0.88 Machinery 4.21 3.71 5.23 5.07 4.62 4.53 4.27 6.59 7.77 0.44 Transport equipment 5.92 6.29 4.00 2.92 4.47 4.74 4.61 5.72 6.18 0.03 Type III 14.55 16.03 19.24 21.41 21.55 24.17 24.82 23.45 21.23 0.35 Leather & Fur 0.47 0.33 0.20 0.65 1.69 2.40 2.60 1.98 1.04 0.07 Paper 2.11 3.04 2.96 2.82 2.26 2.33 2.25 2.63 2.51 0.05 Printing etc. 3.39 2.94 2.20 1.49 1.42 1.52 1.81 2.22 2.30 -0.14 Chemical matters 2.11 2.11 1.84 2.97 2.17 2.21 2.43 2.81 3.03 0.12 Chemicals products 3.13 3.40 5.14 3.44 2.29 2.04 1.93 2.24 2.34 -0.59 Petroleum & Coal 1.10 1.24 1.89 1.32 0.99 0.88 0.88 1.11 0.98 -0.02 Rubber products 1.74 1.51 1.72 1.78 1.96 2.21 1.67 1.89 1.68 -0.01 Plastic products 0.50 1.47 3.29 6.94 8.79 9.88 11.26 8.56 7.34 0.86 Type IV 2.11 3.25 5.73 11.00 13.76 15.61 18.32 19.38 22.53 2.55 Electrical machinery 1.67 2.93 5.52 10.61 12.73 14.43 16.90 17.73 21.12 2.43 Precision machinery 0.44 0.32 0.22 0.39 1.03 1.18 1.42 1.65 1.41 0.12
Appendix Table 1.3: Share of Wage Paid in Manufacturing Year Category 1954 1961 1966 1971 1976 1981 1986 1991 1996 Average Rate of Change Total Value (NT$ million) 1,039 3,079 7,409 25,628 97,697 232,887 471,923 752,486 1,065,272 Type I 58.10 56.14 54.59 50.60 43.50 38.55 34.46 29.11 24.88 -4.15 Food & Beverage 18.22 18.35 19.77 11.72 8.17 5.66 5.36 6.12 6.21 -1.49 Tobacco 2.66 2.27 3.55 1.50 1.03 1.28 0.90 1.23 1.19 -0.18 Textile 17.45 14.07 14.39 17.09 16.83 13.98 11.11 7.60 5.22 -1.53 Apparel 2.92 2.74 1.62 5.09 4.28 4.77 4.43 3.02 3.07 0.02 Wood & Bamboo 5.20 5.57 5.91 5.92 4.38 3.29 2.44 1.55 0.98 -0.53 Furniture & Fixtures 1.25 1.34 0.57 0.68 0.84 1.26 1.50 1.98 1.67 0.05 Non-metallic mineral 7.68 9.84 7.49 5.24 4.54 4.59 3.65 3.91 3.87 -0.48 Miscellaneous 2.73 1.96 1.29 3.36 3.42 3.72 5.07 3.69 2.65 -0.01 Type II 18.84 20.08 16.96 15.02 19.34 21.57 20.95 27.18 29.72 1.36 Basic metals 3.05 4.62 4.28 3.06 3.45 4.04 3.98 5.67 5.35 0.29 Metal Products 3.46 3.92 3.17 3.52 6.01 6.79 7.49 8.28 10.15 0.84 Machinery 5.14 4.28 5.03 5.10 5.00 4.85 4.06 6.26 7.29 0.27 Transport equipment 7.20 7.24 4.48 3.33 4.87 5.89 5.43 6.96 6.93 -0.03 Type III 21.46 20.60 22.98 23.44 23.25 24.41 27.06 24.66 23.12 0.21 Leather & Fur 0.51 0.25 0.17 0.50 1.45 1.99 2.55 1.61 0.85 0.04 Paper 3.26 3.71 2.98 3.21 2.49 2.63 2.51 2.69 2.49 -0.10 Printing etc. 5.20 3.27 2.11 1.58 1.39 1.32 1.54 1.76 2.00 -0.40 Chemical matters 4.05 4.34 2.96 5.02 3.47 3.47 4.03 4.56 4.59 0.07 Chemical products 4.08 4.15 6.98 2.91 2.60 2.17 2.29 2.61 2.48 -0.20 Petroleum & Coal 2.52 1.74 3.61 2.23 1.87 1.33 1.59 2.05 2.53 0.00 Rubber products 1.39 1.53 1.41 1.97 1.98 2.33 1.72 1.70 1.42 0.00 Plastic products 0.44 1.60 2.76 6.03 8.01 9.17 10.82 7.67 6.77 0.79 Type IV 1.59 3.18 5.47 10.94 13.90 15.47 17.53 19.68 22.94 2.67 Electrical machinery 1.48 3.08 5.28 10.54 12.95 14.41 16.32 18.26 21.77 2.54 Precision machinery 0.11 0.11 0.19 0.39 0.95 1.06 1.20 1.42 1.17 0.13