National Chiao Tung University
Department of Applied Chemistry
PhD Thesis
Structure and Dynamics of Transient Species
Produced in Condensed-Phase Photophysical and
Photochemical Reactions as Elucidated by
Nanosecond Time-Resolved Near/Mid-IR
Spectroscopy
Student: Sudhakar Narra
Advisor: Dr. Shinsuke Shigeto
Structure and Dynamics of Transient Species
Produced in Condensed-Phase Photophysical and
Photochemical Reactions as Elucidated by
Nanosecond Time-Resolved Near/Mid-IR
Spectroscopy
Student: Sudhakar Narra
Advisor: Dr. Shinsuke Shigeto
A Thesis
Submitted to Ph. D. Program, Department of Applied Chemistry College of Science
National Chiao Tung University in Partial Fulfillment of the Requirements
for the Degree of Doctor of philosophy in
Applied Chemistry
Structure and Dynamics of Transient Species
Produced in Condensed-Phase Photophysical and
Photochemical Reactions as Elucidated by
Nanosecond Time-Resolved Near/Mid-IR
Spectroscopy
Student: Sudhakar Narra
Advisor: Dr. Shinsuke Shigeto
Ph. D. Program, Department of Applied Chemistry
National Chiao Tung University
Abstract
In this Thesis, the author presents unprecedentedly detailed studies on the structure and dynamics of ionic and neutral transient species that are of crucial importance in molecular photovoltaic devices, using nanosecond time-resolved near/mid-IR spectroscopy with the help of density functional theory (DFT) calculations and chemometrics techniques. The author has investigated (1) the back electron transfer (BET) dynamics in photoinduced intermolecular electron transfer reaction between pyrene (Py) and 1,4-dicyanobenzene (DCB) in acetonitrile and (2) the structure of the lowest excited triplet (T1) state of p-nitroaniline (PNA) in acetonitrile-d3. In the first work, the transient near/mid-IR spectra of Py radical dimer cation and DCB radical anion are observed in the nano- to microsecond (ns–µs) time regime after photoexcitation of Py. Global fitting analysis of the time-resolved IR data reveals a dual role of acetonitrile as solvent and “charge mediator” of the charge recombination between Py radical dimer cation and DCB radical anion in the BET reaction. This finding may have implications for dye-sensitized solar cells because acetonitrile is a commonly used solvent for redox couples in these types of devices. In the second work, the transient mid-IR spectra of
PNA in the T1 state generated after photoexcitation of PNA and subsequent intersystem crossing are examined to characterize the structure of T1 PNA. Comparison of the experimental IR spectra with DFT calculated results on explicitly solvated PNA shows that T1 PNA has a partial quinoid structure, which sharply contrasts with the well-known zwitterionic charge-transfer structure of the lowest excited singlet state of PNA. The studies presented in this Thesis not only illustrate the applicability of the time-resolved near/mid-IR method to a wide variety of important photophysical and photochemical processes in the condensed phase, but they also provide otherwise hardly obtainable insights into the structure and dynamics of transient species (radicals and excited-state molecules) involved in charger transfer processes.
Acknowledgements
I would like to express my sincere gratitude to my supervisor Prof. Shinsuke Shigeto for accepting me as his doctoral student, mentoring me and making this thesis possible. I am thankful for his counsel and critical insights that has led me to advance both professionally and personally during my doctoral studies at ultimate spectroscopy and imaging laboratory (USIL). I am equally thankful to Prof. Hiro-o Hamaguchi for spending his valuable time to discuss my research results. He served as an inspiration to me during this study and I enjoyed both scientific and non-scientific discussions with him during teatime. I will always be grateful to Prof. Satyen Saha for helping me to join at USIL as a graduate student, encouraging me during his visits to USIL, taking good care of me and offering his insights.
I am deeply indebted to my collaborators Prof. Henryk Witek, Dr. Yoshifumi Nishimura and Mr. Shu Wei-Chang for their help with the theoretical calculations. Their calculation results helped me to assign the vibrational bands of the transients and explain the bonding structure of p-Nitroaniline in a detailed manner.
My heartfelt thanks goes to my senior Dr. Sohshi Yabumoto for teaching me how to perform experiments, align nanosecond time-resolved IR spectrometer and spending an adequate amount of time with me to discuss about my experiments and give his critical inputs to improve them to a great deal. I am fortunate to have a senior like him.
I am thankful to Dr. Rintaro Shimada and Dr. Hajime Okajima for showing an immense interest in my research and discussing with me, debating with me at times and giving their valuable suggestions. Textbook reading sessions with Dr. Shimada were always stimulating and I could broaden my understanding on various fundamental concepts of optics and spectroscopy. Low-frequency Raman experiments with Dr. Okajima were always enjoyable.
I thank my friend Mr. Murali Krishna Pola for assisting me with the synthesis of p-Nitroanline isotopomers and recording 1H-NMR spectra for those synthesized compounds.
Special thanks to my friend Mrs. Zahra Hosseini for showing interest in my work on BET reaction mechanisms and expressing her inputs on electron transfer phenomenon in photovoltaics.
It is always good to have your close friend as a colleague. I am blessed to have one in the form of Dr. Hemanth Nag Noothalapati Venkata. I am thankful to him in every possible way for being a good support system during this study.
I would also like to thank Dr. Chuang-Keng Huang, Dr. Vitaly Korepanov and Dr. Ashok Z. Samuel for their encouragement.
I am thankful to all the present and past members of USIL for their support throughout my doctoral studies whenever needed.
I thank my close friends and parents for the care, love and emotional support they have extended during my study without which the present thesis is not possible.
Finally, I would like to thank “Scholarship Program of Taiwan” aka. Taiwan Scholarship and Prof. Shigeto for their financial assistance.
Table of Contents
Abstract ... i Acknowledgements ... iii Table of Contents ... v List of Figures ... vi List of Tables ... ix List of Schemes ... ix Chapter I Introduction ... 1Chapter II Nanosecond Time-resolved Near/Mid-IR spectrometer and Data Analysis Techniques ... 5
II-1 Introduction ... 6
II-2 Nanosecond Time-resolved Dispersive IR Spectrometer ... 6
II-2.1 TRIR Setup ... 7
II-2.2 Sample Circulation System ... 10
II-3 Singular Value Decomposition Analysis ... 11
II-3.1 Mathematical Definition ... 11
II-4 Global Fitting Analysis ... 12
Chapter III BET Mechanism of a Bimolecular PET Reaction between Py and DCB ... 15
III-1 Introduction ... 16
III-2 Materials and Methods ... 18
III-2.1 Materials ... 18
III-2.2 Nanosecond Time-resolved Near/Mid-IR Spectroscopy ... 18
III-2.3 Computational Details ... 19
III-3 Results and Discussion ... 19
III-3.1 Nanosecond TRNIR/MIR Spectra of Py and DCB in ACN Solution Measured under Ar Bubbling. ... 19
III-3.2 Vibrational Assignments ... 20
III-3.3 Molecular Oxygen Quenching Experiment ... 22
III-3.5 Concentration Dependence Studies of the BET Reaction between Py and DCB
in ACN Solution ... 27
III-3.6 TRIR Spectra of Py and DCB in Benzene Solution ... 28
III-4 Summary ... 29
Chapter IV Structural Elucidation on the T1 State of PNA in CD3CN Solution ... 30
IV-1 Introduction ... 31
IV-2 Materials and Methods ... 32
IV-2.1 Sample Preparation Methods ... 32
IV-2.2 Nanosecond Time-Resolved Infrared Spectroscopy ... 33
IV-2.3 Computational Details ... 34
IV-3 Results and Discussion ... 34
IV-3.1 Nanosecond TRIR Spectra of PNA in CD3CN under Ar Environment ... 34
IV-3.2 SVD analysis of the TRIR Spectra of PNA in CD3CN ... 36
IV-3.3 TRIR Spectra of PNA in CD3CN under O2 Environment ... 37
IV-3.4 Experimental IR Spectra of the T1 State of PNA and Its Isotopomers ... 39
IV-3.5 Calculated IR spectra of the T1 State of PNA and Its Isotopomers ... 42
IV-4 Structural of T1 PNA ... 46
IV-5 Summary ... 48
Chapter V Conclusions and Future Prospects ... 49
References ... 51
List of Figures Figure II–1. Optical layout of the nanosecond TRIR spectrometer. ... 9
Figure II–2. Schematic of the cell holder. ... 10
Figure II–3. Schematic of the sample circulation system. ... 11
Figure II–4. Simulated time-resolved spectra (a), extracted concentration profiles (b), spectral profiles (c) and residuals (d) obtained after performing global curve fitting analysis over the time-resolved spectral data matrix shown in (a). ... 14 Figure III–1. UV/Vis spectra of Py (red solid curve) and DCB (black solid curve) in ACN solution. Also shown is the UV/Vis spectrum of the ACN solution of both Py and DCB (grey dashed curve). In all solutions, the concentrations of Py and DCB were 0.50 and 5.0 mM, respectively. The molar extinction coefficient of Py at the excitation wavelength (355 nm) is
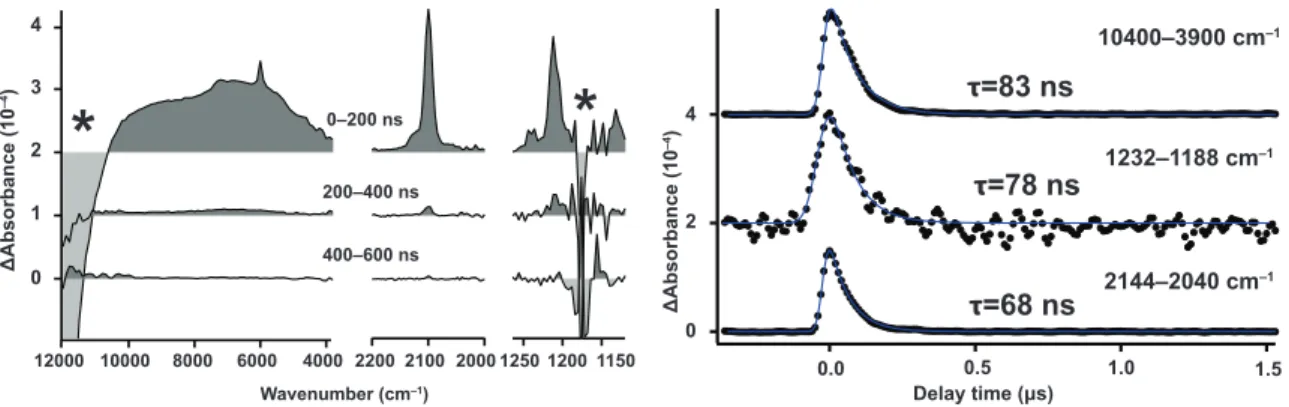
Figure III–2. Left: Time-resolved IR spectra in the regions 3800–12000 cm−1 (a), 2000–2200 cm−1 (b), and 1120–1260 cm−1 (c), of Py and DCB dissolved in ACN (0.50 and 5.0 mM, respectively) excited at 355 nm with Ar bubbling. The spectra in (a) are masked at around 4400 cm−1 due to an overtone band of the solvent. Each time-resolved spectrum is offset by 4 × 10⁻⁵ for clarity of display. Right: Time profiles at 11000 (d), 6800 (e), 2100 (f), 1216 (g), and 1136 (h) cm−1. The smooth black curves are the result of the kinetic analysis based on the reaction mechanism shown in Scheme III–1. ... 20 Figure III–3. (a) FTIR spectrum of Py (30 mM) in CD3CN. (b) DFT/B3LYP calculated IR spectrum of the gas phase Py molecule (plotted using a Gaussian band envelop with a FWHM of 10 cm–1). (c) Transient IR spectrum at 0–5 µs, same as the top trace of Figure III-1c. (d) DFT/B3LYP calculated IR spectrum of gas phase Py2•+. ... 21 Figure III–4. Time-resolved near- and mid-IR spectra of Py (0.50 mM) and DCB (5.0 mM) dissolved in ACN, measured at 0–5 µs with Ar (top) and O2 (bottom) bubbling. The spectrum taken with Ar bubbling is offset by 4 × 10⁻⁵ for clarity of display. ... 22 Figure III–5. Two-dimensional (2D) plots of the observed time-resolved spectra (a), the fitted result (b), and the residue (c). Each of the three 2D plots is represented in a rainbow pseudo color scale: the highest ΔA value appears red and the lowest appears purple. Note that the maximum ΔA value is 5 × 10⁻⁵ in (a) and (b) and 5 × 10⁻⁶ in (c). ... 26 Figure III–6 Left: Time-resolved IR spectra in the regions 3800–12000 cm−1 (a), 2000–2200 cm−1 (b), and 1120–1260 cm−1 (c), of Py and DCB dissolved in ACN (5.0 and 5.0 mM, respectively) excited at 355 nm with Ar bubbling. Each time-resolved spectrum is offset by 2 × 10⁻⁴ for clarity of display. Right: Time profiles at 11000 (d), 6800 (e), 2100 (f), 1216 (g), and 1136 (h) cm−1. The smooth black curves are the result of the kinetic analysis based on the reaction mechanism shown in Scheme III–1. ... 27 Figure III–7. Left: Time-resolved near- and mid-IR spectra of Py (5.0 mM) and DCB (50 mM) dissolved in benzene, excited at 355 nm with argon bubbling. Each spectrum is offset by 1 × 10⁻⁴ for clarity of display. Asterisks indicate an interference from a solvent band in the mid-IR region and a bleach due to the stimulated emission of Py in the near-IR region. Right: Averaged time profiles of the transient bands between 10400–3900, 1232–1188 and 2144– 2040 cm−1 (dots). The smooth curves are fits to an exponential function convolved with a Gaussian instrumental response function. ... 29 Figure IV–1. Representative resonance structures of PNA and their hybrids: neutral form (1), zwitterionic form (2), and partial quinoid form (3). ... 31
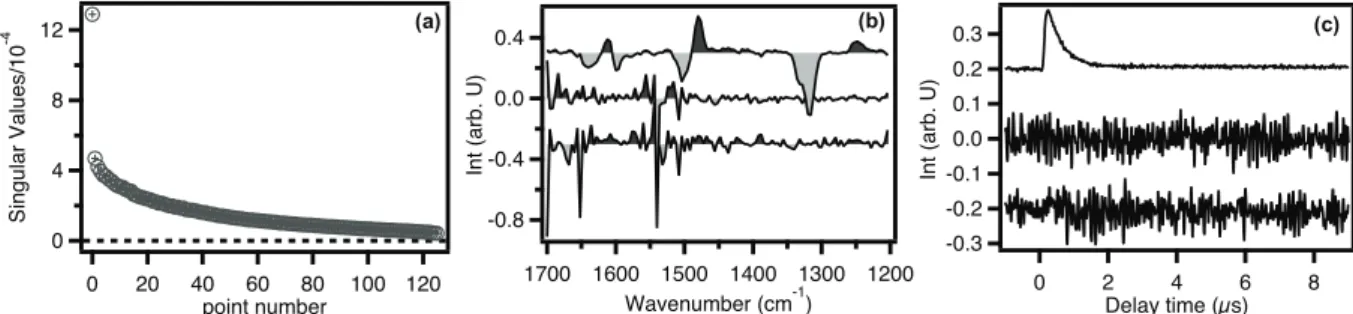
Figure IV–2. UV-Vis Spectrum of PNA (500 µM) in CD3CN. Brown line represents the laser excitation wavelength (355 nm) chosen for pumping PNA to the S1 state. ... 33 Figure IV–3. Ground-state (S0) spectrum (a) and time-resolved IR difference spectra (b) of PNA in CD3CN (0.25 mM), excited at 355 nm with Ar bubbling. Each time-resolved spectrum is offset by 5 × 10⁻⁵ for clarity. ... 35 Figure IV–4. (a) Plot of singular values obtained from the SVD of the TRIR data matrix. (b,c) Spectral (b) and temporal (c) components corresponding to the largest three singular values. Each spectral and temporal component is offset by 0.3 and 0.2 respectively, for clarity. ... 36 Figure IV–5. Results of a SVD analysis of the time-resolved IR difference spectra of PNA in CD3CN with Ar bubbling. (a) Decomposed spectral component. (b) Decomposed temporal component (red line) and the best fit (black line) to an exponential function convolved with a Gaussian IRF. The exponential time constant is determined to be τ= 430 ns. ... 37 Figure IV–6. (a) Time-resolved IR difference spectra of PNA in CD3CN with O2 bubbling: 0– 200 ns and 200–400 ns after photoexcitation. (b) Kinetic profiles of the transient band at 1248 cm−1 with Ar bubbling (red circle) and with O
2 bubbling (blue triangle). The time profiles have been normalized to the same maximum height. Solid lines are the best fits to an exponential convolved with a Gaussian IRF. ... 38 Figure IV–7. Upper panels: experimental IR spectra of PNA (red line) and its isotopomers, PNA-15NH2 (blue) and PNA-15NO2 (green). (a–c) Ground-state (S0) spectra recorded with an FT-IR spectrometer. (d–f) Lowest excited triplet-state (T1) spectra obtained by compensating the depletion of the ground-state absorption. Lower panels: calculated IR spectra of PNA (red line), PNA-15NH2 (blue), and PNA-15NO2 (green), using the PNA+2ACN model with (solid line) and without (dotted line) elongation of the C–NH2 bond by 0.012 Å. (g–i) The ground state. (j–l) The T1 state. See text for details. ... 40 Figure IV–8. Comparison of experimental and theoretical DFT/B3LYP IR spectra of PNA in the ground state. (a) FT-IR spectrum of PNA in CD3CN (0.25 mM), (b) a gas-phase molecular model, (c) the PCM model, (d) an explicitly solvated model with two CD3CN molecules attached to the NH2 group (the PNA+2ACN model), (e) the PNA+2ACN model with elongation of the C–NH2 bond by 0.012 Å, and (f) an explicitly solvated model with six CD3CN molecules. ... 43 Figure IV–9. Optimized geometries of the PNA+2ACN (a) and PNA+6ACN (b) models. .... 44 Figure IV–10. Bond lengths and bond angles in the S0 state (upper value) and T1 state (lower
List of Tables
Table IV–1. Experimental and Calculated Vibrational Frequencies and Assignments of Major IR Bands (in 1200–1700 cm−1) of PNA, PNA-15NH2, and PNA-15NO2 in the Ground State and the Lowest Excited Triplet State. ... 41
List of Schemes
Scheme III–1. Top: DCB•− ejects an electron into the solvent ACN, resulting in the formation of neutral DCB and ACN2−. Bottom: Py2•+ captures the excess electron in ACN2−. ... 24
Chapter I
Introduction
Many of the fascinating events of this universe happen in the blink of an eye. Human evolution thrives on deciphering the mysteries of these events. Among these fascinating events, light–matter interactions have allured many researchers due to their significant implications in various processes that occur in our nature and this led to the development of a field of science called photochemistry [1]. Photosynthesis [2,3], vision [4,5], C—C bond cleavage [6,7] and photochromism [8,9] are classic examples of photochemical processes that can be seen in our nature. The trigger for these photochemical reactions is often the structural changes associated with the absorption of light by the molecule. Unraveling the mechanisms of these light-driven events enables us to mimic the sophisticated strategies found in the nature, which will eventually turn out to be the shortest way to the development of sustainable and cleaner energy sources.
To elucidate underlying mechanisms of photochemical processes, it is essential to study the dynamics and molecular structure of the transient species (e.g., excited states, radicals and ions) that are responsible for the reactivity of the reactants [10]. For example, Norrish type II reactions are very inefficient in aromatic esters if the lowest excited singlet (S1) state of the molecule has a π–π* character. However, these reactions proceed efficiently if the S
1 state is of charge transfer (CT) character [11]. Similarly, in the case of acetopheones, the lowest electronic triplet (T1 and T2) states are closely lying and are in thermal equilibrium with each other [12]. In such a situation, the nature of the T1 state alone cannot account for the reactivity of the molecule towards photoinduced H-atom abstraction. Thus, detailed information about the electronic excited states using spectroscopic approaches is required and allows material chemists to design new chromophores for applications in organic light emitting diodes (OLEDs), organic photovoltaics (OPVs), photocatalysts, etc. As these electronic excited states or transient species are short-lived, time-resolved spectroscopy [13,14] is undoubtedly the best choice to study their molecular structures and dynamics.
Photochemical reactions usually occur over a broad timescale ranging from few tens of femtoseconds to few thousands of seconds. The fastest reactions are seen in wave packet motion of molecular vibrations and photoinduced electron transfer (PET) (ionization), whereas the slowest reactions are observed as phosphorescence of molecules. Time-resolved spectroscopy had started after the advent of flash photolysis established by Porter [15,16], progressed concurrently with the developments in ultrafast laser technology, and already reached the femtosecond time regime [17,18]. One can now obtain the information of excited states ranging from few femtoseconds up to few hundreds of microseconds using pulsed lasers with different pulse durations. Researchers have used both transient absorption [19,20]
and time-resolved vibrational (IR [21-24] and Raman [25-28]) spectroscopies to elucidate the structural and dynamic information of excited states. Nevertheless, more thorough understanding of excited states is far from completion. Here in this Thesis, we present results of two fundamentally important experiments in which we try to advance our understanding of the reaction dynamics and nature of excited states in the condensed phase.
In the present study, nanosecond time-resolved IR (TRIR) spectroscopy is used to reveal the structure and dynamics of transients associated with the photophysical and photochemical pathways of PET reactions. Vibrational spectroscopy is inherently sensitive to the molecular structure of transient species. For instance, the frequency of a specific vibrational mode of the transient may reflect changes in bond length between the excited state and the ground (S0) state [23,29], which in turn provides information about changes in the structure of the molecule. Transient absorption spectroscopy in the visible region is also capable of producing such shifts in electronic bands relative to the S0 spectrum. However, it is not possible to know using transient absorption spectroscopy which part of the molecule is prone to change and to what extent compared with the other part. Such structural information can be more directly obtained from vibrational spectra. Moreover, electronic absorption bands are very broad and they may overlap with each other when the reaction of interest involves more than one transient species as in the case of benzophenone, of which T1 state and ketyl radical absorptions fall in the same spectral region [30]. In contrast, IR bands are normally narrower and specific to particular functional groups of the molecule. These characteristics make TRIR spectroscopy ideal for the study of molecular structure and dynamics of transients involved in PET reactions.
Broadly, PET reactions are classified into two types [31]: intermolecular and intramolecular PET reactions. If an electron is transferred from excited-state donor to ground-state acceptor or from a ground-ground-state donor to excited-ground-state acceptor, such a reaction is termed an intermolecular PET reaction. Intramolecular PET reactions is a class of reactions where an electron is transferred between donor and acceptor moieties within the same molecule in its electronic excited state. Both of the reactions are fundamentally important owing to their significance in the OPV applications. For example, the functioning of solar cells is purely based on consecutive ET processes. Both charge creation and charge annihilation are crucial for the performance of these photovoltaic devices. Charge recombination and relaxation of dye molecules to the triplet manifold are considered as a loss mechanism in organic solar
transfer reaction is the mirroring of the reaction of regeneration of dye molecules in dye-sensitized solar cells (DSSCs). Similarly, in solid-state solar cells where compact donor acceptor (D–A) dyads are used, excitation losses via relaxation to a triplet state are significant. It is therefore quite important to understand the nature of the triplet state of such chromophores. In this Thesis, we try to shed light on a BET reaction and triplet structure using TRIR.
The rest of this Thesis consists of four chapters. Chapter II deals with the experimental and data analysis techniques we used to perform experiments and interpret the results. This involves the technical details of the laboratory-built nanosecond TRIR spectrometer that is capable of measuring the near/mid-IR spectrum between 800–12000 cm–1 and a laboratory-built sample circulation system. It is worthy to mention that the present experiments have been made possible owing to high sensitivity of the spectrometer, i.e., absorbance changes as low as 1 × 10⁻⁶. Theoretical principles of singular value decomposition (SVD) analysis and global curve fitting techniques are also explained very briefly.
In Chapter III, the BET reaction mechanism between pyrene (Py) and 1,4-dicayanobenzene (DCB) in acetonitrile (ACN) solution is studied using the spectra recorded in both near- and mid-IR (NIR and MIR) regions. Here Py and DCB serve as a model system in which forward electron transfer (FET) is accomplished rapidly because of symmetry matching between the LUMO of Py and LUMO of DCB, whereas BET is retarded because of symmetry mismatch between the LUMO of DCB and HOMO of Py. It is interesting to reveal what would govern the BET reaction where a direct recombination of the generated ion pair is restricted by orbital symmetry, which is usually the case in organic solar cells. A reaction mechanism is proposed that can explain the observed kinetics of NIR and MIR transients (radical cation and anion in the present case).
In Chapter IV, the bonding structure of the T1 state of p-nitroaniline (PNA) is studied in acetonitrile-d3 (CD3CN) solution using MIR spectra between 1200–1700 cm–1. PNA serves as a model compound for push-pull chromophores or D–A type dyads. PNA exhibits a CT state in the S1 state. A similar CT structure would be expected for the T1 state as well, but this remains to be tested experimentally. A unique structure of T1 PNA is proposed on the basis of experimental results of PNA and its isotopomers as well as DFT calculations using an explicit solvation model.
Chapter II
Nanosecond Time-resolved
Near/Mid-IR spectrometer and
II-1 Introduction
In this chapter, we present technical details of the laboratory-built nanosecond TRIR spectrometer used in this work and the principles of numerical data analysis techniques (SVD and global curve fitting) employed for physical interpretation of observed spectroscopic results.
II-2 Nanosecond Time-resolved Dispersive IR Spectrometer
Nanosecond TRIR spectroscopy is a well-known technique used to study the photophysical and photochemical processes that are taking place in the sub microsecond to millisecond time domains. The development of nanosecond dispersive TRIR spectrometers dates back to 1990s. Yuzawa and co-workers [32] developed a high-sensitivity nanosecond TRIR spectrometer by using a high-intensity IR light source and an ultralow-noise, wide-bandwidth amplifier. However, long acquisition time and poor spectral resolution were the major drawbacks of their apparatus. Yabumoto and co-workers [12,33] improved the spectral resolution of the apparatus by enhancing the throughput of the spectrometer. More specifically, they employed a long-focal-length spectrometer with a low f-number. It was further modified to cover a wider spectral range of both NIR and MIR regions so that one can access not only vibrational transitions but also low-energy electronic transitions that are dark to visible spectroscopy. In the present study, we used the TRIR spectrometer originally developed by Dr. Sohshi Yabumoto [33].
Time-resolved Raman spectroscopy is a complementary approach to TRIR spectroscopy [27,28,34,35]. Although both techniques provide essentially the same vibrational information except that different selection rules apply to Raman and IR, TRIR spectroscopy has a couple of advantages over time-resolved Raman spectroscopy in studying the reaction mechanisms of photochemical reactions. First, fluorescence, which often accompanies photophysical and photochemical reactions, severely interferes with Raman measurements. Second, time-resolved Raman spectroscopy requires the probe light to be in resonance with an electronic transition from the excited state generated by the pump pulse. This requirement implies that at the expense of high selectivity due to the resonance Raman effect, only the information of the excited states that can be resonantly excited will be obtained with time-resolved Raman spectroscopy. If we are interested in seeing the whole reaction dynamics rather than particular transient species that is in resonance with the probe light, we should choose a technique that does not utilize resonance enhancement, i.e., TRIR.
II-2.1 TRIR Setup
The TRIR spectrometer used in the present study is schematically shown in Figure II–1. It consists of a photoexcitation light source, an IR probe light source, a dispersive monochromator, a slit controller, a speed detector, a differential amplifier, and a high-speed digitizer. The photoexcitation light source was a Q-switched Nd-YAG laser (IB Laser, DiNY pQ 355), which emits the third harmonic at 355 nm. The pulse width was 7 ns and repetition rate was 500 Hz. The maximum pulse energy was 1.1 mJ, but typically pulse energy of ~100–150 µJ was used for photoexcitation. A ceramic IR emitter purchased from JASCO was used as the probe light for MIR measurements (<4000 cm–1), whereas a tungsten-halogen lamp was used for NIR measurements (>4000 cm–1). The probe IR light was focused onto the sample and was introduced into a modified Czerny–Turner monochromator (JASCO, CT-50TFP; focal length = 500 mm and F-number = 4.3) using a pair of off-axis ellipsoid mirrors. The probe light transmitted through the sample was dispersed by the monochromator. The dispersive method utilized in the present study excels the FTIR method in sensitivity [12], [36], stability, and less influence of artifacts [32]. Three manually switchable gratings are available in this monochomator. The groove density and blaze wavelengths of these gratings are as follows: (i) 100 lines mm–1 and 7.3 µm; (ii) 300 lines mm–1 and 3 µm; and (iii) 600 lines mm–1 and 10 µm. These three gratings can cover the spectral window between 800 and 11500 cm–1. Higher-order diffraction was removed by using an order sorter after the exit slit of the monochromator that comprises appropriate filters attached to a filter wheel. When the tungsten-halogen lamp was used, the visible portion of the output was eliminated by using a pair of IR transmitting filters (Sigma Koki, ITF 85IR): one before the sample and the other in front of the entrance slit of the monochromator. The entrance and exit slits of the monochromator were controlled precisely by an external OPTMIKE slit controller to keep the spectral resolution constant throughout the measurement. The mechanical slit width (Sm) at any given spectral resolution identical to its optical slit width (Ssp) for a Czerny–Turner type monochromator is given by Eq. (II–1).
Sm=Ssp
d!ν =10SspmfG
!ν02
cos ε+arcsin 5mG !ν0cosε ! " # $ % & ' ( ) * + , (II–1)
Here 𝑑! is the linear dispersion in wavenumber, m is the order of diffraction, f is the focal length, G is the groove density of the grating used, 𝜈! is the center wavenumber, and ε is the half value of the Ebert angle, which is the angle between the incident and diffracted lights at the grating. The Ebert angle of the CT-50 monochromator is 27°.
The dispersed light was further focused on the IR light detector using an off-axis ellipsoid condenser. A mercury cadmium telluride (MCT) detector was used for the region below 2000 cm–1 and an indium antimonide (InSb) detector for the region above 2000 cm–1. The bandwidths of the MCT and InSb detectors were 20 and 15 MHz, respectively. The detected signal from the IR detector was amplified by coupling the detector output with an ultralow-noise preamplifier using a 22 nF capacitor, followed by further amplification by a factor of 1000 with a differential amplifier (NF Corporation, 5305; 10–1000 amp. gain, 10 MHz bandwidth) so that only the small changes in the probe light intensity induced by the pump pulse can be detected. Owing to this AC-coupled amplification, the sensitivity of the instrument reaches as high as 1 × 10⁻⁶. The time resolution of the instrument is limited by the bandwidth of the differential amplifier, which is approximately 80 ns.
The output of the main amplifier was fed to a high-speed digitizer (NI, 5112; dynamic range = 8 bit, sampling rate = 100 MHz) mounted on a personal computer. The apparatus is also equipped with another digitizer from Tektronix (DSA 602A), which was used for measurements with a sampling rate higher than 100 MHz. However, the data transfer throughput between the oscilloscope and the computer is low because of GPIB communication.
The procedures for measuring steady-state and time-resolved difference IR spectra are as follows. The intensity of the IR probe light, I(ν!0), and the intensity of the IR probe light
transmitted through the sample, I(!ν) , were measured consecutively. The probe light was modulated by a rectangular wave generated by a chopper in order to measure the intensity in the AC-coupled amplification detection scheme. The absorbance of the sample is calculated using Beer–Lambert law.
A(ν)= –log I( !ν)I(!ν 0) ! " # $ % & (II–2)
The IR absorbance difference (ΔA) spectrum was measured by spatially overlapping the pump pulse and probe light at the sample. The beam diameter of the probe light was about 2 mm at the sample position. The 355-nm pump beam was loosely focused so that it can illuminate a sufficiently large area of the probe beam. The small changes in the intensity of the probe light
induced by photoexcitation with the pump pulse was measured using the AC-coupled detection scheme. The measured ΔA spectrum is substantially interfered with Q-switch noise, thermal noise of the detector, and other electronic noises. To achieve a high signal-to-noise ratio (S/N), it is desirable to reduce all these noises as much as possible. To eliminate Q-switch noise, the IR detector was shielded using a box made of aluminium. Cross talk between the cables was reduced by optimizing cable orientations and appropriately grounding the electronic devices. The intensities of the probe beam with pump on and off were measured in sequence and the pump-off spectrum was subtracted from the pump-on spectrum to obtain the time-dependent change in the intensity of the probe light, ΔI !ν,τ
( )
. The time-dependent absorbance change ΔA is given by Eq. (II–3).ΔA !
( )
ν,τ = –log 1+ΔI !( )
ν,τ I( )
!ν " # $ $ % & ' ' (II–3)Figure II–1. Optical layout of the nanosecond TRIR spectrometer.
Ceramic IR Source Probe Optical Shutter Sample cell Dispersive Monochroamator Order Sorter IR detector with pre amplifier
AC coupling Main Amp. High-Speed Digitizer PC Q- Switched Nd:YAG Laser + THG 355 nm Excitation 355 nm
II-2.2 Sample Circulation System
TRIR measurements were performed using a sample circulation system that allows us to have a fresh sample for every new pulse at the sample. This sample circulation system prevents the sample from degradation due to multiple excitation with the pump pulses. It consists of a sample cell holder, IR-transparent optical windows, Karlez® O-rings, Teflon® tubing, Swagelok® bulkhead unions, a gear pump driven by magnetic field (Idex Co.), and a reservoir. Schematics of the sample cell holder components and the entire sample circulation system are shown in Figure II–2 and Figure II–3, respectively. The sample cell holder is made of stainless steel and has very flat and smooth surface with holes to accommodate the O-rings. The inlet and outlet of the sample holder were connected to the gear pump and sample reservoir, respectively, using Teflon tubing to enable sample circulation. Optical-grade calcium fluoride and barium fluoride plates (thickness = 20 mm), which are transparent throughout the visible and IR regions, were used as optical windows. A lead spacer was sandwiched by these optical windows. Depending on the sample and the spectral region to be measured, the path length of the cell was varied by changing the thickness of the spacer. Typically 50, 100, and 500 µm spacers were used for MIR measurements, whereas a 1 mm spacer was used for NIR measurements because of very weak signal intensity in this region.
The sample was circulated using the gear pump at a flow rate of 20 cm/s. The sample in the reservoir was bubbled with argon gas to remove dissolved molecular oxygen (O2).
Figure II–3. Schematic of the sample circulation system.
II-3 Singular Value Decomposition Analysis
SVD analysis is one of the most popular multivariate data analysis techniques used by spectroscopists to extract the information on the number of significant components involved in the spectra measured as a function of time, temperature, pH, concentration, etc. SVD analysis has previously been used in TRIR spectroscopy [37-39] to interpret the transient spectra based on a physical model. If the data reconstructed using the model reproduce the original data well within experimental uncertainty, we can conclude that the model represents a plausible mechanism of the underlying photophysical or photochemical processes. SVD was employed in the PNA work (see Chapter IV).
II-3.1 Mathematical Definition
Given a real m × n matrix A, SVD decomposes it as
A=USVT (II–4)
where U is an m × m orthogonal matrix, V is an n × n orthogonal matrix, and S is an n × n diagonal matrix. The columns of U are the left singular vectors of AAT and the rows of VT are the right singular vectors of ATA. The diagonal matrix S is called a singular value matrix and
its diagonal elements are called singular values, which are nothing but the square roots of the eigenvalues of either of the left singular vectors uk or the right singular vectors vk. These
To Argon Cylinder Gear Pump Sample Reservoir Sol vent Res ervo ir PTFE tubing Cell Hol der
singular values are placed in a decreasing order (s11 > s22 > s33 > … > srr > … > snn) along the diagonal of the matrix S. The matrix notation of SVD is shown in Eq. (II–5).
𝑎
!!⋯ 𝑎
!!⋮
⋮
⋱
⋯
⋮
⋮
𝑎
!!⋯ 𝑎
!"= 𝒖
𝟏⋯ 𝒖
𝒌⋯ 𝒖
𝒏𝑠
!!0
0
0
⋱
0
0
0 𝑠
!!𝒗
𝟏⋮
𝒗
𝒌⋮
𝒗
𝒏 (II–5)After SVD, we have to decide on the number of significant components that are essential to reproduce matrix A. Various criteria for deciding on the adequate number of SVD components are available in the literature. In one of those criteria, the contribution of each singular value to the whole data is evaluated and all of the singular values that account for 70–90% of the total of singular values are considered for reconstruction. In another criterion, singular values higher than the mean of all the singular values or higher than the fraction 0.7/n (n denotes total number of singular values) are retained. However, these criteria may depend substantially on the noise level in the TRIR spectra. Furthermore, they tend to result in too many components, which make it impossible to analyze the time-resolved data using a physical model. Here we inspect spectral and temporal components (uk and vk) of each singular value and focus on only components that exhibit physically meaningful spectral or temporal behaviors. By doing so, we can reduce noises and reproduce the matrix A with a reasonably small number of components that typically account for more than 90% of the raw data.
II-4 Global Fitting Analysis
Global fitting analysis [40] is a popular curve fitting technique used in time-resolved spectroscopic studies to check the validity of physical models used to explain experimental observations as well as to extract the spectral and dynamics information of the transient species generated in a photochemical reaction. We employed global fitting analysis in the Py/DCB work (see Chapter III). It performs simultaneous fitting of all the data using model functions with several common adjustable parameters. In time-resolved spectroscopy, the acquired spectra at different times are represented as a matrix. Let us denote such a matrix Y. According to Beer–Lambert Law, the absorbance of the sample at wavelength λ and time t,
y(t,λ), is the sum of contributions from all the absorbing species involved in the reaction. It
y t, λ = c1 t ε1 λ + c2 t ε1 λ + c3 t ε3 λ + … … … . + cn t εn λ = c!(t)ε!(λ)
!
!!!
(II–6)
where ci(t) is the concentration of the ith molecular species involved and εi(t) is the modified molar absorptivity of the same molecular species which is actually a product of path length (l) and molar absorptivity (εn†(t)). Hence matrix Y can be very easily decomposed as shown in Eq. (II–7).
Y = CS + R (II–7)
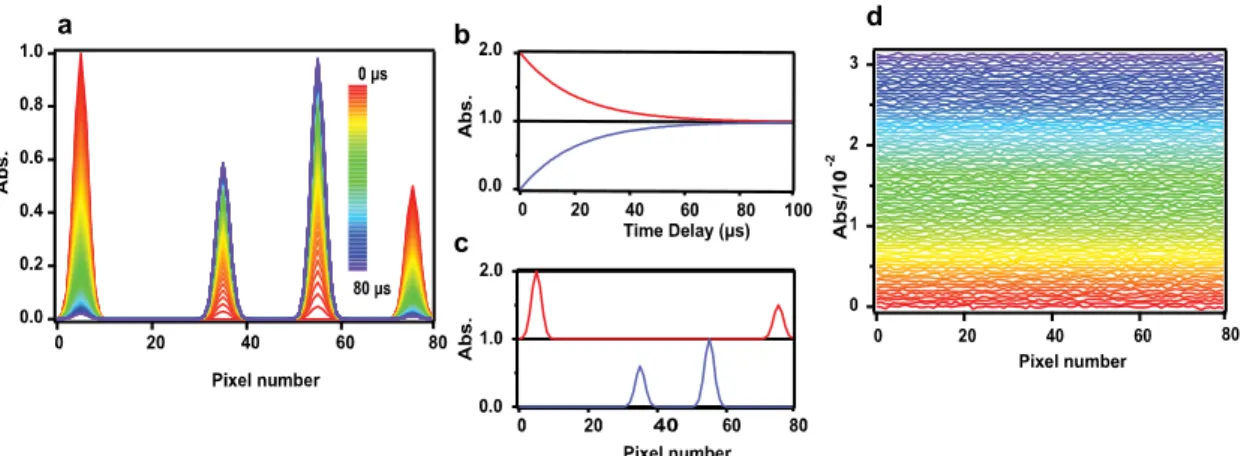
where the columns of matrix C represents the concentration profiles (i.e., time profiles) of transient species as a function of time, the rows of matrix S represents the modified absorptivity of the transients (i.e., spectral profiles) as a function of wavelength, and R represents the residual matrix, which in most cases represent random noises. An example of global fitting analysis is shown in Figure II–4. Hypothetical time-resolved spectra recorded at different time delays (Figure II–4a) are represented as a matrix. Here we use two components that obey first-order kinetics but show complementary behaviors so that the spectrum observed at any point in time and space can be represented as a liner combination of these two components alone. Using the fitting functions, all the waves are fit simultaneously. The concentration and spectral profiles obtained with global fitting are shown in Figure II–4b and Figure II–4c, respectively. The overall performance of the global fitting analysis can be examined by taking a closer look at the residuals shown in Figure II–4d. As there is no particular spectral/temporal pattern remaining except for noises, it is confirmed that the global fitting analysis is successful. A technical difficulty may arise when our starting physical model is exceedingly complex. Analytically solving rate equations is not always possible and hence we may need the help of numerical methods to perform this analysis.
Figure II–4. Simulated time-resolved spectra (a), extracted concentration profiles (b),
spectral profiles (c) and residuals (d) obtained after performing global curve fitting analysis over the time-resolved spectral data matrix shown in (a).
a b
c
Chapter III
BET Mechanism of a
Bimolecular PET Reaction
between Py and DCB
III-1 Introduction
Photoinduced intermolecular electron transfer (PIET) reactions are one of the fundamentally important photochemical processes owing to its significance in photochemistry and photobiology [31,41,42]. PIET reactions play a prominent role in the function of OPVs. It is essential to advance our understanding of the PIET processes with a view to rational design of efficient devices that can solve the urgent issue of renewable energy sources. In a PIET, FET leads to charge formation, and BET leads to the decay of the induced charges via, e.g., recombination reactions. The latter process is strongly favored thermodynamically. Preventing or impeding the charge recombination seems to be an important prerequisite for enhancing the performance of DSSCs [43,44] as well as organic bulk heterojunction solar cells [45]. Although a variety of strategies have been developed and demonstrated, such as tuning the HOMO–LUMO band gap between the donor and the semiconductor material and changing orbital symmetry in donor–bridge–acceptor systems [46], efficient retardation of charge recombination is still a challenging goal in solar cell research.
The major obstacle to this goal arises from the fact that BET is very often not a simple recombination of primary charge carriers but a multistep photochemical reaction involving other molecular species in the system as well. Detailed understanding of the mechanism of BET is thus of paramount importance for overcoming the conundrum of fast charge recombination in all photovoltaic devices. Spectroscopic approaches provide a direct means to look at PET reactions and have proven powerful for such mechanistic studies. Much work using transient absorption spectroscopy has focused on ultrafast FET reactions [47-52]. Hino et al. [53,54] provided a detail account on the mechanism of FET by using Py–N,N-dimethyl aniline (DMA) and Py–DCB systems. They found that FET in Py–DMA proceeds through formation of an exciplex in moderately polar solvents followed by formation of contact ion pairs, solvated ion pairs, and free ions. In Py–DCB, however, FET proceeds through solvated ion pairs and free ions. No exciplex formation has been detected in this system. Though the energies of exciplexes, solvated ion pairs and free ions are similar for both Py–DMA and Py– DCB systems, the FET pathways are different. They also worked on various Py–quencher systems [53], where the quencher can be either a donor or an acceptor, and found that there is no correlation between electron donor–acceptor interactions and the photodissociation yields of free ions. They concluded that the chemical property of the quencher is a key to understanding FET mechanism. Koch et al. [55] detected the formation of exciplexes in PIET reactions using ultrafast IR spectroscopy. Ultrafast transient absorption and IR spectroscopies
[56,57] have been used to detect both contact ion pairs and solvated ion pairs in PIET reactions.
In contrast to FET, BET reactions, which proceed on a much slower time scale (typically in the ns–µs time regime), are yet to be more thoroughly investigated in particular with regard to their reaction mechanisms. In this study, we used time-resolved NIR and MIR spectroscopy [12,58] to unveil the mechanism of the BET dynamics in the PIET reaction between Py and DCB dissolved in ACN. Unlike conventional transient absorption spectroscopy, our technique is able to detect vibrational transitions in the MIR region as well as specific types of electronic transition (e.g., CT transitions) that appear in the NIR region, making it feasible to identify and distinguish between coexisting molecular species.
Figure III–1. UV/Vis spectra of Py (red solid curve) and DCB (black solid curve) in ACN
solution. Also shown is the UV/Vis spectrum of the ACN solution of both Py and DCB (grey dashed curve). In all solutions, the concentrations of Py and DCB were 0.50 and 5.0 mM, respectively. The molar extinction coefficient of Py at the excitation wavelength (355 nm) is 280 M−1 cm−1, whereas that of DCB is one order of magnitude smaller.
Py and DCB form a fundamental PIET system [54,59-61] suitable for the mechanistic study of BET. Upon photoexcitation of Py in the presence of DCB in polar solvent (see Figure III–1 for the UV/Vis spectra of Py and DCB in ACN), Py radical cation (Py•+) and DCB radical anion (DCB•−) are produced within 100 ns via intermolecular electron transfer from the S state of Py. The efficiency of FET reaction is expected to be considerable owing
yields of ion pairs (Φip = 0.38 in ACN (ε = 37.5) and 0.08 in dichloromethane (ε = 3.75)). Surrounding polar solvent molecules usually stabilize the generated ionic species and keep these ions apart. As a result, the generated ionic species become free ions. Thus the recombination of ion pairs is anticipated to occur at a slower rate of 104–105 s–1, since the diffusion rate constant is of the order of 1010 M−1 s−1 and the concentration of ions generated is of the order 10−5–10–6 M. The focus of this work is on this slower dynamics of the free ions during which an electron is back-transferred and the ions are brought to the neutral state. This process in the Py–DCB system may be viewed as mirroring the dye regeneration by the iodide/triiodide redox couple in standard DSSCs [64-66]. The analogy here is not rigorous in the sense that dye regeneration in DSSCs is a part of sequential “forward” transfer reactions and not really “back” electron transfer. Nevertheless, as will be shown below, the BET in the Py–DCB system seems to resemble closely the process of the dye regaining an electron from anionic species in DSSC solvent.
III-2 Materials and Methods
III-2.1 Materials
Py (≥99%) and DCB (98%) were purchased from Sigma Aldrich. HPLC-grade ACN was purchased from J. T. Baker. Prior to spectroscopic measurements, Py and DCB were purified by sublimation and subsequent recrystallization from ethanol (anhydrous). ACN was used as received. Py and DCB were dissolved in ACN at 0.50 and 5.0 mM, respectively.
III-2.2 Nanosecond Time-resolved Near/Mid-IR Spectroscopy
The laboratory-built nanosecond TRIR spectrometer used in the present study has been described in Chapter II. A 355 nm pulse (7 ns duration; 36 µJ energy; 500 Hz repetition rate) photoexcited Py in the sample solution, which was continuously circulated by a gear pump through a 500 µm flow cell consisting of two CaF2 windows. The sample solution in the reservoir was normally bubbled with argon gas. In the oxygen quenching experiment, however, it was saturated with oxygen gas. The spectral resolution was set to 200 cm−1 for the NIR and 16 cm−1 for the MIR. The FTIR spectrum of Py in CD3CN (Figure III–3a) was recorded on a JASCO FT/IR-6100 spectrometer using a sample cell composed of two CaF2 windows and a 100-µm lead spacer. A spectral resolution of 2 cm−1 was used in the FTIR measurement. All measurements were performed at room temperature.
III-2.3 Computational Details
DFT calculations of isolated Py monomer and Py dimer cation (Py2•+) were carried out with the B3LYP exchange-correlation functional [67,68] in conjunction with empirical dispersion correction recently introduced by Grimme and co-workers [69] (B3LYP-D3). The aug-cc-pVTZ basis set [70,71] was adopted in this work. Equilibrium geometries, harmonic vibrational frequencies, and IR intensities were determined using Gaussian 09 program package [72]. To facilitate comparison with experimental IR spectra, calculated harmonic frequencies were uniformly scaled by a factor of 0.97 in accordance with a reported B3LYP/aug-cc-VDZ scaling factor of 0.9698 for frequencies higher than 1000 cm−1. Theoretical IR spectra were plotted using a Gaussian band envelop with a full-width at half-maximum (FWHM) of 10 cm−1. All computational work was done by Dr. Yoshifumi Nishimura and Prof. Henryk A. Witek.
III-3 Results and Discussion
III-3.1 Nanosecond TRNIR/MIR Spectra of Py and DCB in ACN Solution Measured under Ar Bubbling.
In this section, results of nanosecond TRIR spectroscopy of the BET reaction in the Py–DCB system are presented. TRNIR/MIR spectra of Py and DCB in ACN show four prominent transient absorption bands (Figure III–2a–c) with maxima at 6800, 2100, 1216, and 1136 cm−1 and a very broad feature that extends from ~9000 cm−1 toward the visible. The temporal behaviors of the five transient features are displayed in Figure III–2d–h. All of these time profiles have an instantaneous rise except for the transient at 11000 cm−1 (Figure III–2d), which exhibits a somewhat slower rise compared with the other transients. The decay kinetics of the transients at 11000, 6800, 1216, and 1136 cm−1 (Figure III–2,e,g,h) appear similar, but, interestingly, they are quite different from that of the transient at 2100 cm−1 (Figure III–2f). Because the FET reaction is complete within the time resolution of the apparatus (~80 ns) [61], the transient bands we observed must be predominantly due to either Py•+ or DCB•−. However Py•+ is known to form Py
2•+ via interacting with Py in a diffusion controlled manner [73,74]. Thus Py2•+ may also occur along with Py•+ in the solution. It is well established that Py •+ [73,75,76] shows a charge-resonance electronic band at around 6700 cm−1 in polar
bands at 1216 and 1136 cm−1 are vibrational bands originating also from Py2•+ because they appear to decay synchronously with the charge-resonance band of Py2•+.
Figure III–2. Left: Time-resolved IR spectra in the regions 3800–12000 cm−1 (a), 2000–2200 cm−1 (b), and 1120–1260 cm−1 (c), of Py and DCB dissolved in ACN (0.50 and 5.0 mM, respectively) excited at 355 nm with Ar bubbling. The spectra in (a) are masked at around 4400 cm−1 due to an overtone band of the solvent. Each time-resolved spectrum is offset by 4 × 10⁻⁵ for clarity of display. Right: Time profiles at 11000 (d), 6800 (e), 2100 (f), 1216 (g), and 1136 (h) cm−1. The smooth black curves are the result of the kinetic analysis based on the reaction mechanism shown in Scheme III–1.
III-3.2 Vibrational Assignments
In this section, the vibrational assignments of the transient species observed in the TRIR spectra are discussed. To assign these vibrational bands, we refer to DFT calculation results of gas-phase Py and Py2•+. The FTIR spectrum of Py in ACN (Figure III–3a) shows three prominent bands at 1244, 1186, and 1096 cm−1, which are well reproduced in the calculated IR spectrum (Figure III–3b) at 1235, 1182, and 1088 cm−1, respectively.
Figure III–3. (a) FTIR spectrum of Py (30 mM) in CD3CN. (b) DFT/B3LYP calculated IR spectrum of the gas phase Py molecule (plotted using a Gaussian band envelop with a FWHM of 10 cm–1). (c) Transient IR spectrum at 0–5 µs, same as the top trace of Figure III-1c. (d) DFT/B3LYP calculated IR spectrum of gas phase Py2•+.
Remarkably, the calculated spectrum of Py2•+ is also in excellent agreement with experiment. The observed transient MIR spectrum at 0–5 µs (Figure III–3c; same as the top trace of Figure III–2c) shows perfect spectral resemblance with the calculated IR spectrum of Py2•+ (Figure III–3d). The calculation reveals three IR bands at 1213, 1195, and 1133 cm−1 (Figure III–3d), of which the 1213 and 1133 cm−1 bands are likely to correspond to the two transient bands at 1216 and 1136 cm−1 (Figure III–3c). These bands are assigned to C–H in-plane bending and in-in-plane ring deformation, respectively. The discrepancy in frequency between experiment and theory is found to be only −3 cm−1. The calculated band at 1195 cm−1 is not clearly seen in the experimental spectrum because of poor S/N, but we could see a small hump at the red edge of the intense 1213 cm−1 band and it might correspond to the calculated band at 1195 cm−1.
The DFT calculations suggest that the contribution of Py•+ is relatively small because the calculated IR spectrum of Py•+ (data not shown) is in less agreement with experiment than that of Py2•+. This conclusion can also be justified as follows. The ionic species of polycyclic aromatic hydrocarbons tend to dimerize in solution and dimer cations are energetically more favored than their monomer counterparts [75,77,78]. In addition to the difference in population, the reactivity of monomeric species are faster than dimeric species by an order of
4 2 0 Int (km mol -1 )/10 2 1300 1250 1200 1150 1100 Wavenumber (cm-1) 9 6 3 0 Int (km mol -1 ) 3 2 1 abs/10 -2 2 1 0 ∆ abs/10 -5
the 6800 cm−1 band (Py2•+) and the 1216 and 1136 cm−1 bands. Considering all these together, the negligible contribution of Py•+ in the measured spectra seems reasonable.
The 2100 cm−1 band is characteristic of the C≡N stretching mode of nitriles and is safely attributable to DCB•−. Our DFT/B3LYP calculation of gas-phase DCB•− indeed predicts a very intense IR band at 2112 cm−1 (data not shown), in excellent agreement with the observed peak position. This band arises from the asymmetric combination of the two C≡N stretches. Thus we have successfully assigned all the vibrational bands observed in the TRIR spectrum using DFT/B3LYP calculations.
III-3.3 Molecular Oxygen Quenching Experiment
So far, all the transient bands have been assigned except for the spectral features over 9000 cm–1 that can be associated with neither Py
2•+ nor DCB•−. In this section, the experimental results of O2 quenching experiments performed by bubbling the solution with O2 are presented to obtain a clue to the origin of the spectral features over 9000 cm–1.
Figure III–4. Time-resolved near- and mid-IR spectra of Py (0.50 mM) and DCB (5.0 mM)
dissolved in ACN, measured at 0–5 µs with Ar (top) and O2 (bottom) bubbling. The spectrum taken with Ar bubbling is offset by 4 × 10⁻⁵ for clarity of display.
Anions are usually more efficiently quenched by molecular oxygen than cations. The intensities of the transient bands at 11000 and 2100 cm−1 are drastically quenched with oxygen bubbling (Figure III–4, bottom) to an almost undetectable level compared with those at 6800, 1216, and 1136 cm−1 (Figure III–4, top). The overall intensity drop in the transient spectra is attributable to the quenching of the excited-state population [79,80]. This result indicates that the transient band at 11000 cm−1 comes from an anionic species. The 11000
cm−1 transient could be produced as a result of reaction between DCB•− and solvent ACN, considering the strong electron affinity of ACN. The electron affinity of ACN in vacuum is – 2.84 eV [81] and forms solvent anions [81-83] via reactions of an excess electron with one or more ACN molecules, along with the stabilization of an excess electron ejected in ACN by a substantial solvent shell. Those reactions would result in the formation of ACNn– (“traditional” solvated electron) [81-83]. Previous studies [84,85] on ejection of excess electron in ACN found two species with absorption bands in the visible (~530 nm) and NIR regions (~1500 nm). The lower-energy electronic band in the NIR region has been assigned to dipole bound solvated electron. However, the reported lifetime of the solvated electron in ACN (~80 ps) [84,85] is simply too short to be detected with our apparatus. The higher-energy electronic band in the visible region has been assigned to ACN dimer anion ACN2−, in which the excess electron forms a covalent bond between the cyano-carbons of two antiparallel ACN molecules. The assignment of ACN2− is thoroughly corroborated based on transient absorption [84,85], γ -radiolysis of α -ACN at 77 K [83], and theoretical calculations [81-83,86]. From the previous study of Shkrob et al. [84,85], it is known that γ-radiolysis of two crystalline forms of ACN (namely, monoclinic α-ACN and orthorhombic β-ACN) produces ACN2− and ACN− with bands at 530 and 420 nm, respectively. The possibility of ACN− is ruled out in liquid ACN based on the stability of neutral dimers and the molecular orientation in liquid ACN that should be close to α-ACN. It is thus very likely that the higher-energy band in the visible region is assigned to ACN2−, whose red edge has been observed in the present study, and we attribute the spectral feature above 9000 cm−1 to ACN2−.
III-3.4 Kinetic Analysis
Having assigned the five transients bands toPy2•+, DCB•−, and ACN2−, we now examine their time profiles (Figure III–2d–h) in more depth. The observation that Py2•+ and DCB•− show markedly different decay kinetics (compare, e.g., Figure III–2e,f) seems counter-intuitive because it is compelling to think that those carriers with opposite charges should decay in unison, irrespective of whether geminate (first-order reaction) or non-geminate (second-order reaction) recombinations take place, in order to maintain charge balance.
Scheme III–1. Top: DCB•− ejects an electron into the solvent ACN, resulting in the formation of neutral DCB and ACN2−. Bottom: Py2•+ captures the excess electron in ACN2−.
To account for the observed asynchronous decay kinetics in the Py–DCB system, we propose here a mechanism of the BET reaction between Py2•+ and DCB•− in which ACN plays a pivotal role as a charge mediator (Scheme III–1). There are two possible decay channels for DCB•−: (1) the recombination with Py2•+ and (2) ejection of the electron into the solvent leading to the formation of ACN2− (Scheme III–1, top). In case 1, DCB•− would decay concurrently with Py2•+. The observed time profiles contradict this prediction, suggesting that case 2, i.e., the electron ejection into the solvent, is the major route of the DCB•− decay. It follows a pseudo-first-order reaction with rate constant k1′ (= k1[ACN]2). The preference for the electron ejection into ACN over the Py2•+/DCB•− recombination may well be due to several factors, such as orbital symmetry mismatch between the HOMO of Py and the LUMO of DCB [62,63], the high capability of ACN to solvate electrons, and the abundance of ACN as solvent molecules ([Py]:[DCB]:[ACN] = 1:10:40000). The formation of ACN2− is clearly manifested as the initial rise of the transient at 11000 cm−1 with a maximum at ~6 µs (see Figure III–2d). Because DCB•− decays preferentially via the reaction with ACN, the only available decay pathway for Py2•+ that retains charge neutrality of the system is the interaction with ACN2−, which obeys a second-order rate law with rate constant k2 (Scheme III–1, bottom).
The resulting rate equations governing the kinetics of the system are given by
d[DCB•−]/dt = − k1′ [DCB•−] (III–1)
d[Py2•+]/dt = − k2 [Py2•+][ACN2−] (III–2)
By solving Eqs. (III–1)–(III–3) with the initial conditions [Py2•+] = [DCB•−] = C0 and [ACN2−] = 0 at t = 0 and with the charge neutrality condition [Py2•+] = [DCB•−] + [ACN2−] at any given time t, we are able to obtain the time-dependent changes in the concentrations of Py2•+ and DCB•− as follows:
[DCB•−] = C0 exp(−k1′t) (III–4)
(III–5)
where α = C0k2/k1′ and Ei(x) represents the exponential integral defined as Ei( ) e / d
x t
x t t
−∞
=
∫
.These solutions can be verified by substitution of Eqs. (III–4) and (III–5) into Eqs. (III–1) and (III–2). The IR absorbance difference at time t and wavenumber ν!, ΔA( !ν,t) , can be expressed as a linear combination of [DCB•−], [Py2•+], and [ACN2−]:
(III–6) where a1(ν!) , a2(ν!) , and a3(ν!) represent the amplitudes of the time-dependent concentrations of DCB•−, Py2•+, and ACN2−, respectively. Due to the charge neutrality condition, Eq. (III–6) leads to
(III–7)
with b1(ν!) = a1(ν!) − a3(ν!) and b2(ν!) = a2(ν!) + a3(ν!).
To test the validity of our model we performed a global curve fitting analysis of the time-resolved spectra shown in Figure III–2a–c using Eq. (III–7) together with Eqs. (III–4) and (III–5). The parameters used in the fitting are the amplitudes of the two contributions [Py2•+] and [DCB•−] in the linear combinations (i.e., b1 and b2 in Eq. (III–7)), k1′, and α. The global analysis yields k1′ = (1.1 ± 0.2) × 105 s−1 and α = 0.4 ± 0.1. The smooth curves in Figure III– 2d–h are best fits obtained with these parameters, from which it is clear that the kinetic analysis based on our proposed reaction mechanism (Scheme III–1) could successfully reproduce the observed time profiles of the five transient bands. A good agreement between experiment and simulation is also found in the entire spectral window studied, as shown in Figure III–5.
[Py2i+] = C0exp[α(1− exp(−k1!t))]
1+αexp(α)[Ei(−α) − Ei(−αexp(−k1!t))]
ΔA( !ν,t) = a1(ν!)[DCBi−]+ a2(ν!)[Py2i+]+ a3(ν!)[ACN2−]
ΔA( !ν,t) = a1(ν!)[DCB i−]+ a 2(ν!)[Py2 i+]+ a 3(ν!)([Py2 i+]−[DCBi−]) = b1(ν!)[DCB i−]+ b 2(ν!)[Py2 i+]
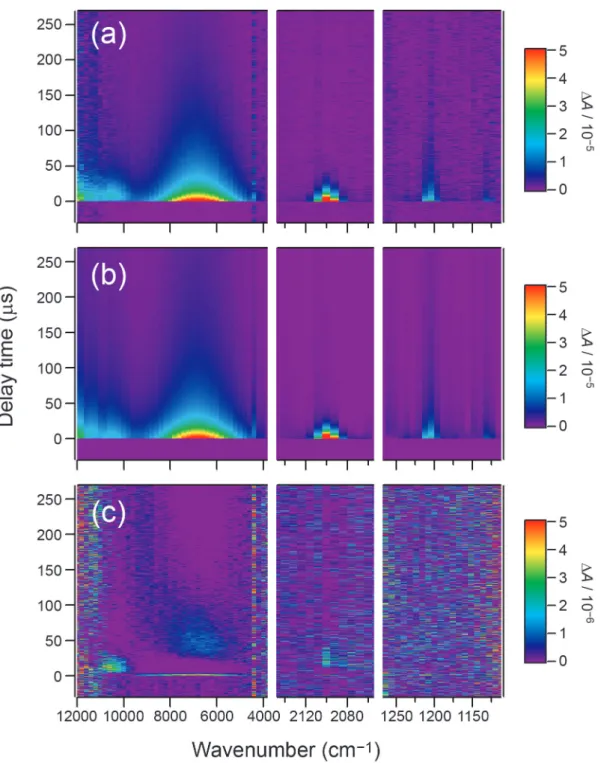
Figure III–5. Two-dimensional (2D) plots of the observed time-resolved spectra (a), the
fitted result (b), and the residue (c). Each of the three 2D plots is represented in a rainbow pseudo color scale: the highest ΔA value appears red and the lowest appears purple. Note that the maximum ΔA value is 5 × 10⁻⁵ in (a) and (b) and 5 × 10⁻⁶ in (c).
The above global fitting alone does not allow us to determine C0 and k2 independently, because they appear together as parameter α in the fitting functions (see Eqs. (III–4) and (III– 5)). However, we are able to provide estimates for the values of C0 and k2. Approximately 1% of Py molecules are calculated to be photoexcited under the present excitation conditions, so
the upper limit of the initial concentration C0 is 5 × 10⁻⁶ M. Given the reported quantum yield of 0.38 of the ion-pair (Py•+ and DCB•−) formation in ACN [54], the value of C0 is most likely of the order of 10−6 M, resulting in k2 ≈ 1010 M−1 s−1.
III-3.5 Concentration Dependence Studies of the BET Reaction between Py and DCB in ACN Solution
In this section, concentration dependence of the BET reaction between Py and DCB is examined. As the formation of Py2•+ and recombination reaction between Py2•+ and ACN2− are both second-order reactions, diffusion plays a prominent role. Thus it will be useful to test the proposed reaction scheme (refer to Section III-3.4) at various different concentrations. We measured TRNIR/MIR spectra of 5.0 mM Py and 5.0 mM DCB, where the concentration of Py was increased by one-fold and that of DCB was kept the same. Lowering the concentration of Py or DCB was not feasible as the intensity of the vibrational bands recorded at 0.5 mM Py and 5.0 mM DCB are close to the detection limit of the present apparatus.
Figure III–6 Left: Time-resolved IR spectra in the regions 3800–12000 cm−1 (a), 2000–2200 cm−1 (b), and 1120–1260 cm−1 (c), of Py and DCB dissolved in ACN (5.0 and 5.0 mM, respectively) excited at 355 nm with Ar bubbling. Each time-resolved spectrum is offset by 2 × 10⁻⁴ for clarity of display. Right: Time profiles at 11000 (d), 6800 (e), 2100 (f), 1216 (g), and 1136 (h) cm−1. The smooth black curves are the result of the kinetic analysis based on the reaction mechanism shown in Scheme III–1.
The TRNIR/MIR spectra recorded at the higher concentrations of Py and DCB (Figure
11000 6800 2100 1216 1136 (a) (b) (c) 0.0 0.4 0.8 1.2 1.6 2.0 Δ Absorbance (10 –3) Wavenumber(cm–1) 0–5 μs 5–10 μs 10–15 μs 15–20 μs 20–25 μs 25–50 μs 50–75 μs 75–100 μs 100–150 μs 150–200 μs 200–225 μs Δ Absorbance (10 –4) 11000 cm-1 6800 cm-1 2100 cm-1 1216 cm-1 1136 cm-1 (d) (e) (f) (g) (h) 0 1 2 0 2 4 0 1 2 0 1 2 0 1 0 50 100 150 200 Delay time (μs) 12000 10000 8000 6000 4000 2200 2100 2000 1250 1200 1150
concentrations (Figure III–2). However, there are appreciable differences in terms of band intensity and shape. The intensity ratio of the 2100 cm−1 band to the 1216, 1136, and 11000 cm−1 bands increases compared to the lower Py-concentration experiment. This increase could be due to the increase in the concentration of Py2•+ relative to ACN2–. In addition, the NIR transient at ~7000 cm−1 exhibits two peaks at ~7400 and ~6000 cm−1. This change in the band shape of the electronic band of Py2•+ could be due to the occurrence of a side reaction that is not taken into account in Scheme III–1. The concentration dependence is more evident in the kinetic behavior of the transients (Figure III–6 d, e, f, g and h). The 6800 cm−1 band (Figure III–6e) shows a slower rise compared with the other transients (Figure III–6 d, f, g and h) at the higher Py concentration than at the lower concentration (Figure III–2e). The synchronous decay seen for the 6800, 1216, and 1136 cm−1 bands at the lower concentration (Figure III–2e, g and h) is no longer observed at the higher concentration (Figure III–6e, g and h). At the higher Py concentration, BET appears to proceed through a different scheme. To confirm this, a global fitting analysis is performed on the kinetic traces of the transients using Scheme III– 1. The reaction scheme is found to fail to reproduce the experimental data, strongly suggesting that a different scheme should apply at the higher Py concentration. The BET reaction mechanism that can account for the TRNIR/MIR spectra at 5.0 mM Py and 5.0 mM DCB needs further investigation.
III-3.6 TRIR Spectra of Py and DCB in Benzene Solution
In the earlier sections, we have shown that the unique ability of ACN to solvate electrons dictates the BET dynamics between Py and DCB. It would be natural to expect that the entire picture would be changed drastically in different solvents. To show that this is really the case, we measured TRIR spectra of Py and DCB in benzene (Figure III–7).