J . Fluid Meeh. (lggl), vol. 233, p p . 2ti5298 Printed i n Great Britain
265
Vortex shedding from an impulsively started
rotating and translating circular cylinder
By
CHIEN-CHENG CHANG
A N DRUEY-LING CHERN
Tnstitute of Applied Mechanics, College of Engineering, National Taiwan University, Taipei 10764, Taiwan, R.O.C.
(Received 1 September 1989 and in revised form 5 July 1991)
A numerical study is made of the flow past an impulsively started rotating and translating circular cylinder using a hybrid vortex method. The Reynolds number (Re) ranges from lo3 to lo6 while the (counter-rotating) rotating-to-translating speed ratio (a) is increased from 0 to 2. It is found that three basic patterns of vortex shedding can be identified according to the behaviour of the stagnation points associated with the first upper and the first lower vortices. Depending on the parameters Re and a, the rotation may favour the shedding of the first upper vortex, or the first lower vortex (typically a t high Reynolds numbers). I n a transition region, strong competition for shedding exists between the first two vortices in the form of double transposition of stagnation (closure) points associated with the two vortices. Time variations of lift coefficients characterize different shedding patterns ; the cylinder may first experience a substantial maximal downward lift when the first shedding vortex is from the upper wake, or a maximal upward lift otherwise.
1.
Introduction
There has been a continuing interest in the study of flow past a circular cylinder. The complicated unsteady flow patterns near the cylinder are representative of many phenomena that occur in fluid dynamics. The flow has been investigated by many researchers employing asymptotic analysis, finite-difference methods and flow visualization experiments. Each of these studies concerns a certain range of Reynolds numbers (Re) a t various rotating-to-translating speed ratios (a) (cf. figure 1) since the flow may vary significantly depending on these parameters. Asymptotic results are usually valid only at small times, e.g. Wang (1967) and Bar-Lev & Yang (1975), while numerical works are mostly limited either to flows at low Reynolds numbers or to flows at small speed ratios, e.g. Ingham (1983) and Townsend (1980). Experimental work on flows at moderately high Reynolds numbers seem to be fragmentary; there appears to be a lack of detailed information concerning the nature of the wake. A fairly full account of the influence of rotation for flows a t Reynolds numbers Re = 200, 500 is given in Badr & Dennis (1985) and Coutanceau & Mdnard ( 1 9 8 5 ~ ) . Badr et al. (1990) have recently extended their work to include some cases a t Re = 1000 and lo4.
The present study by a hybrid vortex method is to investigate how the vortex shedding is influenced by the rotation of a circular cylinder (0
<
a<
2 ) in a range of higher Reynolds numbers (lo3 <Re<
lo6). The flows are assumed to be two- dimensional throughout our investigation. Numerical results are presented for the lift ; drag and moment coefficients ; surface vorticity, and surface and spatial pressure distributions ; and instantaneous streamlines a t different times. Observations of266 C . 4 . Chaw and R.-L. Chern Y*
t
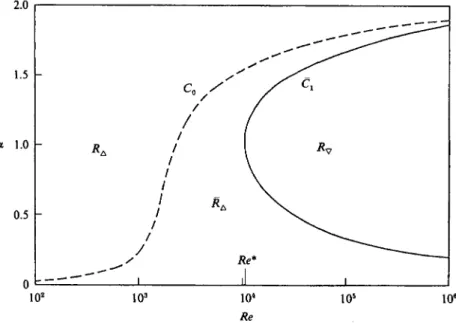
2.0 1.5 a 1.0 0.5 0 c x*FIGURE 1. Schematic of the physical problem. Re = ZUa/v, a = Ba/U.
1 o2 103 10' 105 1 O6
Re
FIGURE 2. Three basic regions of vortex shedding behind the cylinder.
streamline patterns are based on a frame translating with the cylinder. The hybrid vortex method consists of solving a Poisson's equation for the stream function, and solving the viscous vorticity transport equation by interlacing a finite-difference method for viscous diffusion and a vortex-in-cell algorithm for convection. Note that the present method, which is based on a stream function-vorticity formulation, is completely deterministic in contrast to the previously developed stochastic methods. We refer to Sarpkaya (1989) for an extensive review of methods of this kind under the general heading ' computational methods with vortices '.
Vortex shedding from a circular cylinder 267 vortex structures in the near wake, and the forces and the moment exerted on the cylinder. In the present study, the lift and the drag coefficients are carefully computed with three approaches. First, we evaluate the force coefficients in terms of the surface vorticity and its normal derivative. The second approach employs, for each azimuthal angle, the surface pressure which is obtained by integrating the momentum equation radially from infinity to the cylinder surface. Furthermore, we investigate the approach of computing the force coefficients introduced by Quartapelle & Napolitano (1983) who utilized harmonic functions to transform integrals of pressure into those in terms of flow quantities. It is noted that the second and third approaches do not require evaluating vorticity gradients on the cylinder surface. Careful comparisons show, a t small times, close agreement between Badr & Dennis’s (1985) analytical results and those computed with the latter two approaches for the lift and the drag coefficients. By a vortex we mean a recirculating fluid cell in the (near) wake behind the cylinder. In order to study the detailed flow structures, we investigate the behaviour of the stagnation points in the flow, as done by Coutanceau & MBnard ( 1 9 8 5 ~ ) . Three types of stagnation points can be classified in a typical flow according to their natures, as illustrated in figure 1. One stagnation point
(S)
is always formed near the front of the cylinder. In the near wake stagnation points are created, which may then disappear after a while. These stagnation points usually appear in pairs and can be identified as centres (0) or closure points(C)
of vortices. The streamline pattern near a front stagnation or a closure point is typically of non-orthogonal saddle-point configuration. It is found that the initial vortex shedding is determined by the parameters Re and a in a manner as shown in figure2. The diagram consists of three regions, denoted by R,,
R,
and R , respectively; these regions are separated by the curvesC,
andC,.
RegionR,
represents the rotation favouring the shedding of the first upper vortex. Previous observations by Badr & Dennis (1985) and Coutanceau & MBnard ( 1 9 8 5 ~ ) fall into this region. An exchange of closure points occurs between the first lower and the second upper vortices, which has been termed by Coutanceau & MBnard the phenomenon of single transposition. In region R,, the rotation favours the shedding of the first lower vortex. The single transposition phenomenon is found to exist between the first lower and the first upper vortices. Between these two regions, there exists regionR,
where the rotation favours the shedding of the first upper vortex. The shedding, however, involves a process that twice exchanges the closure points between the first upper and the first lower vortices. This double exchange of closure points is hereafter called the phenomenon of double transposition. Time variations of lift coefficients are found to be clearly related to different shedding behaviour; the cylinder may first experience a substantial maximal downward lift if the vortex to be shed first is from the upper wake, or a maximal upward lift if a lower vortex is to be shed first. The main body of the paper is devoted to the detailed numerical results that further our understanding about the nature of different shedding patterns and their relation to the time variations of the lift, drag and moment coefficients. Selected comparisons of the present and previous numerical and experimental results of Badr et al. (1990) show close agreement in streamline patterns and velocity profiles.2.
Basic equations
Consider a fluid of density p and constant kinematic viscosity v. The flow past a circular cylinder is governed by the NavierStokes and the continuity equations. Some flow parameters are shown in figure 1. Let the reference length and velocity be
268 C . 4 . Chang and K . - L . C'hern
the cylinder radius ( a ) and the speed of the distant flow ( U ) rcspectively. I n dimensionless form, these equations may be written
aulat
+
(u
.
V)
u = -VP
+
2Re-IV2u,v.u
= 0,where u denotes the velocity and P the pressure, and Re = 2Ua/v is the Reynolds
number. The rotating-to-translating speed ratio is related t o the angular rotating speed SZ of the cylinder by cr=Qa/lJ. The dimensional velocity u*, time t* and pressure P* are given by
u* = ~ J u , t* = at/U, P* = p V P . (3) For the present study, it is convenient to work on a stream function-vorticity formulation. By introducing an appropriate stream function
$
and the vorticity function w =V
X U , we may recast equations ( 1 ) and ( 2 ) asV2$ = - w (4)
and
ao/a
t ( u sV)
o = 2BeP'V2w, (5)where w = w k . Rcfer the motion to a polar coordinate system ( r , 0) ; the cylinder surface is at r = 1 and the coordinate ( 1 , O ) coincides with the rear stagnation point of the corresponding potential flow.
Let t = 0 define the start of the motion ; the initial condition a t t = 0
+
consists of the potential flow and a vorticity sheet a t the cylinder surface. The boundary conditions for (4) are that, for t>
0$ = O for r = 1,
-a$/ar+-sintl as r+m, (66)
while the boundary conditions for (5) are that, for t
>
0u-eH=cc
for r = 1,o + O as r+m.
The velocity u is related to the stream function $ through
where er and e, are the unit vectors along the radial and azimuthal directions respectively.
Let 1, and
D
denote the lift and drag exerted on the cylinder per unit length whileM denotes the frictional moment. Let ,u he the dynamic viscosity. The lift, drag and moment coefficients are thcn defined respectively by
Each of the drag and lift coefficients can also be written as C, = G D P + C D F , C, = C L P + C L F ; C,, and C,, are due to pressure while
C',,
and C,, are due to friction. Let 8, denote the cylinder surface of unit lcngth. The force coefficients are then given byVortex shedding from a circular cylinder 269 where n is the unit vector directed toward the cylinder. Typically, one evaluates these coefficients in terms of the surface vorticity and its normal derivative. Indeed, it can be shown that
C L = - $ [ g - w ) 1-1 cos8dB.
The first term in each of these integrands is due to pressure; the other is due to friction. These formulae can be easily derived by rewriting (1) in the form
and applying it to (10) along the cylinder surface, with some manipulations. We may also compute directly the surface pressure which is substituted in (10) to evaluate the force coefficients. In the present study, the pressure distribution is obtained by integrating the r-component of (12) by prescribing the value of P a t
co
to be 0,where u =
u(r,
8). To exhibit the accuracy and maximize the usefulness of the numerical solution, we further compute the force coefficients by another approach proposed by Quartapelle & Napolitano (1983). By taking inner products on both sides of (12) with appropriate harmonic functionsvi
andrj,
one may show thatwhere
I'
denotes the flow region. For (14a, b) to hold, it is adequate to takevi
= cos 8 / r andvj
= sin 8 / r . Notice that the first integral in each of ( 1 4 4 and (14b) is invariant under the reversal of the sign of the velocity u. The integrands inside the second integrals of (14a) and (14b) become, in terms of the polar coordinates, respectivelywhere wo denotes the surface vorticity. Each of these is contributed equally by the pressure and friction. The (frictional) moment coefficient is simply given by
- 20, sin 8 and 2w0 cos 8, (15)
CM =
&l
(w0-2a)d8.We now have three approaches for computing the force coefficients (due to pressure). They are hereafter denoted approach S ( l l a , b ) , approach P (10) based on (13), and approach V (14a, b). From the numerical point of view, V could be preferable to S in some aspects as explained below. In a rapidly changing flow, the vorticity has in general a fairly large gradient near the cylinder. In a stream function-vorticity formulation, the gradient is not obtained directly from the numerical solution but
270
(2.4.
Chang and R.-L. Chernthrough interpolation ; the error inherent in it is therefore inevitably large which makes the interpolation not very reliable. Indeed, as we shall see, numerical results in $4 indicate that V and also P are much better than S, especially in the early stages of flow development.
3. The hybrid vortex method
The present vortex method for incompressible viscous flow can be abbreviated as follows. The vorticity field is approximated by a sum of ‘blob ’ functions - called
vortex blobs or simply vortices. Each vortex evolves in a Lagrangian manner carrying with itself a circulation determined from the vorticity. The vorticity is obtaincd by solving the vorticity diffusion equation on a grid by a finite-difference method. The circulations are then redistributed and converted back to the vorticity on the grid, which is thus updated. At the beginning of each time step there are only vortices centred a t mesh points. Therefore, first, we approximate the vorticity field (17) where L is the number of vortices (or mesh points) andfj(r) is the blob function.
rj
and rj are respectively the circulation and the position associated with the j t h vortex blob. In practice, the function fi(r) is conveniently taken to be an indicator function so that the vorticity is constant over the indicator set chosen, outside which the blob function is zero. Highly accurate blob functions may be available in the form of combinations of some elementary functions; see, for example, Hald (1979) and Beale & Majda (1985).Next we describe the polar coordinates ( r ’ , 0) adopted by Smith & Stansby (1988) in their work on random vortex contents. This was introduced for the solution of the Poisson equation (4) and for the creation of vorticity along the cylinder surface. For the present purpose, the coordinate system is also used to solve the vorticity diffusion equation in order to take into account the effect of viscous diffusion. In terms of the polar coordinates (r’, 19) the Poisson equation (4) may be written
L by
4,
r) =x
q f j ( r - q , j-1 where a ( / ) = (vdr’/dr)z, b(r’) = rdr’/dr+ r2 d2r‘/dr2, (1% b ) r=
c(v’) = B(eA”- 1)+ 1. (194 For each time increment, (18) is solved on a mesh with a uniform mesh size in the coordinate system (r‘, O ) , defined over an annular region outside the cylinder surface (1<
r<
ro). Fine resolution is required near the surface of the cylinder. The constants A , B in (19c) are fixed by the radial mesh spacing at the cylinder surface, and by the value of the outer radius (ro). The value of ro must be sufficiently large for (76) to be an adequate approximation and for all the vortices to be contained within the mesh.Denote by (i,j) the node of the grid; r‘ = j and I9 = iAO(AI9 = 2n/p, 0
<
j
<
q- 1). Let $(i,j) be the nodal value of the stream function a t (i,j). In actual computation, (18) is solved by a central finite difference in r’ with the help of Fourier collocation for the second derivative in 8. This yields a set of p tridiagonal equations, which can be solved efficiently by Gaussian elimination. Once (18) is solved, the stream functionVortex shedding from a circular cylinder 27 1 is used to update the vorticity on the boundary so that the no-slip condition is satisfied. Notice that along the boundary, (18) reduces to
Imagine that the stream function can be extended across the cylinder surface to possess meaningful values
$(i, -
1). Then, a t least to a first-order approximation,so that the tangential velocity along the cylinder surface is zero. Hence, a central finite difference applied to (20) gives the surface vorticity
The value of
o(i,
0) can actually be evaluated more accurately by interpolating the stream function using three or more radial mesh values near to the surface of the cylinder, followed by differentiation. With the solution of (18) and the boundary vorticity w ( i , O ) in (22), each vortex on the grid is convected by the velocity determined from (8) while the associated vorticity evolves according to the diffusion equation(23) The circulation carried by each vortex is then distributed between the four corner nodes of the cell in which the vortex is contained. The area-weighting scheme suggested by Christiansen (1973) is used. Let
r(i,j)
be the total circulation associated with the node ( i , j ) ; the nodal value of w is given byThe redistribution of circulation with (24) completes a cycle of computation a t each time step. The present hybrid vortex method therefore, at each time step, consists of solving the (4) and ( 5 ) as follows:
(i) equation (18) is solved on the grid ; the solution is used to update the vorticity on the cylinder surface to satisfy the no-slip condition ;
(ii) equation (23) is solved on the grid by a finite difference; the circulation associated with each vortex on the grid is then evaluated according to the formula (iii) each vortex on the grid along with the associated circulation is convected with the velocity determined by (8) using the values of the stream function obtained in (i) ;
(iv) redistribute all the circulations; add a t each mesh point the contributed circulations and convert the result into vorticity, according to (24). The current vortices are then discarded while a new set of vortices are regenerated on the grid. Go back to (i).
The above numerical procedure is a method of viscous splitting, and is first-order accurate in time. The time accuracy can be improved by adopting a midpoint rule for evaluating the velocities of the vortices on the grid. One way of achieving this is to calculate the velocity using the average of the current vorticity and a predicted vorticity for the next time step. This modified method is conceived to be second- order in time, and is actually used in computation. We refer to Beale & Majda (1981) for some validation of the splitting scheme. It is further noticed that the area- (24) ;
272 C . 4 . Chung and R.-L. Chern
weighting scheme is a mild source of numerical diffusion, even though its effect becomes smaller as the meshing becomes finer. The accuracy of the numerical method will be assessed in the next section.
4. Numerical results and discussion
The purpose of the section is three-fold: to present some fundamental shedding processes; to validate the numerical results; and to assess the force formulae - approaches S,
P
andV
- proposed in $2. Consideration is concentrated on 0c
a<
2in a wide range of Reynolds numbers betwcen 1000 and lo6 ; this includes Re = 1000, 3000, 9500, 20000, lo5 and lo6. Basically, we terminate the calculation in each case of study once the pattern of initial vortex shedding may be identified.
The radial spacing next to the cylinder surface is taken to be the standard deviation of viscous diffusion over one time step. Grid dependence has been checked against the time step for the drag coefficients (figure 15) and streamline patterns (figure 10) ; it is found that the grid p x q = 128 x 200 with the time step At = 0.02 and ro = 25 is satisfactory for
Re
<
20000 but is only adequate for Re = lo5 and los within much limited time intervals. Validity of the present grid system for initial resolution is also confirmed in $4.4 by comparisons with Badr & Dennis’s analytical results for the lift and drag coefficients a t small times (figure 14). Comparisons of the streamline patterns (figures 11, 12) and velocity profiles (figure 13) for some selected cases a t Re = 1000 are made with previous numerical and experimental flow visualization results of Badr et al. (1990). Each cycle of computation from (i) to (iv) takes nearly 2.5CPU seconds on a Convex Cl/XP Machine with the grid p x q = 128x200.4.1. Vortex shedding
I n order to get insight into the detailed flow structures, we first examine the streamline patterns for each Reynolds number individually. Results are, however, shown only for some selected cases of fundamental interest. Note that the observed streamlines are based on the frame translating with the cylinder but not rotating with it. According to the shedding order, the vortices to be shed are denoted consecutively by E,, E,, E,, and so on. Intermediate vortices related to the formation of El, E,,
...
are denoted by E;, EY, Ek,Ei,
...
consecutively. Here the phrase ‘shed- ding’ is used somewhat loosely to describe the behaviour of detachment of a vortex from the cylinder; more precise definitions related to the shedding behaviour are attempted in $4.6.4.1.1.
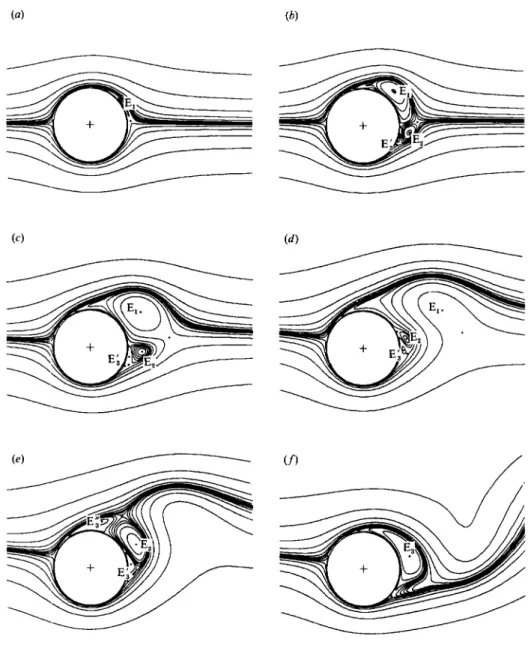
Re
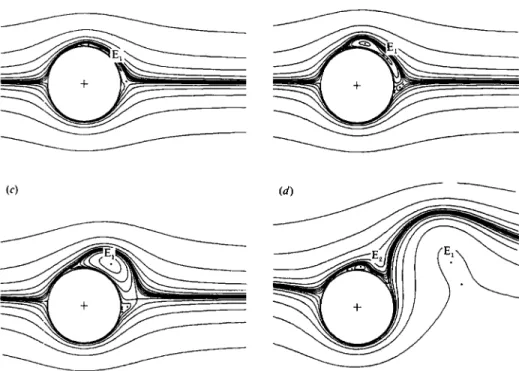
= 1000, a = 0.5Figure 3 (a) shows the existence of El and a bulge phenomenon of streamlines near the right lower side of the cylinder. Figure 3 ( b ) shows that the vortex E, grows gradually in the upper wake while the bulge leads to the formation of the vortex E,. The same plot shows that the intermediate vortex Ei has made its appearance next to the cylinder in the lower wake before t = 3. Figure 3 ( b , c) indicates that E, is disengaging from the cylinder. Figures 3(c, d ) shows that between t = 7 and 8 the flow structure in the near wake changes rapidly. During that period, the upper free stream curves downward somewhat while E, grows upward rapidly. The process leads to the formation of the intermediate vortex E: before t = 8, which marks the complete detachment of E, from the cylinder. Figure 3 ( d , e ) indicates that E, and Ei exchange their closure points shortly after t = 8. This is the phenomenon of single transposition of closure points observed previously by Coutanceau & MQnard (1985a)
Vortex shedding from u circular cylinder 273
FIGURE 3. Patterns of instantaneous streamlines for Re = 1000, a = 0.5: (a) t = 1, ( b ) 3, (c) 7,
(4
8, (4 9,(f)
12.and Badr & Dennis (1985) a t Re = 200,500 (a = 0 . 5 , l ) . Notice that Ek has existed in the lower wake in the form of an isolated vortex (confined by E2). Figure 3 ( e ,
f)
shows that E, is disengaging itself from the cylinder while E; andEi
arc coalescing to form the shedding vortex E,. Figure 3 (f) shows that E, is about to be completely detached from the cylinder a t t = 12. The alternate shedding of El, E, and later vortices thus forms the B&nard-K&mh vortex street in the wake region.4.1.2. Re = 3000, CL = 1, 1.5
We first consider the case a = 1. Figure 4(a) shows the existence of E, and a bulge phenomenon which will lead to the formation of the vortex E, in the lower wake. Figure 4(b) shows the growth of El and E, and the emergence of the intermediate
274 (2.4. Chang and R.-L. Chern
FIGURE 4. Patterns of instantaneous streamlines for Re = 3000, a = 1 : (a) t = 1, ( b ) 3, (c) 5,
(4 7, (e) 8, (f) 12.
vortex E; next to the cylinder in the lower wake. It is interesting to observe that the lower vortex E, gains the closure point of El (at about t = 2) in the manner of single transposition. Furthermore, at t = 3 vortex E, in the lower wake is on its way to disengaging from the cylinder. From that time, E, competes for its ‘lost’ closure point and finally gains it back from E, at about t = 4.5 (cf. figure 4b, c). There is therefore, again, an exchange of the closure points between the same pair of vortices El and E,. This is the phenomenon which we have called double transposition of closure points, and which is clearly a sign of keen competition for shedding in the near wake. Comparison of figures 4 (c) and 4 ( d ) shows that E, shrinks in size as E, sets out downstream. Figure 4 ( d , e ) shows that between t = 7 and 8, the upper free stream curves downward somewhat while E, grows upward rapidly to join the upper free
Vortex shedding from a circular cylinder 275
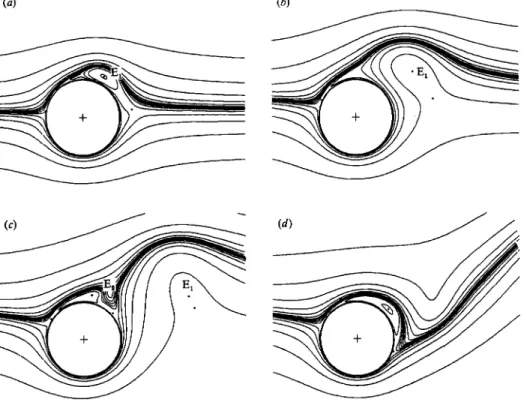
FIQURE 5. Patterns of instantaneous streamlines for Re = 3000, a = 1.5: (a) t = 3, ( b ) 6, (c) 8,
(a)
12.stream. During the process, the intermediate vortex
Ei
makes its appearance and exchanges closure points with E,. This is exactly the same behaviour of single transposition observed in the preceding case of Re = 1000, a = 0.5. Comparing figures 3(e,f) to 4(e,f) shows that El and E, follow very much the same procedure of detachment from the cylinder in both cases.Next we consider the case a = 1.5. Figure 5(a, b ) shows that the vortex El grows with time next to the cylinder while a sizable bulge of streamlines near the right lower side of the cylinder does not lead to formation of vortices in the lower wake. The bulge is getting weaker as El sets out downstream at about t = 6. Figure 5 ( c )
shows that the upper free stream curves downward, leading to the formation of an isolated vortex above the top of the cylinder. The curved streamlines signify the existence of E,, which grows gradually, disengaging itself from the cylinder. Figure
5 ( d ) shows that by t = 12, both E, and E, have been shed. Note that the formation of E, has little contribution from the lower wake. The BBnard-KBrm6n vortex structure in the wake is completely due to the flow activity in the upper wake. The present flow has therefore the distinguishing feature that vortices in the lower wake are completely inhibited (during the period of observation), which, however, does not necessarily imply the deterioration of the BBnard-KarmBn vortex structure in the wake.
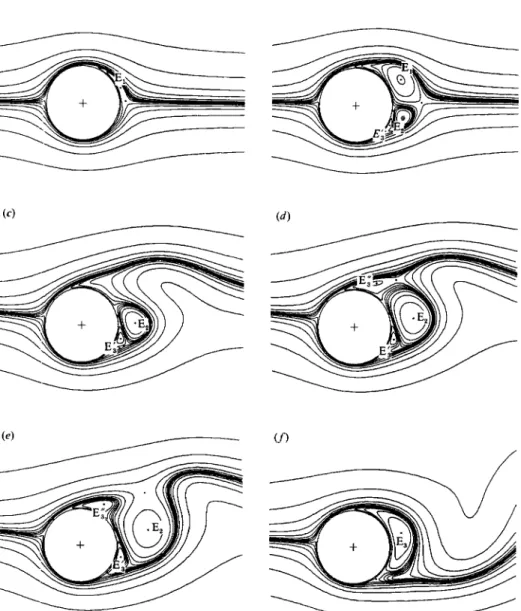
4.1.3. Re = 9500, a = 1
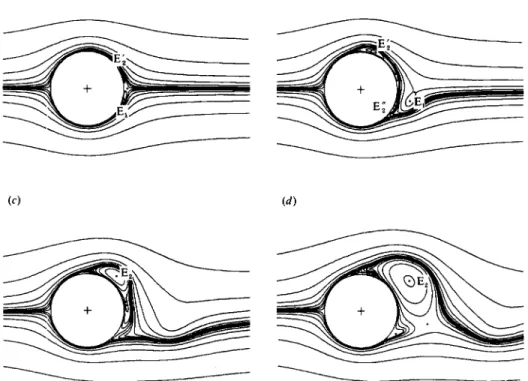
Figure 6 ( a ) shows the existence of the first upper vortex, the vortex E,, and a small nearby vortex in the lower wake. Figure 6 (b, c ) shows that the first upper vortex (Ei) is assimilating a lower vortex (E;) to form the primary vortex El. The same figures
276 (7.4’. Ghang and R.-L. Ghern
FIQIJRE 6. Patterns of instantaneous streamlines for Re = 9500, a = 1 : (a) t = 2, ( b ) 3, (c) 5 ,
(4
7, (el 9,(f)
12.also show that
E,
gains the closure point of E, by single transposition and then disengages from the cylinder. In the meantime, the vortex E, in the upper wake grows rapidly and has gained back its ‘lost ’ closure point by time t = 7 (cf. figure 6 d ) . We therefore see another case of double transposition. Figure 6 ( e , f) shows that between t = 9 and 12, E, grows rapidly and joins the upper free stream, being accompanied by a single transposition of closure points. At about t = 9.5, El is completely detached from the cylinder. Figure 6(f)
shows that E, is on its way to be detached from the cylinder, while Ei in the lower wake and E; in the upper wake are coalescing to form the shedding vortex E,. The case is a special one for which we have the intermediate existence of E; and E; before the first shedding vortex El. E; which, otherwise, acts like Ej of the case Re = 3000, a = 1, is isolated by E, until the latterVortex shedding from a circular cylinder 277
FIQURE 7. Patterns of instantaneous streamlines for Re = 20000, a = 1 : (a) t = 1, ( b ) 3, (c) 6,
(4
7,(4
10,(f)
12.is detached from the cylinder. Furthermore, note that the vortex structures in the upper wake in figure 6(a, b) are the typical P-phenomenon (or forewake), identified by Bouard & Coutanceau (1980) in the non-rotating case (a = 0). A similar phenomenon is not present in the lower wake. Figure 6 ( d ) shows a primary vortex with two small counter-rotating vortices a t its northwestern corner, which is typical of the a-phenomenon, also identified by Bouard & Coutanceau (1980).
4.1.4.
Re = 20000, a = 1, 1.5We first consider the case 01 = 1. Figure 7 ( a , b ) shows that the lower primary
vortex (formed before t = 2) rapidly gains the closure point of the first upper vortex by single transposition. Notice again that the upper wake in figure 7 ( b ) is a typical P-phenomenon. A similar phenomenon is not found in the lower wake. Figure 7 (b, c)
278 (7.4. Chang and R.-L. Chern
FIGURE 8. Patterns of instantaneous streamlines for Re = 20000. a = 1.5: ( a ) t = 2, (6) 4, ( c ) 6,
( d ) 10.
shows that the primary vortex in the upper wake has assimilated a small vortex next to the cylinder in the lower wake by t = 6, and that the primary vortex in the lower wake disengages quickly from the cylinder and is seen to be detached from the cylinder well before t = 6. It follows that the first vortex to be shed is the first lower vortex, El, rather than the first upper vortex, Ei; the latter assimilates a lower vortex
Ei.
Contrary to the previous cases, figure 7(c, d ) shows that E, grows downward rapidly to join the lower free stream, leading to the formation of E, accompanied by a single transposition. Figure 7 ( e ) shows that E, is well detached from the cylinder by t = 10. Figure 7 ( d , e ) shows further that E, takes the alternative, joining the upper stream by single transposition. The BBnard-Karmdn vortex structure thus formed is of opposite sense to the preceding cases. Figure 7 ( e ,f)
shows that the vortex E, disengages from the cylinder while two vortices next to the cylinder are merging with each other.
Next we consider the case a = 1.5. Figure 8 ( a d ) shows a double transposition of closure points, occurring between the first upper and the first lower vortices. The vortex E, (in the upper wake) is almost detached from the cylinder a t t = 10. The first lower vortex makes little contribution to the BBnard-Karman structure ; vortices in the lower wake are substantially weaker though not completely inhibited (during the period of observation). The formation of E, is quite similar to the corresponding vortex in the case Re = 3000, a = 1.5, being completely due to the downward curving of the upper free stream. Further plots of streamlines show that for a = 0.5 the first shedding vortex is also from the upper wake. Therefore there must be a value of a between 0.5 and 1 across which the shedding order for the first upper vortex and the first lower one is reversed ; another such value should come between 1 and 1.5. The
Vortex shedding from a circular cylinder 279
FIGURE 9. Patterns of instantaneous streamlines for Re = lo5, a = 1 : (a) t = 2, ( 0 ) 4, ( c ) 6, ( d ) 8. phenomenon of double transposition for a = 1.5 is rather delicate in that the first lower vortex is so weak that the corresponding streamlines are even straightening out a t t = 10. We have checked the grid dependence for this case against the numerical far-field boundary (and therefore the distribution of mesh points). The two sets of plots of streamlines for ro = 25 and ro = 36 (not shown) show very close agreement in the sizes of vortices and locations of various stagnation points. 4.1.5. R e = lo5, a = 1
This is another case in which the rotation of the cylinder favours the shedding of the first vortex in the lower wake. Figure 9 ( a ) shows a narrow and slender vortex in the upper wake which forms along the right upper side of the cylinder. On the other hand, the lower vortex El is substantially wider in shape and much closer to the horizontal axis through the cylinder centre. Figure 9 ( a , b ) shows that between t = 2 and 4, El in the lower wake gains the closure point of E, by single transposition. Figure 9 ( b , c ) shows that E, sets out rapidly downstream and is well detached from the cylinder by about t = 5. In the meantime, the slender vortex (which turns out to be E;1) is assimilating a small vortex
(Eg)
in the lower wake to form E,. Comparison of figures 7(c, d ) and 9 ( c , d ) indicates that E, follows the same procedure of detachment as that of E, in the case R e = 20000, a = 1.4.1.6. R e = lo6, a = 0.5
In this case, the physical phenomena are presented along with a comparative study of grid dependence on the time step. Figure 10(a, b ) shows that the first lower vortex E, gains the closure point of the primary vortex in the upper wake, then disengaging quickly from the cylinder. The upper wake in figure 10 (b) is clearly a
p-
280 C.-C. Chaw and R.-L. Chern (4
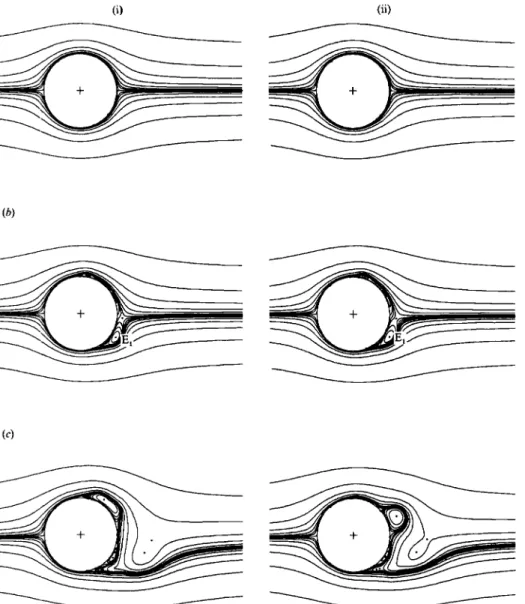
(ii)
FIGURE 10. Patterns of instantaneous streamlines for Re = los, OL = 0.5: (a) t = 2, ( b ) 4, ( c ) 6; (i) At = 0.02; (ii) At = 0.01.
phenomenon. Figure 10 (c) shows a plot of streamlines at t = 6. No further discussion will be continued on the physical process from t = 4 since grid dependence against the time step shows significantly different pictures of streamline patterns. Figure lO(a(ii)-c(ii)) shows plots with At = 0.01 a t the same times. Satisfactory agreement is found a t t = 2 and 4, while significantly different flow pictures are present a t t = 6. Therefore the present grid and time steps are not sufficient to resolve the flow behaviour after t = 4. It is probable that the flow soon varies violently or even turbulently in the two-dimensional sense, denying accurate analysis by the present approach with insufficient mesh points.
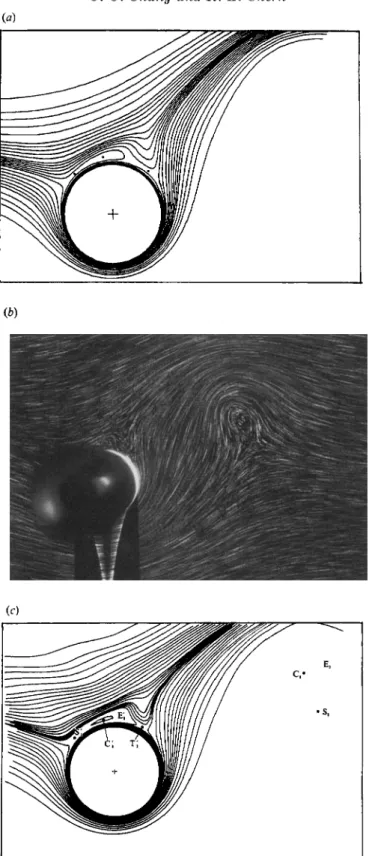
To demonstrate the validity of the present numerical results, streamline patterns and velocity profiles are compared to those obtained by Badr et al. (1990) for some selected cases. Figures 11 and 12 show quite good agreement between these results
Vortex shedding from a circular cylinder
I
281~
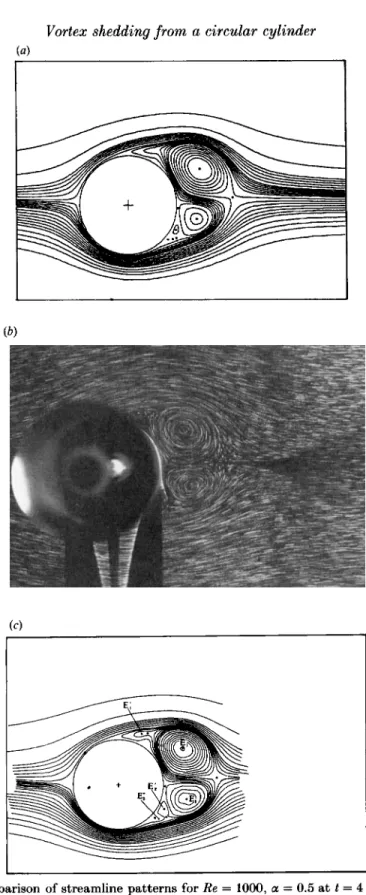
FIGURE 11. Comparison of streamline patterns for Re = 1000, a = 0.5 at t = 4: (a) present plot,
282 C.-C. Chang and R.-L. Chern (0) 7 C,' -=T7 E,
.
s.FIGURE 12. Comparison of streamline patterns for Re = 1000, a = 2 at t = 10: (a) present plot, (6) flow visualization experiment in Badr et al. (1990), (c) numerical result in Badr et al. (1990).
Vortex shedding from a circular cylinder 283
- - _ _ _
1 ; ... I I I , ,.... .\
. . . I . . . . .-
!
\.:
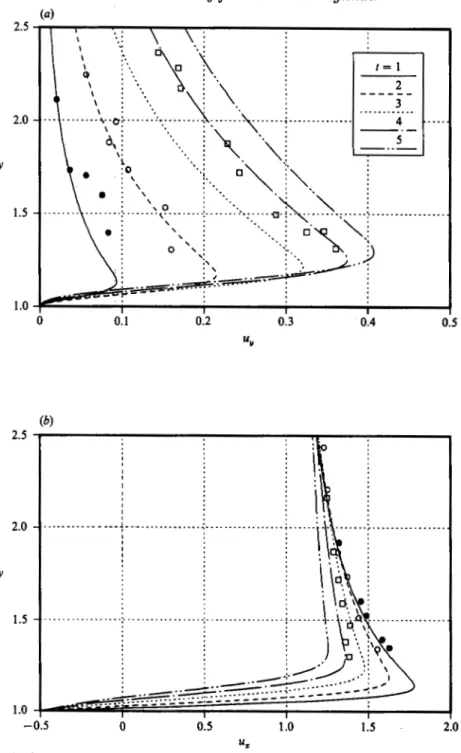
. ..,...._... -0.5 0 0.5 1 .o 1.5 2.0 u,FIGURE 13. Comparison of velocity profiles for Re = 1o00, a = 0.5: (a) uY vemus y at 0 = @,
(b) U, versus at 8 =
4%.
Experimental points taken from Badr et al. (1990) : 0 , t = 1 ; 0 , 2 ;0 , 4.
in the near-wake structures, while figure 13 (a, b) shows good agreement between the velocity profiles along the azimuthal angle 0 =
in. It
is noted that in order to have close comparison between the streamline patterns, the values of the stream functions in figures 11 (a) and 12 (a) are different from those for the previous plots. Comparisons in figure 13(a, b) are made only with the experimental data; we notice that the284 (7.4. Chang and R.-L. Chern
agreement is much better if comparisons are made with the numerical data of Badr et al. (1990).
4.2. Shedding order
Now we explain the different shedding patterns. Owing to the relative motion, the flow past the upper part of the cylinder can be thought of as having a larger effective Reynolds number than the flow past the lower side. It is therefore true that the vorticity shed from the upper part of the cylinder is stronger than that shed from the lower side right after the flow is started. Naturally, one expects that the first vortex to be shed will be the first upper one, which is indeed true for flows at relatively low Reynolds numbers. However, we have seen that the flow topology a t higher Reynolds numbers is significantly different from that a t lower values. In order to understand the different shedding patterns, it is worth classifying the flow patterns in the near wake.
The patterns of vortices are found to be basically the same as those in the non- rotating case. They may be isolated vortices forming after a bulge phenomenon, or form the a-phenomenon or the P-phenomenon (forewake), as classified by Bouard & Coutanceau (1980). All of these patterns have been identified in different cases in 54.1. Here we are particularly interested in the forewake behaviour which may serve to account for the first shedding coming from the lower wake. It is noticed that a stronger forewake implies the P-phenomenon occuring a t a higher position away from the horizontal axis through the cylinder centre. When there is a strong forewake in the upper wake, the primary vortex in the lower wake is then relatively closer to the horizontal axis, being in a better position to disengage itself from the cylinder. This strong asymmetry in facilitating shedding of the lower vortex is most conspicuous for moderate values of a a t high Reynolds numbers.
The first vortex shed cannot be from the lower wake for a sufficiently close to 2 as the appearance of the lower vortex is substantially inhibited (at least in initial periods). The deterioration of vortices in the lower wake has also been confirmed by Diaz et al. (1983) and Calamote (1984) among others, for various cases. At relatively low Reynolds numbers, the upper vortex is never too far away from the horizontal axis to be the first vortex shed away from the cylinder. When the forewake behaviour is clear but not significant, we have a region of transition where strong competition for shedding exists between the first two vortices in the form of double transposition (of closure points).
Returning to the diagram in figure 2, we can associatc the cases discussed above with particular regions. In region R,: (Re,a) = (1000,0.5), (3000,1.5); in R,: (3000, l ) , (9500, l ) , (20000, 1.5); and in R,: (20000, l ) , (lo5, l ) , (106,0.5). Also, the previous observations of Badr & Dennis (1985) and Coutanceau & MBnard ( 1 9 8 5 ~ ) fall into the region R , that favours the upper shedding. Furthermore, it has to be emphasized that the shedding order for either numerical or experimental dis- turbances in a region of transition may become somewhat blurred; the following section is devoted to examining this matter.
4.3. Remarks on shedding patterns
Further remarks can now be made concerning the nature of the diagram in figure 2. The study has been extended to include a = 0.2,0.7 for each Reynolds number under consideration in order to locate the two curves C, and
c,
more precisely. The critical Reynolds number Re* is conceived to be near 10000, above which the P-phenomenon is significant. According to figure 2, for a given a , the shedding order of the first upper and lower vortices is reversed as the Reynolds number is increasing across the curveVortex shedding from a circular cylinder
(4
,.-;--,
, I
- 3 - ...
i
__________!
....i..
... i.. ..,yy:<+.
285 0 2 4 6 8 10 12 r
(4
I
,y;
cLI,
i ,'J' :I
1 : 1 I I I I 1 0 2 4 6 8 10 12 rFIGURE 14. Comparison of the force coefficients computed with different approaches coefficient, Re = 3000, a = 1, (b) lift coefficient, Re = 3000, a = 1, (c) lift coefficient, Re a = 1.
: (a) drag
= 20000,
286 C . 4 . Chaw and R.-L. Chern
C,,
behind which the shedding of the lower vortex is favoured. Before the order is changed a keen competition for shedding is evident from the existence of the phenomenon of double transposition in the transition region R,.It is important to notice that although there are clear shedding patterns associated with each identified region, the detailed flow behaviour near the transition curve
el
requires further analysis. Recall the case of Re = 9500, a = 1 in which the double transposition is quite like a process of ‘intercepting’ the vortexE,
(byE,) instead of
completely blocking the vortex a t its downstream head. Therefore it would be more useful to consider the curve C, as a narrow region of transitional nature instead of a clear line dividing the two regions R, andR,.
The precise specification of the curve C, also requires further study; however, the trend shown by the curve is reasonably correct according to the available data. Indeed, Coutanceau & MBnard (1985 b ) appear to indicate that the phenomenon of double transposition occurs at the lower Reynolds number Re = 1000 for a = 0.5, while figure 2 indicates that for a = 0.5 the phenomenon is likely for Re>
1500. On the other hand, Badr et al. (1990) do not seem to have identified the phenomenon in their joint numerical and experimental analysis. Owing to the finite accuracy of both numerical and experimental work, it might be reasonable again to consider that C, represents a narrow region of transitional nature.No further analysis has been done to investigate the flow behaviour near a = 0. One important observation is that the phenomenon of double transposition in
R,
is not repeated in later shedding. The single transposition mentioned for R, is only associated with the shedding of the first lower vortex. The type of single transposition in R, associated with the first lower and the second upper vortices is, however, found to exist after the initial shedding in a wide range of Reynolds numbers. Therefore we may conclude that the impulsive start of the cylinder is only sensed by the initial shedding; thereafter a regular flow pattern which varies periodically may be expected.It
is evident that figure 2 can be extended symmetrically to negative values of a about the Re-axis; statements of opposite sense to those made for a>
0 are clearly applicable there. One question of special interest related to the figure 2 is whether or not there is even stronger competition in the form of triple, or further transposition of closure points. The stronger competition was not observed throughout our (even more extensive) investigation, which, however, in no way denies the possibility in other flow motions.4.4. Comparison of lift and drag
Figure 14(u-c) shows comparisons of the drag and the lift coefficients computed with different approaches: analytical and S, P, V approaches with At = 0.01 a t various values of Re and a. Figure 15(a-c) shows the results of grid dependence against the time steps : At = 0.01 and 0.02 for the different numerical approaches. In all the cases, the far-field boundary is set at r, = 25. Let h = (2t/Re)i, then the analytical results are given by
87ct 1 27c
c
---+-D - Re h Re’
C, = -a
These results, which are valid a t small times, were obtained by Badr & Dennis (1985) using the method of truncated series. All these comparisons show that approach S
Vortex shedding from a circular cylinder (a) 287 0 2 4 6 8 10 12 t t
FIQURE 15. Grid dependence checked against the time step for the drag coefficient :
288 C.-C. Chaw and R.-L. Chern
which is sensitive to the time step is much less satisfactory than P and V. Figure 1 4 ( a s ) shows that both P and V yield results in generally good agreement with the analytical results on the drag and lift coefficients at small times. The computed and analytical results show, however, initial discrepancies from t = 0 to about 0.3 in the comparisons of the lift coefficients. In fact, Badr & Dennis's results (25) and (26) imply that it is much more delicate to compute the lift cocfficeint than the drag coefficient since the small initial lift is a consequence of exact cancellation of the leading terms of the orders A-' and Ao in integrating surface vorticity and pressure along the cylinder surface (cf. (10)). On the other hand, the drag coefficeint which has the same order of vorticity is not subject to similar cancellation. This explains why we typically get better initial trends of the drag coefficient rather than the lift coefficient. In order to have smaller initial errors, one may take much smaller time steps, as indicated by the results of grid dependence. Nevertheless, in the present study we are satisfied with
At
= 0.02 (which confines the substantial initial errors to t<
0.3) since the only reason for going to extremely small time steps is for initial accuracy of the lift coefficient.Figure 15(a) shows that the results for Re = 20000 are almost insensitive to the time step. Approaches P and V yield quite close results with either At = 0.01 or 0.02. However, figure 15(b) for Re = lo5 shows substantial differences in the drag coefficients between the results for
At
= 0.01 and 0.02 from t = 7.3. The situation for the lift coefficients is somewhat milder, but clear differences can be observed from an even earlier time, aboutt
= 3.5. Figure 15(c) for Re = los shows greater differences between the results of At = 0.01 and 0.02 from about t = 3.8 though approachesP
and V yield quite close results with the same time step. It is observed that approach S yields quite fluctuating drag coefficients with either At = 0.01 or 0.02, which, however, oscillate well round the results computed with approaches P and V. Recall that a strong dependence on the time step has also been reflected in the plots of streamlines (cf. figure 10c). Flow at higher Reynolds numbers may therefore become turbulent sooner, denying accurate analysis with limited mesh points. We conclude that the time step At = 0.02 with the given mesh ( p x q = 128 x 200) is satisfactory in identifying the initial shedding patterns of the cases under consideration, but becomes less meaningful as the Reynolds number is increasing, in the sense discussed above. In the rest of the paper, our discussions on the lift and the drag coefficients, unless stated explicitly, all refer to results computed with approach V.4.5. Surface vorticity distribution
Flow properties may vary rapidly near the solid boundaries in unsteady viscous flows. It is therefore difficult to have precise details of the flow behaviour near the cylinder surface with the aid of the equations of motion. Nevertheless, it is conceivable that some flow features near the cylinder may be read from the surface vorticity (and the surface pressure) distribution. This is indeed true in the present study; some basic rules seem to be like the following. We consider two cases in details: Re = 3000, a = 1 and Re = 20000, LX = 1. First, we observe that the front stagnation point, whenever very close to the wall, corresponds to a minimum of surface vorticity. The same is true of a closure point. Figure 16a (16b) shows that the position of the minimum between 6 = 120' and 180" is indeed in close agreement with the position of the front stagnation point in figure 4 (a-f) (7 (a-f)) a t different times. In both cases, the position of the minimum moves steadily upstream from
t
= 1 to 7, and then moves back and forth fromt
= 8. The last fact indicates that the front stagnation point does not reach a steady position during the period of observation.Vortex shedding from a circular cylinder 120 80 40 - 40 - 80 - 120 a = 1. 289
Secondly, a minimum in surface vorticity may signify that adjacent fluid has streamlines deflected somewhat away from the cylinder surface (bulge phenomenon). This behaviour is clearly illustrated by contrasting the position of any minimum in figure 16a (16b) and the nearby streamlines shown in figure 4(a-f) (7(a-f)). On the other hand, a maximum in surface vorticity signifies that adjacent fluid has streamlines clustering round the cylinder surface. Figure 16 (a, b) shows that this
290
17.4.
Chaw and R.-L. Chern 1 0 Po - 1 -2 -3 FIGURE a = 1.behaviour near a maximum can be observed from the streamlines at nearly 8 = 240" and at different angles on the right upper side of the cylinder, as can be verified by figures 4 (a-f) and 7 (a-f). The behaviour of the maximum between 8 = 0' and 60' in figures 16(a) and 16(b) shows that the place at which the strongest recirculation takes place increases in
8
from t = 1 to about 3, then decreases for a period of time. The last fact implies that the centre of a nearby vortex, when it exists, moves toVortex shedding from a circular cylinder
(4
29 1
FIGURE 18. Contours of the spatial pressure for Re = 3000, a = 1 : (a) t = 2, ( b ) 8.
higher positions (measured in 0 ) and then proceeds to lower positions. Furthermore, a maximum in surface vorticity with two neighbouring minima could possibly indicate the existence of a vortex next to the cylinder surface. For example, in both of the cases considered, there is clearly a small vortex, at t = 3, next to the cylinder surface in the lower wake (cf. figures 4b, 7b) which corresponds to the maximum between 8 = 300' and 360' with two neighbouring minima. Finally, we notice that the overall magnitude of the surface vorticity for Re = 20000, a = 1 is about 2.5 times that for Re = 3000, a = 1. This roughly indicates that the magnitude of surface vorticity increases at a rate proportional to the square root of the Reynolds number.
292 C.-C. Chang and R.-L. Chern -8 - 6 -4 CL -2 0 2 0 2 4 6 8 10 12 t I I I I I 2 4 6 8 10
FIGURE 19(a, b). For caption see facing page.
t
This rate is necessary for the drag and even the lift coefficients (due to pressure) to remain a t a fairly stationary level over a range of Reynolds numbers.
4.6. Pressure, lift and shedding
The bchaviour of the surface pressure distribution appears almost to be opposite to that of the surface vorticity distribution. Larger positive vorticity corresponds to
- 8 -6 - -4
-
-6 -4 CL -2 0 2 ... ... ....
. -*.-..
. . . . ... r. ...;... I : * : I . ...,. ... ... ----.-.---..
... ... .; ... ,.
c---,
----
I I I t 2 4 6 293 1FIGURE 19. Time histories of the lift coefficients at different a: (a) Re = 3000, (b) 9500,
(c) 20000, (d) lo6.
lower pressure. The position of minimal surface pressure, however, lags behind the corresponding position of (locally) maximal surface vorticity
. Therefore, a bulge
phenomenon or a closure point near the cylinder surface signifies a region of relatively high pressure while streamlines clustering round the surface signify a region of relatively low pressure. Contrasting figures 17 (a, b) and 16(a, b) shows the294 C.-C. Chang and R.-L. Chern
validity of the above remarks. Pressure distributions are actually the key elements to understanding the time variation of the lift coefficient and the vortex shedding phenomenon. Below we consider two cases in detail.
4.6.1. Re = 3000, a = 1
Recall that the potential flow is predominant for an initial moment of flow development. Right after the flow is started, the pressure on the back of the cylinder recovers quickly from substantially low values. The pressure is high near the front and back of the cylinder, and is low near its top and bottom. The front stagnation point S appears, and by t = 1 has an azimuthal angle clcarly less than 180". The last fact signifies that the front region of high pressure extends downstream along the upper cylinder surface (cf. figure 18a). In the meantime, a region of strong recirculation forms rapidly near the right upper side of the cylinder, indicating the formation of a local region of relatively low pressure nearby. These observations correspond to the fact that the lift in figure 14(b) is initially downward, increasing in magnitude with time, and begins to decrease when the recirculation becomes significant. The negative of the lift coefficient rises again when a sizable bulge phenomenon near the top of the cylinder makes its appearance, pushing against the region of strong recirculation. We also notice that the pressure near the right lower side of the cylinder has been relatively high, pushing the primary lower vortex E, downstream. Competition for shedding therefore exists between vortices in the lower and the upper wakes. The 'pushing effect' in the upper wake evidently outweighs that in the lower wake, leading eventually to the detachment of the first upper vortex. Note that in this case the forewake in the upper wake is not significant.
Figure 14(b) shows that a t t = 7.83, the negative of the lift coefficient reaches a substantial (local) maximum. On the other hand, figure 4(d, e ) indicates that E, is well detached from the cylinder by
t
= 8. Figures 17(a) and 18(b) indicate that a tt
= 7.83 the front region of high pressure joins with that a t the back; a region near the right upper side of the cylinder is filled with fluid of high pressure. From t = 7.83, the negative of the lift coefficient decreases gradually and reaches a minimal value shortly after t = 12 (at about t = 12.2). Indeed, figure 17 ( a ) indicates that a t t = 12 fluid near the right lower side is of relatively high pressure while a region near the right upper side is filled with fluid of relatively low pressure. Recall that E, is about to be shed a t t =12.
The above observation has the following implication. The alternate formation of regions of relatively high pressure in the lower and the upper wakes is a conspicuous signature of the shedding of El, E, and perhaps vortices shedding later, marking extrema of opposite senses in a lift coefficient. It is therefore appealing to define the moment t = 7.83, that is, when the first substantial extremum of the lift coefficeint is attained, to be the shedding timeti
of the vortex E, andt = 12.2 (estimated) to be the shedding time of the vortex E,. Evidently, the definition of shedding time is not sufficient to describe when a particular vortex begins to disengage itself rapidly from the cylinder. One possibility for this purpose is to define a disengaging time
th
to be the instant a t which the lift curve changes its sign of curvature and which is just before the negative of the lift coefficient reaches the maximum. This definition could be quite artificial, but is one obvious choice which has the meaning that the lift coefficient is on its way to reaching an extremum at the time defined. According to this definition, we find the disengaging timeVortex shedding from a circular cylinder 295 a\Re 1000 3000 9500 20 000 1 0 5 - - 2.0 10.33 11.79 - 1.5 7.85 8.65 9.71 10.67 6.11 1
.o
6.75 7.83 9.67 4.17 5.57 0.5 7.33 8.95 11.43 12.50 5.88TABLE 1 . Shedding times of the first vortices shed
&\Re 1000 3000 9500 20 000 1 0 5
2.0 5.90 7.62 10.67 - -
1.5 4.70 5.95 7.00 8.20 4.50
1
.o
4.48 5.90 7.96 2.98 4.15 0.5 4.83 6.30 9.55 10.70 4.35TABLE 2. Disengaging times of the first vortices shed
4.6.2. Re = 20000, a = 1
The initial development is quite close to the preceding case.
A
region of strong recirculation, however, appears a t a higher position relative to the horizontal axis through the cylinder centre. In other words, the P-phenomenon is significant. Figure 14 ( c ) shows that in contrast to the preceding case the lift coefficeint reaches a positive (upward) maximum at t = 4.17 when E, is about to be shed. Figure 17 ( b ) shows that at t = 5, a region near the right lower side of the cylinder contains fluid of relatively high pressure while a region of low pressure is still attached to the right upper side. Figure 17 ( b ) shows further that a region of relatively high pressure exists next to the right and the upper sides of the cylinder. We see, therefore, another case of alternate formation of regions of relatively high pressure in the lower and the upper wakes, which correponds well to the alternate shedding of vortices. We may similarly findt i = 4.17,
ti
= 9.93 andtb
= 2.98, tk = 7.93 for E, and E,.4.7. Lift, drag and moment
Figure 19(a-d) displays time variations of the total lift coefficients with different values of a for Re = 3000, 9500, 20000 and lo5 respectively. It can be seen that the contribution to the lift (coefficient) from friction is small and is getting smaller as the Reynolds number is increasing. For a given Reynolds number, there seems to be no definite ordering relationship between the (total) lift coefficients a t different values of a. However, the negative of the lift coefficient does indeed increase with increasing the speed ratio a in an initial period; this agrees with (26). The amplitude of the lift coefficient clearly increases with increasing the speed ratio u. For cases with clean shedding patterns, the cylinder may first experience a clean downward maximal lift when the first shedding vortex is from the upper wake, or an upward maximal lift otherwise. The behaviour of the lift coefficient becomes blurred when there is strong competition for shedding between vortices in the upper and the lower wakes, for example, in the cases Re = 9500, a = 1 and Re = 20000, a = 0.5. These two cases are indeed of transitional nature, as explained in $4.3, regarding the shedding patterns. The lift coefficients also provide the data for the disengaging and shedding times of the first vortices shed. The results are summarized in tables 1 and 2. We note here that sometimes i t is difficult to mark clearly a reflection point on the lift curves; the listed disengaging times are not without some errors or indefiniteness. For a given
296 3.0 2.5 2.0
c,
1.5 1 .o 0.5 0C.-C. Chaw and R.-L. Chern
(4
a = 0.5 ... ...- - -
1.5 ... ... _ _ . _ . _ _ _ _ _ _ _ _ _ _ ... . . . . . ... . . .--. .. .
:
.4
, . ... ,.. ... j/
2.0I
i
(b) -60 -50-
... I 1 I I I IFIGURE 20. Time histories of the drag and moment coefficients at different oc for Re = 20000:
(a) drag coefficient, ( b ) moment coefficient.
Reynolds number, the shedding time and the difference in the shedding and the disengaging times are relatively small for moderate a, say, in a range nearby 1. This is reasonable according to the diagram in figure 2. For small a, strong competition exists in the form of double transposition while for 01 close to 2, vortices in the lower