國立臺中教育大學永續觀光暨遊憩管理碩士學位學程
碩士論文
The impact of tourism growth towards the
performance of international tourist hotels:
Perspectives from the effects of tourist nationality and
hotel location
指導教授: 吳忠宏 博士
研 究 生: 張千雲 撰
I
謝誌
感謝修平科大鍾瑞國校長與觀光系賴子敬主任的推薦與支持下,千雲得以重拾書本 投入研究所唸書,建立觀光專業專長,得至今日完成論文,鍾校長的支持,功不可沒。 在二年的研究所生活,首要感謝指導教授吳忠宏所長的時時鼓勵、全心牽成、嚴謹指導 與諄諄教誨。在觀光領域學術研究與觀光實務學習上,給予千雲專業論文寫作與發想的 訓練,並協助擴展業界與學界的人脈。千雲在二年的研究所期間,學習到吳忠宏老師的 為學嚴謹、處事敏銳,與研究細膩,讓千雲在未來教學與研究上更瑧完善。 本篇論文口試,承蒙 陳明祥教授與王志宏教授主任,百忙中撥冗為千雲審視論文 內容,並專業地與良善地提供精闢指導與建議,更提供許多新的未來研究領域方向,讓 本篇論文有更好的呈現與後續研究深耕。 二年的學習過程中,一定要感謝吳忠宏所長、王志宏主任、黃玉琴老師,與劉子銘 老師在課堂中與論文上的關心、幫助與指導;千雲亦要萬分感謝游國謙教授的傾囊相授 與提供校外參訪的寶貴學習機會,讓千雲得以在遊樂園經營與旅館營運二大領域中,獲 益良多。 此外,感謝樂萍姐三年的經驗分享、巧穎的熱心幫助、文山哥的熱情相挺、士傑兄 的情義指導、瑋玲的貼心禮物,與所上的同學與學弟妹,讓千雲二年的研究所生活,愉 快且充實。更要萬分感謝麗娟與芳瑜二年來的諄諄提醒與貼心幫忙,讓千雲能在工作與 課業二頭忙碌中,不至於落後太多,進而能夠完成學業。最後,謝謝吳所長家族中的美 惠姐、維德兄、千雯、麗娟、楊衡,與心瑩,在每一次的討論中,都能給千雲許多的建 議與討論,並在口試的過程中給予幫忙,均是千雲完成學業的重要助力。 最後,感謝父母親、內人健菁、家人、學校與系上同仁,在這段時日對千雲的支持, 終能使得千雲完成論文,取得學位,謝謝一路上的你們,辛苦了。 張千雲 謹致 中華民國一零四年七月II
The impact of tourism growth towards the performance of
international tourist hotels: Perspectives from the effects of tourist
nationality and hotel location
Abstract
Among previous literature, the problems of the aggregation bias may result in that relationship between tourism and economy with aggregate data may offer little guidance for policymakers when formulating tourism marketing and economic growth policies and has been controlled of using disaggregate analysis. Different to the traditional manufacturing industry, the higher competition hotels industry dependent heavily on an effective location strategy to attract hotel guests for accommodation. This paper is hence to examine the relationship among different nationality of tourist arrivals, and hotel location base on the theoretical model among the international expansion and hotel financial performance.
The disaggregation analysis model the relationship between the relationship between the tourist arrival numbers and the hotel operation variables in helpful in assisting hotel managers’ assessment of various tourist structure in making hotel human resource, marketing and competition decisions.
III
觀光產業成長對國際旅館績效之影響:以旅客國籍與旅館設置區
域作探討
中文摘要
過去文獻指出探討整體經濟與整體觀光產業關的關係,往往會落入整合性誤差 (aggregation bias),造成實證結果意涵的侷限性。此外,不同於傳統製造產業,旅館選址 策略對於吸引旅客住宿是非常重要的因素。故本文將就不同的旅客國藉與不同的地點, 討探觀光產業成長與國際觀光旅館間的關係。 本文實證結果,發現國際觀光客與旅館營運變數間的非整合分析(disaggregation bias),能對旅館經理人提出可製定市場營銷、人力資源與競爭策略的有益資訊。 關鍵字:旅館績效、國際觀光客、旅館位置、整合偏誤。IV
Contents
謝誌...I Abstract...II 中文摘要...III Contents...IV List of Table...V List of Figure...VI I. Introduction...1 1.1. Research Background...51.2. Research Motivation and Objectives...9
1.3 Procedure of the Research ...12
II. Literature Review...13
2.1 Economy, Tourism, and Hotel firm performance ... 13
2.2 Aggregation bias...16
III. Methodology...18
3.1 Variables and pooled regression for estimated beta...19
3.2. Data...22
IV. Empirical results...24
4.1 Nationality effect on the hotel operation...25
4.2 China effect on the hotel operation...28
V. Conclusion...30
5.1. Foreigner and domestic tourist arrivals...31
5.2. Chinese tourist effect...34
5.3. Limitation and opportunities of future research...35
References...36
Appendix A...70
V
List of Table
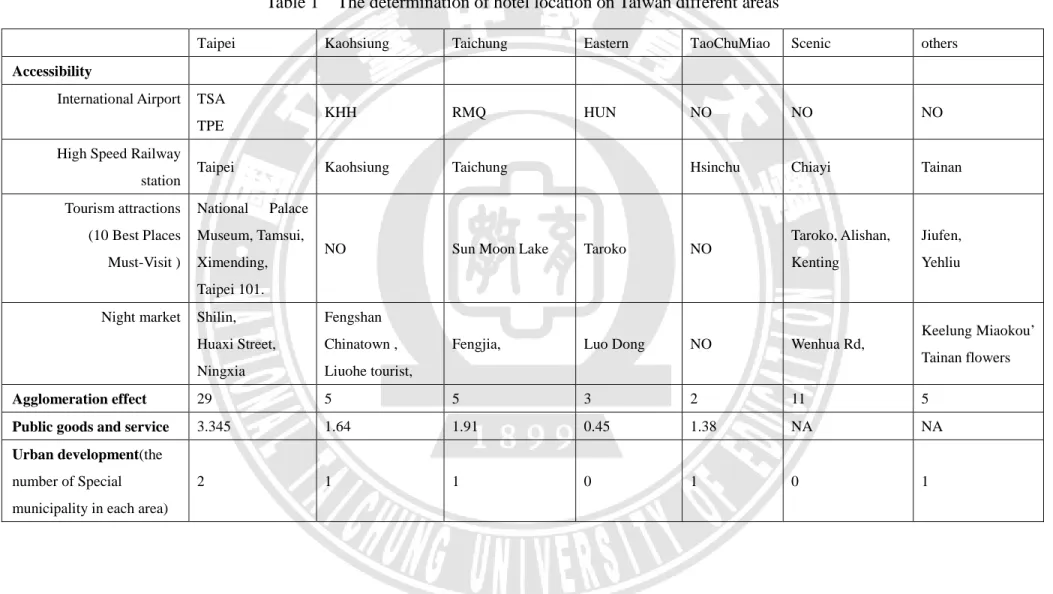
Table 1 The determination of hotel location on Taiwan different areas...46
Table 2 Descriptive statistic of hotel operation variables...47
Table 3 Descriptive statistic of international tourist numbers...48
Table 5 The international tourist impact on the hotel revenue...49
Table 6 The international tourist impact on the hotel rate...50
Table 7 The international tourist impact on the hotel occupancy...51
Table 8 Chinese tourist impact on the hotel revenue...52
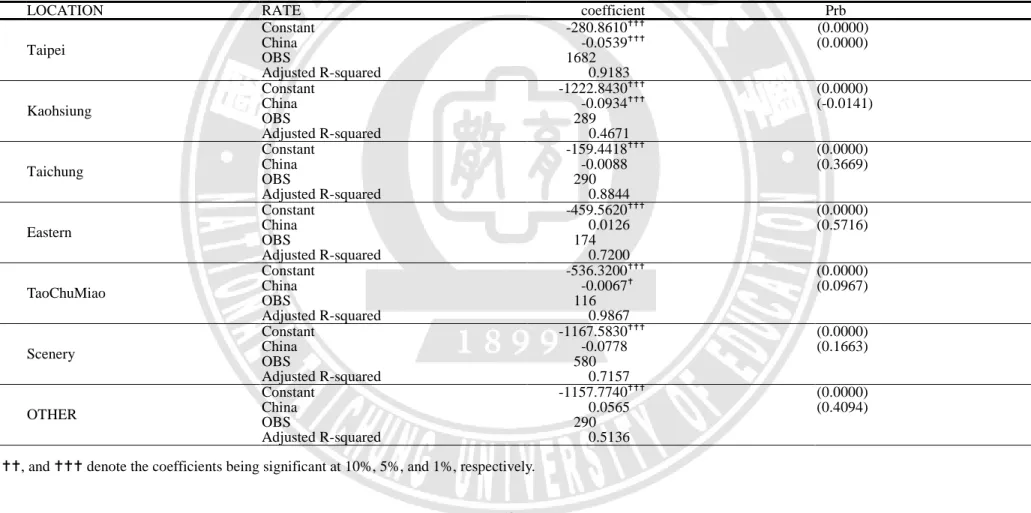
Table 9 Chinese tourist impact on the hotel rate...53
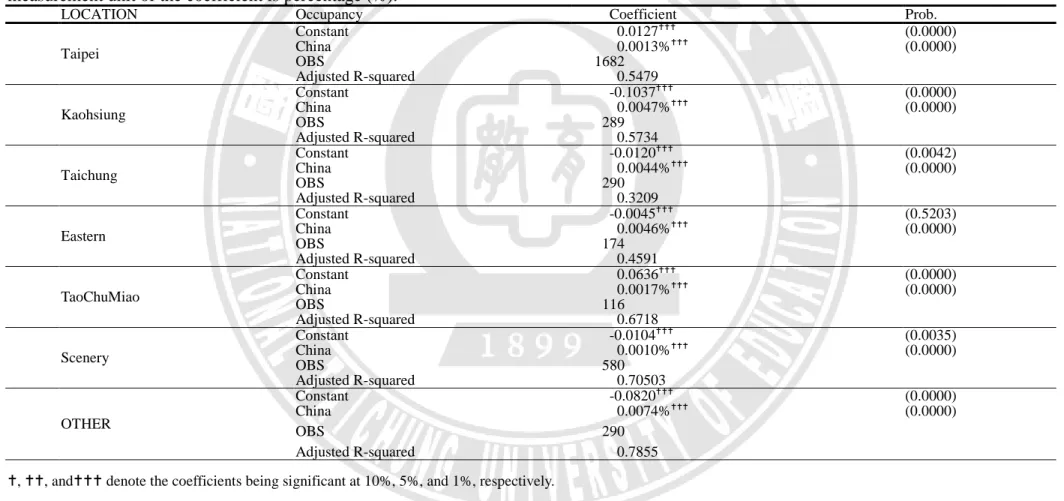
Table 10 Chinese tourist impact on the hotel occupancy...54
VI
List of Figure
Figure 1 The exchange rate trends by different currency from January to 2013
October ... 55
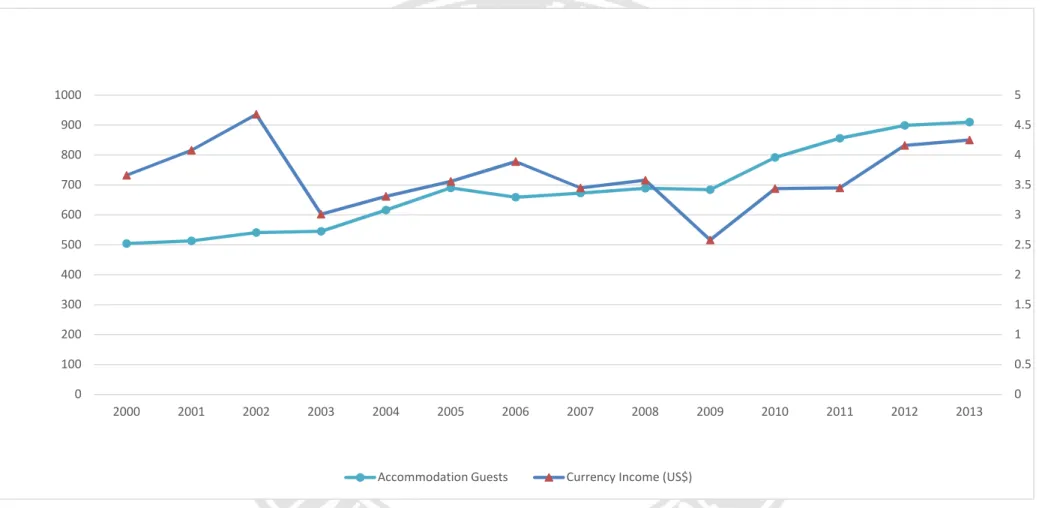
Figure 2 Relationship between currency income and accommodation guests. This figure illustrates international tourism hotel aggregated currency income with accommodation guests from 2000 to
2012 ... 56
Figure 3 Relationship between revenue and accommodation guests. This figure illustrates international tourism hotel aggregated revenue with
accommodation guests from 2000 to 2012 ... 57
Figure 4 Structure of the Research... 58 Figure 5 Empirical model... 59 Figure 6 The Hotel revenue at different location in Taiwan from January to 2013
October... 60
Figure 7 The Hotel occupancy rate at different location in Taiwan from January to
2013 October... 61
Figure 8 The Hotel room rate at different location in Taiwan from January to 2013
October... 62
Figure 9 International Tourist accommodated in Taiwan, Taipei by different
nationality from January to 2013 October... 63
Figure 10 International Tourist accommodated in Taiwan, Kaohsiung by different
nationality from January to 2013 October... 64
Figure 11 International Tourist accommodated in Taiwan, Taichung by different
nationality from January to 2013 October... 65
Figure 12 International Tourist accommodated in Taiwan, Eastern by different
nationality from January to 2013 October... 66
Figure 13 International Tourist accommodated in Taiwan, TauChuMiao by different
nationality from January to 2013 October... 67
Figure 14 International Tourist accommodated in Taiwan, Scenery by different
nationality from January to 2013 October... 68
Figure 15 International Tourist accommodated in Taiwan, Others by different
1
CHAPTER I
INTRODUCTION
A considerable number of studies of hospitality management aimed at shaping industry practice and academic work has become a vital research over the last four decades (Lugosi, Bell, & Lugosi, 2009). An increasingly number of pioneer papers have focus on the management subjects in order to provide more comprehensive knowledge and in-depth insight in the hospitality domain areas such as hospitality marketing (Line & Runyan, 2012; Yoo, Lee, & Bai, 2011; Oh, Kim, & Shin, 2004), human resources (Guerrier & Deery, 1998), finance and financial management (Jang & Park, 2011; Tsai, Pan, & Lee, 2011),strategic management (Olsen, 2004; Olsen & Roper, 1998), information technology (Ip, Leung, & Law, 2011; Law, Leung, & Buhalis, 2009; Leung & Law,2005)
In the first part of finance and financial management, the external environment of business comprising the relationship between macroeconomic environment and hospitality has always been significant interest to analysts and researchers in the hospitality papers.
The macroeconomic environment can be described in terms of variables such as inflation rate, economic growth, exchange rate and interest rate, which are largely considered to be the outcomes of fiscal and monetary policies. Novak, Petri'c, and Prani'c (2011) examined the effects of selected macroeconomic variables on the presence of foreign hotels in Croatia. Enz, Canina, and Lomanno (2009) investigated the relationship between room rates and economic growth cycles to understand room pricing in times of uncertainty within the U.S. market. Prani'c, Ketkar, and Roehl (2012) examined the effects of specific factors of the macro-economy on the
2
international expansion of hotel chains in the U.S.
Among these macroeconomic variables, the impact of exchange rates on international tourism has been reviewed by numerous researches, and exchange rate is generally considered an important tourism demand drive factor (Witt & Witt, 1995). Tourism products consumed by international travelers are belonged to exports sector (Divisekera, 2003). That tourism firms are expected to expose to the uncertainty of demand fluctuations incurred by exchange rate changes (Lee & Jang, 2011). In the hotel industries, hotel managers actively pursue internationalization and suffer the exchange rates risk (Jang & Tang, 2009; Lee, 2008; Lee & Jang, 2011). Therefore, exchange rate as one of general economic state variables could has more relative impact on the international tourism expansions which are measured by growth of total inbound tourist arrivals.
While it is difficult to generalize on the empirical results of the effects of selected macroeconomic variable such as exchange rate on the hospitality industry, it can be concluded that the effects vary from one market or country to the other. The Figure 1 shows that the exchange rates vary with different currencies during last 13 years. Consequently, questions regarding the impact of exchange rate on Taiwanese hotel tourist arrivals arise. In this paper, we lighted the relationship between exchange rate and Taiwanese hotel tourist arrivals in Appendix A.
In the second part of finance and financial management, Hotel business performance has been examined from financial data (e.g. Enz, Peiró-Signes, & Segarra-Oña, 2014; O'Neill, 2003; O'Neill & Mattila, 2006; Pan, 2007; Tsai, Kang, Yeh, & Suh, 2006). Venkatraman and Ramanujam (1986) proposed financial performance for performance evaluation is a relatively important aspect. In addition, Barney (2002) advocated that accounting and financial related data are selected to be
3
the core focus on measuring organization's competitive advantages. From previous hospitality literatures reviewed, Lei and Lam (2015) noted that financial data which the most commonly used concerning hotel business performance include average daily rate (ADR), revenue per available room (RevPAR), average room rate (ARR) (Enz et al., 2014; Hung, Shang, & Wang, 2010; Lee & Jang, 2011), and occupancy rate (Jeffrey & Barden, 2000, 2001; O'Neill, 2011; Wu, Law, & Jiang, 2010).
Chen (2011) noted the expansion of international tourism market in Taiwan increases demand for local hotels and hospitality services due to the tourism industry was one of major contributors to Taiwan’s economic growth by previous research studies (Chen, Kim, & Liao, 2009; Kim, Chen, & Jang, 2006, and Jang & Chen, 2008)
The expanding inbound tourism markets are expected to lead high occupancy rate and offer the better sales earnings of corporate performance in hotel companies. As one of performance measurement, previous research studies have found no significant relationship between tourism expansion and stock performance of hotels (Chen, 2007a, c). However, the test results of Chen (2011) showed that international tourism expansion, proxies by the growth of total inbound tourist arrivals, has a significant influence on hotel sales measured by revenue per available room and occupancy rate and profitability measured by return on assets and return on equity than it does on hotel stock performance. Therefore the hotel financial performances were expected to be sensitive to tourist arrivals. These studies also confirm investigation of the impact of inbound tourism growth on hotel performance will dependent on the performance measurement variation.
4
According to previous two important issues of finance and financial management, this paper is hence to examine the relationship among different nationality of tourist arrivals, and hotel location base on the theoretical model among the international expansion, and hotel financial performance. We further have more discussion to explain that why we incorporate the nationality of tourist arrivals, and hotel location to the theoretical model in the chapter of the background and motivation.
5
1.1. Research Background
There are 2.950 million international visitors arrival in Taiwan, 2003. In 2013, Taiwan has attracted around 8.016 million international visitors shown as 170 percentage growth rates. The tourism industry is one of the six important emerging industries promoting which is ruled by Taiwanese government. The government policy strongly leads the impressive performance of Taiwan tourism industry development, such as the slogan of ‘touch your heart ’’ and ‘‘time for Taiwan’’ marketing campaign with the implementation of the doubling tourist arrivals plan.
The growth trend in Asia traveling1 makes the hotel management become an important issue more than ever for most Asian hotel managers. In Taiwan, the policies of Two-day Weekend Labor-off and International Visitors Multiplication Program successfully increase the domestic travel and inbound arrivals. The rapid growth of travel demands also leads to an enormous economy benefits for the sightseeing bus and hospitality industry. The numbers of domestic tourists have increased to the 142,615 thousand people in 2013 and foreign arrivals have continuously increased from 7.78 million of 2004 to 11 million of 2013 according to the report of Taiwan Tourism bureau with the peace of Taiwan Strait and Asia tourism flowing tide. The uptrend global tourist arrivals stimulate the Taiwanese currency earnings and the increasing hotel room demand in Taiwan.
Hotel businesses play an important role to support the hospitality industry growth. Therefore the performance of hotel operation have become more important than ever, because of more and more new entry hotels have been built in Taiwan hospitality industry. According to the report of Taiwan Tourism bureau, there are 53 international
1
The annual average of international arrivals reached of Asia and Pacific regime is 6.2% from 2005 to 2012 and held up the highest growth among all UNWTO regions despite Asian suffering continued economic volatility around the globed demand (Tourism Highlights, 2013).
6
tourism hotels with average room rate NT$3,109, average revenue NT$34.79 billion, average occupancy rate 65.06% and currency income US$0.366 billion in 2000. Until to 2012, the numbers of international tourism hotels have grown up to 70. Their average room rate and occupancy rate increase to NT$3,577 and 70.96% which creates higher average revenue NT$45.12 billion, but the currency income only have US$0.416 billion less than the level of currency income in 2000.
Compare Figure 2 and Figure 3, it is found that the increasing inflow of foreign tourist arrivals increase the international tourism hotels aggregated revenue but seemly have less impact on their currency income from 2000 to 2012. This phenomenon lights an idea to answer how international tourists affect the hotel performance.
Base on the Taiwan Tourism Bureau international tourism operation report, Taiwanese hotels are divided into seven categories: Taipei area, Kaohsiung area, Taichung area, Eastern area, TaoChuMiao area, scenic area, others area. Each area may include one or several counties.
Different to the traditional manufacturing industry, the higher competition hotels industry dependent heavily on an effective location strategy to attract hotel guests for accommodation. A strategic location can be well predictor to dominate superior performance by the hotel revenue generation (Johns, Howcroft, & Drake, 1997; Nicolau, 2002). Especially, Taiwan offers an endless variety of experience and the scenery. Taiwan lies on the western edge of the Pacific and have majestic peaks, rolling hills and plains, basins, coastlines, and other natural landscapes. The 10 best place must-visit are around Taiwan such as Jiufen, Sun Moon Lake, Taroko, Kenting, Alishan, Yehliu, National Palace Museum, Ximending, and Taipei 101 from 2103 Taiwan tourism annual report. For visiting and experiencing the scenic spot or other
7
locational advantage, the hotel’s location is an essential factor that strongly influences a tourist’s hotel selection decision. Yang, Wong, and Wang (2012) attributes that the four important characteristics: accessibility, urban development, public good and service and agglomeration effect can strongly influence a tourist’s hotel selection decision.
Besides, Taiwan 2013 tourism annual report illustrate that the first two attractive activities for foreign tourist arrival in Taiwan is shopping and night market experience. For most foreign arrivals, the main purpose to Taiwan is to taste the enormous variety of unique and delicious Taiwanese snacks of the world. The night market is an important place which takes the food culture into the lives of the Taiwanese people and experiences different specialties, cultures and people from different areas around Taiwan. According to the Statistical Information of Taiwan Tourism Bureau (2002 annual survey report on R.O.C. inbound travelers, Taipei, Tourism Bureau, 2003), Tourist Night Markets ranked among the top three most popular sight-seeing spots for tourists spending their leisure time in Taiwan. Hsieh and Chang (2006) investigated tourists’ motivations and their preferred leisure activities when they shop in Taiwan Tourist Night Markets. According to Taiwan Tourism Bureau took place the event: Popularity vote for the 10 must-visit night market in 2010, the top ten winner are Keelung Miaokou night market, Shilin night market, Huaxi Street Night Market, Ningxia night market, Fengjia night market, Wenhua Rd. Night Market, Tainan flowers night market, Liuohe tourist night market, Fengshan Chinatown night market, Luo Dong night market. Table 1 shows that each Taiwan area with different important characteristics: accessibility, urban development, public good and service and agglomeration effect (Yang et al., 2012) and the numbers of Taiwan future ten best visiting night market. This paper
8
employee the four important characteristics: accessibility, urban development, public good and service and agglomeration effect (Yang et al., 2012) and the Taiwan ten best visiting night market into Table 1 for understanding each location specific characteristics.
In our attempt to investigate how international tourists affect the hotel performance on different location strategies, this study examined the data on hotels operation and location in Taiwan as a case study for two reasons. First, while there exists a complete international tourism hotel monthly operation data set by Taiwan Tourism Bureau in past thirteen years. Second, the particular experience and unique situation in the case of hotel location in Taiwan multi-scenic spots, which have experienced unprecedented growth in tourist arrival expansion and hotel development offers an ideal empirical background to test the proposed model.
9
1.2. Research Motivation and Objectives
As one of many cyclical industries, the hotel industry expansion is strongly sensitive to the state of the economy (Chen, 2010). The prospects of global economy affect the performance of the tourism industry worldwide (Smeral, 2010; Song & Lin, 2010). There are two main reasons for the hotel industry as one of the tourism industry that lead to the relationship between the hotel industry and global economy. The one of the important reasons is that properties and real estate such as buildings is essential assets for hotel industry. The investment of heavy fixed costs makes most hotels have higher business operation leverage (the percentage of fixed costs to total cost, a measure of how revenue growth translates into growth in operating income). Holding higher fixed cost percentage makes hotels gain large operating income as raising revenue from global economic expansion. As economy downturns, the hotels cannot offset the fixed cost in response to decrease sales and suffer larger operating loss. The hotel finance characteristics of profit swing widely with sales will require hotel managers paying more attention in maintaining high revenue to survive and generate adequate profit (Graham & Harris, 1999).
The second fatal reason is that hotel revenues are tied up to economic change and tourism growth. Tourism expansion can significantly improve the performance of hotels (Chen, 2013). Economic growth caused by tourism expansion has a significant influence on the hotel performance (Chen, 2007b). Chen (2010) showed that GDP change as an economic factor has slightly higher influence than the industry factor of tourist arrival change on the hotel financial performance. The tourism expansion could raise the financial performance of tourism-related companies (Chen, 2007b).
The high amount of fixed costs and high tourism growth related revenues make the hotel suffer higher macroeconomic and industry risks than other sectors.
10
Furthermore, these characteristics may result in different performance management issue for the hotel industry as compared with other industries. Harris and Brown (1998) noted that hospitality industry should be gain benefit from other industry’s management experience. Such as the performance management, it can offer the decision makers science technology to analyze operational data effectively. The industry statistics of hospitality and annual profit statement of hotel should be established for performance analysis. The performance measurements include stock returns, return on asset, and return on equity. However, it is hard work for most emerging countries to collect operation data of hotel due to the lack of uniform accounting system and only few hotels listed in stock exchange. Taiwanese Tourism Bureau has collected the monthly operation data of Taiwanese international tourism hotels and the foreigner arrivals for accommodations since1999. This data base provides a good opportunity and experiment environment to investigate the response of hotel performance to the foreigner tourist effect in Taiwan during the tourism booming period.
To an emerging country, inbound travel arrivals and spending as goods export can generate currency income and higher economic growth. The uptrend of global tourist arrivals stimulates the currency income for Taiwan and the increasing hotel room demand in Taiwan. So measuring the impact of inbound tourists on hotel performance is the most important mission and task for individual hotel related company and administrations to formulate the revenue management and market segment strategy. However, pioneer researches focus on the aggregated data of tourist arrivals and hotel operation variables but neglect the difference of the hotel location and arrival nationality.
11
This paper contributes effort to investigate the effect of different international tourist on hotel income, price and room sales base on the data set from the Taiwan Tourism report. As our preliminary result we confirm that relationship between currency change and the number of tourist arrived in Appendix A. We also find the relationship between international tourists and room sales, income or price. This finding can fill the gap of international tourism effect on the hotel management. It also lights the performance management of hotel industry especially in emerging market which lack of complete statistic data base. Our result can improve the hotel manager knowledge of how to define their target international guest and manage price and income.
12
1.3 Procedure of the Research
The remainder of this paper is organized as follows. In section 2, we illustrate the literature review Section 3 shows the methodology and the data statistical analysis. Section 4 presents the empirical results. In the final section, the conclusions are presented.
13
CHAPTER II
LITERATURE REVIEW
2.1 Economy, Tourism, and Hotel firm performance
The room department and the food & beverage department are two main streams of the hotel cash flow income. The provision of room department can be treated as pure service product. Service is an intangible commodity and provides customers a memory of the experience. So the hotel service can be treated as high elastic demand goods. Wheaton and Rosoff (1998) evidenced that domestic economic situations have significantly impact on the U.S. hotel room demand. Choi, Olsen, Kwansa, and Tse (1999) model the business cycle for the U.S. hotel industry and show that the average expansion period of hotel industry was about three years. Choi (2003) developed an economic indicator system to forecast the turning points in growth of the US hotel industry.
Previous studies pay more attention on investigating the state of the economy in explaining stream of stock return of hotels. Barrows and Naka (1994) found that the expected inflation rate, money supply and domestic consumption had a significant influence on returns of U.S. hospitality stocks. Chen, Kim, and Kim (2005) found that the economic variables (money supply growth rates and unemployment rate) and non-economic events have strong effect on hotel stock returns. Chen (2007b) evidenced a long-run link between GDP (gross domestic product) and stock performance of tourism firms. Chen (2010) shows that neither GDP nor tourist arrivals have a significant impact on hotel stock performance.
14
Other stream of research work advocates examining the causal links between tourism industries2 and economic growth. Balaguer and Cantavella-Jorda (2002) first offered a tourism-led growth hypothesis that tourism development was a significant factor in simulating the state of economy. Lee and Chang (2008) found that tourism expansion could lead to economic growth in OECD countries. However, Tang and Jang (2009) indicated GDP growth could increase the sales of tourism industries, but industry growth fail to cause GDP increasing. Kim, Chen and Jang (2006) stated that a bi-directional causality between economic growth (GDP increase) and number of total foreign tourist arrivals (tourism expansion). Wang (2014) support the GDP growth of the tourist’s home country leads to an increase of tourism expenditure in travel destination country. It is reasonable to expect that tourism spending including the accommodation and food.
Chen (2010) showed that the growth rate of total foreign tourist arrivals as a proxy variable as tourism growth can strengthen the tourist hotels performance such as ROA and ROE.
To sum up, most studies focus on examination of the economy impact or tourism expansion on the hotel stock return. However, there is little examination of the association between the economic influence, tourism growth and unlisted hotels performance. In Taiwan, there are hundred international tourism hotels3 and thousand hotels, but only 12 hotels have been listing in security market. It is interesting to examine the performance of unlisted firms due to its large market share percentage. In addition, previous studies over emphasis on a firm stock return may fall into a biased result about riskiness perception of irrational investors (Chen, 2010). The stock return
2
Which include airlines, casinos, hotel and restaurant.
3
15
would not fully present the true firm performance. Due to the representative of unlisted hotels and bias of stock return and financial ratio4, this paper employees the sales revenue as a proxy variable of hotel firm performance.
4
Traditional financial ratio may not reflect the measurement of the firm’s overall performance (Ross, Westerfield, & Jordan, 2008).
16
2.2 Aggregation bias
The aggregation bias has been firstly point out in macroeconomic (Theil, 1954) and urban economics (Goodman, 1998). As one of the rapid growing services in the global economy, the contribution of tourism on economic growth has long been investigated in past literatures (West, 1993; Archer, 1995; Gunduz & Hatemi-J, 2005; Kim et al., 2006). Among these literature, the problems of the aggregation bias may result in that relationship between tourism and economy with aggregate data may offer little guidance for policymakers when formulating tourism marketing and economic growth policies (see also Oh, 2005). This problem of aggregation bias has been shown to exist in housing market by Zietz, Zietz, and Sirmans (2008) and has been controlled of using disaggregate analysis by Corgel, Lane, and Walls (2013).
Most hotels have very different price and quality characteristics. The hotel industry in U.S. can be organized into six chain scale divisions as follows luxury, upper upscale, upscale, upper midscale, midscale, economy, independent (Corgel et al., 2013). According Taiwan Tourism Development Act, the hotel industry has been categorized into international tourism hotel, hotel, and host family by different room number, operation purpose, and facility. One important concern here is that the heterogenous nature of hotel by different service quality, physical location, and customer base will suspect resulting in aggregation bias.
A strategic location will decide the short or long term superior performance of the hotel in terms of revenue generation (Johns et al., 1997; Nicolau, 2002). The different hotel locations which attribute the characteristics of accessibility, urban development, public good and service and agglomeration effect (Yang, Wong, & Wang, 2012) could present an essential factor that strongly influences a tourist’s hotel selection decision. Rivers, Toh, and Alaoui (1991) noted that the convenience of
17
location significantly affect tourists’ hotel selection. Lewis and Chambers (1989) showed that location was the most important factor influencing hotel selection for business tourists. However, some previous researches offered that leisure tourists also place high priority on locational advantage in selecting their hotels (Barsky & Labagh, 1992; Chu & Choi, 2000). Otherwise, Tsaur and Tzeng (1995) evidenced that hotel location factors, such as the convenience of transportation and parking, were among most important factors in assessing the service quality of hotel. Therefore, this paper employee the disaggregate data analysis with different location of Taiwanese international tourism hotel to offer more information to the hotel managers and policy makers. The aggregate data such as international visitor arrivals dataset does not accurately demonstrates that the impact nationality different on Taiwanese international tourism hotel markets.
This study try to examine the relationship among tourism expansion, economic variable, and hotel performance using the disaggregated hotel location and tourist arrivals to illustrate the aggregation bias problem and the advantage of a better explanation on the role of each tourism and economic variable on hotel performance in Taiwan. Therefore, the finding may provide more precise information to hotel manager when choosing the tourism marketing destination.
18
CHAPTER III
METHODOLOGY
According to pioneer research of economy, tourism, and hotel firm performance, this paper focuses on the two main research issues as shown in figure 5. We focus on the disaggregation investigation among the relationship of exchange rate, tourist arrival and hotel performance base on the difference of tourist nationality and hotel location.
19
3.1 Variables and pooled regression for estimated beta
Panel regression methodology can be estimated by two popular statistical models for the fixed effects method and the random effect method (Dimitrios, 2005). Baltagi (2005) and Hsiao (1986) states that panel regression methodology can reduce problems associated with multicollinearity and estimation bias by control heterogeneity and time-varying. Under the fixed-effect model we assume that there is common constant for all cross sections. That is, all differences of the constants are due to sampling error. By contrast, the random-effects model allows the constants to differ-that the constant are associated with random parameters underlying different population.
In order to understand the fixe effects model appropriation, the F-test is used to test the validity of the fixed effects method. The null hypothesis is that all the constants are the same, and the OLS method is more suitable than the fixed effect method. This hypothesis is tested by the F test, which is based on loss of goodness-of-fit. The Hausman specification test compares the fixed versus random effects is used to determine if the fixed or random effects should be appropriate. Under the null hypothesis, the individual effects are uncorrelated with the other regressors in the model (Hausman, 1978). If null hypothesis is rejected, which means that individual effects are correlated to the other regressors and a random effect model produces biased estimators. Therefore, the fixed effect model is better than random effect model.
Chen (2010) employees the F-test and Hausman test to determine the appropriate model of the fixed or random effects. He found that fixed effect model should be used to performance panel regressions base on the hotel firm performance. Therefore, this paper uses the F-test and Hausman test to determine the appropriate model in the
20
panel dataset.
The hotel operation variable are collected from Taiwan Tourism Bureau report and divided into four categories: rooms、occupancy、 Occupancy rate、Average rate Revenue and Employee. Room is measured by the room numbers of hotel capacity. Occupancy is the number of rooms occupied. Occupancy Rate presents the monthly number of rooms occupied divided by the monthly hotel capacity of the room numbers. Average rate is the monthly average hotel room price. Revenue is the monthly room department revenue income. Employee indicates the monthly hotel employee. Pioneer research of exploring the interactions between the hotel room rates and the number of international inbound tourists only consider the operation variable of room rate with limitation of higher frequency data, monthly data (Lee, 2010). This paper introduces additional variables in the empirical model to further investigate the relationship between the hotel operation and the number of international arrivals.
Total international tourist arrivals of hotel are also collected from Taiwan Tourism Bureau monthly report. This report is compiled from Taiwan Tourism Bureau completed by all international tourism hotels monthly in Taiwan. It can be used as a proxy for international tourism hotel demand. This variable includes the arrivals from North American, Japan, China, Australia, Asia, and Europe. The domestic tourists are also included in this paper.
21
The following pooling linear regression for operation variable of hotel
i
was developed for evaluating the influence of hotel international arrivals.it it tt i it Australia Europe Asia apanese ca NorthAmeri aiwan operation
ε
β
β
β
β
β
β
β
+ × + × + × + × + × + × + = it 4 it 4 it 4 it 3 2 1 T J (1)The models are classified into seven categories: Taipei, Kaohsiung, Taichung, Eastern, TaoChuMiao, Scenery, and Others by Taiwan Tourism Bureau. The dependent variable (operationit) is denoted as revenue, room rate, occupancy of hotel.
The explained variables include the numbers of domestic tourists, numbers of U.S. tourists, numbers of Japanese tourists, numbers of Asian Tourists, numbers of European tourists, numbers of Australian tourists.
22
3.2. Data
The empirical data comes from the monthly operation report and tourist numbers of Taiwan international hotel published by Taiwan Tourism Bureau from 1999 January to 2013 October. To understand the relationship between operation variable and tourist variant during the whole period, the dataset used in this study with complete information contains 60 different international hotels across 178 months and 10680 observations were formulated a panel dataset.
Figure 6, 7, and 8 show that hotel performance as revenue, occupancy rate, and room rate present uptrend except the year 2003 of SARs event during the sample periods. However, we also find that hotel locations difference seemly lead to different hotel performance pattern during the sample periods.
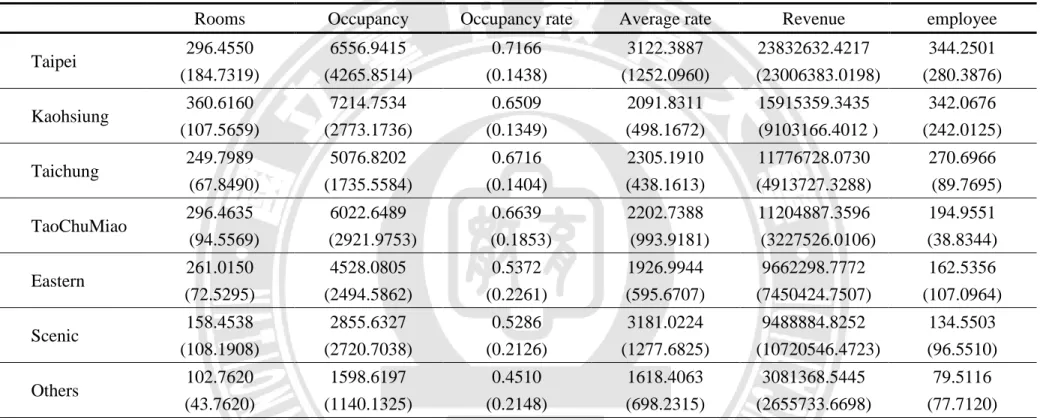
Table 2 reports the sample firm-year mean and standard deviation of hotel important operation variables for the whole sample periods in the seven regions. The Hotel Classification system of Taiwan Tourism Bureau base on the geographical location is classified into Taipei, Kaohsiung, Taichung, TaoChuMiao, Eastern, Scenic, other regions.
Table 2 shows that the mean and STDV values of the hotel operation variables in different regions. The highest mean value of rooms is about 360 in Kaohsiung and 3 times more than lowest mean value (102) in others location. The mean of occupancy rate is highest (71%) in Taipei and lowest (45%) in others. The mean of average rate is higher in Taipei (3122) and scenic (3181) regions. The hotels in location of Taipei and Kaohsiung have obviously higher average revenue (23832632, 15915359) than other geographical regions. Finally, the mean of employee numbers are 344 and 342 in Taipei and Kaohsiung than other geographical location.
23
Figure 9, 10, 11, 12, 13, 14, and 15 illustrate the trends of domestic tourists and foreigners tourists with different country in different hotel locations. According to these figures, we can understand that the tourist behaviors with different nationality are very different in hotel location difference. More domestic tourists have accommodated in Scenery and Others, but foreigners have consumed more in main city areas. And Chinese tourist arrival numbers significantly increased after year 2005.
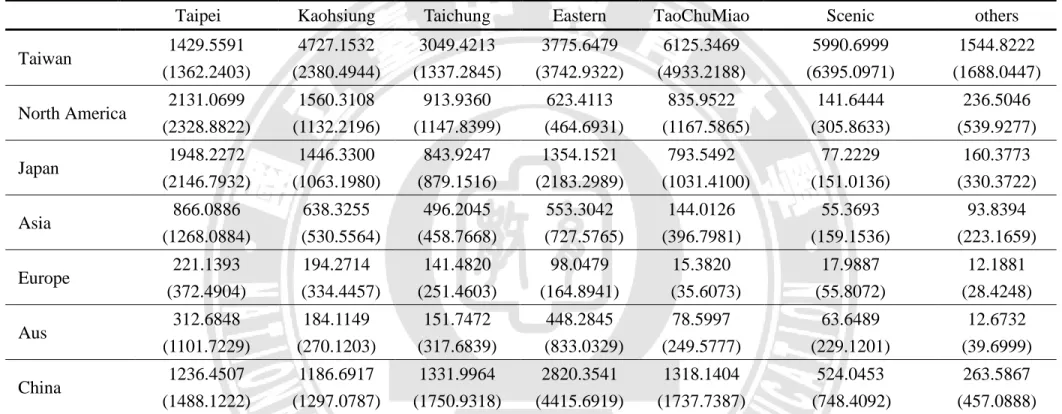
International tourist arrived numbers can be treated as travel demand then directly affect the hotel operation. The foreigner and domestic travel demand drivers and creates opportunities for profitability in hotel business model. Table 3 reports the mean and standard deviation of the international hotel visitor arrival in different geographical regions. For domestic tourists, highest mean of the arrival number is 5990 in the Scenic region, which imply that domestic tourist prefer to travel the eastern areas. For Chinese tourists, they mostly arrive hotel is in the eastern with mean value of 2820. Taipei region is most attractive location to stay a night, because the tourists from the North America, Japan, Asia, and Europe have their highest mean values in Taipei from the result of Table 3.
24
CHAPTER IV
EMPIRICAL RESULTS
In this sub-section, there are two main issued are discussed base on the empirical model. This second section considers the relationship between tourist arrivals and hotel operation with different disaggregated analysis in two categories. The first category consists of the investigation between domestic and foreigner tourist arrivals and hotel operations in section 4.1. The second category consists of the investigation between the Chinese tourist arrival and hotel operations in section 4.2.
25
4.1 Nationality effect on the hotel operation
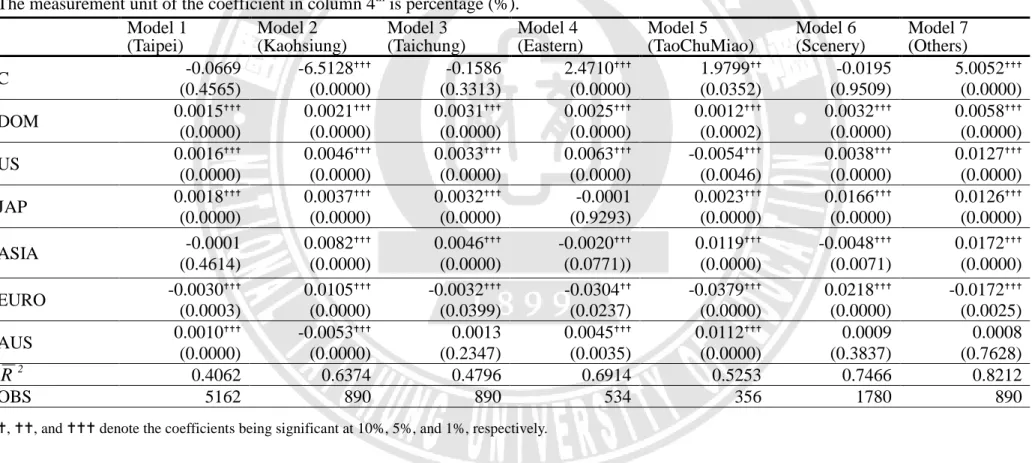
From Table 4 to Table 6, the empirical results show that the impact of different tourist nationality effects on the international operation variables with different locations. The time series include 178 monthly observations from 1999 January to 2013 October. The cross section data is collected by different areas which are defined by Taiwan Tourism Bureau. The dependent variables are classified into four categories: Revenue, Rate, Occupancy, and Employee. The interpretations of the empirical results are as follows:
Revenue. Table 4 illustrates the empirical results of nationality effects on the
hotel revenue with difference location in Taiwan. Table 4 shows the estimated coefficients of different nationality tourists on the room sector revenue. Most explanatory variable coefficients are significant positive at the 10% level. The positive value for coefficients indicates that foreigner visitors significantly increase the hotel revenues.
From Table 4, we can observe that the relationship between the nationality and the hotel revenue would vary by different hotel location. In Taipei area, the coefficient of European tourists is significantly largest (2976.1630) than other coefficients of tourist origins. It implies that European tourist arrivals could increase more hotel revenue than other foreigner and domestic tourists in Taipei location. This empirical result is also shown in the hotel location of Kaohsiung, TaoChuMiao, Scenery and Others area. However, the domestic tourists have little impact on the hotel revenue in Taipei. In Kaohsiung area, the highest coefficient is the variable of U.S. tourist arrivals with 1610.3390. The Asian tourist arrivals would bring highest impact on the hotel revenue in Taichung.
26
significant economic impact. The Japanese customers with second highest coefficient value have positive influence on the hotel revenue in the Eastern location.
Therefore, the positive relationships between the hotel revenue and numbers of international customers are significantly influenced by location difference. Compare to the difference of the location, the Australian tourists has most little influence coefficient on the hotel revenue such as in Kaohsiung, Taichung, Eastern, Eastern, Scenery, and Others. For the comparison of nationality, the most insignificant coefficients is in Eastern, which only domestic, USA and Japanese tourist have positive impact on the hotel revenue. The hotel revenues are most sensitive to the European tourists in most locations.
Rate. The average room rate level would dependent on the hotel location
according to Table 2. We can realize that Taiwan tourism present expansion in recently years and good and service price level have increased until now. Table 5 reports the results for the tourist nationality effect on the room rate level in different hotel locations. The significant positive coefficients present the positive relationship between the customer numbers and the room daily rate.
The coefficients of different nationality only in the location of TaoChuMiao are all significantly positive. It implied that the foreigner and domestic tourists push the hotel room price in over past 13 years in TaoChuMiao. Thus, the coefficients of Japanese and American tourists are significant positive with room rate in Taipei. However, in Kaohsiung, different foreigner tourist arrivals such as Japanese, Asian, and European have significant positive relationship with hotel room rate. Meanwhile, in the scenic area, the coefficient of domestic tourists (0.0870), American tourists (0.1389), Asian tourists (0.5528), and Austrian tourists (0.4483) are higher than other areas. There are only the domestic tourists and European tourists with positive impact
27
on the hotel price. Therefore, hotels with different location have different room rate growth pattern which have been affected by different foreigner and domestic tourists in our sample period. The hotel room rates are most sensitive to the European tourists in most locations.
Occupancy. Hotel performance has positive relationship with occupancy
(Corgel et al., 2013). Table 6 illustrates the relationship between the room occupancy and tourist arrival numbers. The positive coefficient indicates the positive relationship between tourist arrivals and the hotel occupancy rate.
The numbers of domestic customers have significantly positive relationship with room occupancy in some locations, and have significantly negative relationship with room occupancy in other locations. The coefficients of European tourists presents negative coefficient in Taipei, Taichung, Taiwan eastern areas, the location of TaoChuMiao, and others areas. Which imply the European tourists decrease as the the hotel occupancy rate increase in these regions. Domestic tourists and foreigner tourists such as American, Japanese, and Asian have more strong positive impacts on the hotel occupancy rates than other locations. For European tourists and Australian tourists, they have more storing positive impacts on the hotel occupancy rates in each Scenery, and Others regions.
The hotel occupancy is most sensitive to the Asian tourists in most locations such as Taichung, TaoChuMiao, and Others. The result of Table 6 demonstrates that individual hotel employee increase only has significant positive relationship with specific tourist nationality. This relationship would change with different hotel locations. The hotel managers in different location should project the service quality planning on their target tourist market based on our result.
28
4.2 China effect on the hotel operation
According to the report of UNWTO Tourism Highlights, 2014, China ranked the first-large in international tourism expenditure in 2012 from the ranked 7th in 2000. The spending by outbound Chinese tourists extended its lead further, which increased expenditure in 2013 by a massive US$ 27 billion to a record US$ 129 billion. This oversee spending amount is almost ten time rather than the amount in 2000. It is boosted by disposable incomes surge, foreign travel permission and currency appreciation.
The Taiwan authority has released the regulation of Chinese people traveling to Taiwan in 2002, January. But until 2009, the obviously increasing numbers of China tourists have shown in international tourism hospital report of Taiwan Tourism Bureau. Therefore, the increasing China tourists should have significant impact on the hotel operation performance.
From Table 7 to Table 9, we use China arrival number as independent variable to test the impact of china tourist numbers on each international hotel operation variables of different location in Taiwan by the pool regression with time series and cross section data. The time series include 58 monthly observations from 2009 January to 2013 October. The cross section data is collected by different areas which are defined by Taiwan Tourism Bureau. The dependent variables are classified into four categories: Revenue, Rate, Occupancy, and Employee. The interpretations of the empirical results are as follows:
Revenue. Table 7 illustrates the relationship between the Chinese tourist arrivals
and the hotel revenue by difference hotel location in Taiwan. The estimated coefficients in Table 7 are significant positive at the 10% level but only in Kaohsiung presents insignificant on the room department revenue. The positive value for
29
coefficients indicates that more Chinese visitors would significantly increases the hotel revenues. The highest coefficient is 2203 of the hotel in other area. The second high coefficient number is 1488 in Taipei. The results illustrate that Chinese tourists have higher contributed spending in the hotels of other area and Taipei. But the hotels in Kaohsiung have little economy benefit from the Chinese tourist arrivals. Compare to Table 5, Chinese tourist as European travelers have significant impact on the hotel revenue located inOther area.
Rate. Table 8 reports the relationship between the Chinese tourist arrivals and
the hotel room rates in different areas. The coefficients are only significant negative in Taipei, Kaohsiung, and TaoChuMiao. The room rate coefficient in Kaohsiung is negative 0.0934 and larger than others. It implies the relationship between Chinese arrivals and room rate is different to the previous section result of other foreigner tourists and presents the Chinese tourists choose the hotels with lower room price especially in Kaohsiung. This result shows that more and more Chinese tourists stay at normal hotel than international tourism hotels as the hotel room rate has increased continually.
Occupancy. Table 9 illustrates the relationship between the room occupancy and
Chinese tourist arrivals. The positive coefficient of different areas all indicates that Chinese tourist arrivals have positive relationship with the occupancy of hotels. The occupancy of hotels in Others location which include Tainan, Keelung, Penghu, and Yilan counties are highly sensitive to Chinese tourist arrivals due the largest coefficient 0.0074% in Table 11 as the Asian tourist arrival results in Table 7. This result implies that Chinese tourists could increase room occupancy of hotels in all locations.
30
CHAPTER V
CONCLUSION
This paper incorporates the disaggregation analysis into panel regression model to investigate the relationship between the tourist arrivals from different country and hotel operation in different location.
The results of past research focus on the aggregated data of tourist arrivals and hotel operation variables but neglect the difference of the hotel location and arrival nationality. It only offer less information for hotel managers to understand that which country tourist is import target market to their business operation variables with different hotel locations. Meanwhile, the sample sizes in this paper are more and broader than previous researches which only consider the listing firms (the firms trading in the stock exchange).
31
5.1. Foreigner and domestic tourist arrivals
On the second part of our results, we explore how the references of international consumers from different distinct cultures might differ concerning the hotel room services and products. Cultural difference will influence customer’s perceptions of hotel pricing policies. Wang and Mattila (2011) stated that “customer’s cultural background is an important factor because culture shapes how people think and perceive and event.” In the hospitality industry it is reasonable to believe differences between Western and Chinese customers in their reactions to hotel pricing policies. Kimes and Wirtz (2003) demonstrate that Asian customer experience revenue management practices to be less reasonable than consumer from Europe and North America in the restaurant industry. Choi and Mattila (2006) tested the perception of fairness of hotel room rate between US and Korean guests and believe that US guests recognize the hotel pricing to be fairer than Korean guests. Mattila and Choi (2006) indicate that offering information on a hotel’s room rate policy had a relatively more storing positive effect on Korean than on their US consumers.
Rate restrictions as one of hotel pricing policies are the methods that hotels rule to segment customers and to rationalize why different customers have different prices to pay (Mauri, 2007). Rate restrictions is connected to revenue management to help hotel guests to self-segment into different rate classes for the purposes of controlling the demand between peak and off-peak periods, and rewarding loyal guests, and arranging the highest-margin business benefits (Kimes and Singh, 2009)
The disaggregation analysis models between the relationship between the relationship between the tourist arrival numbers and the hotel operation variables in helpful in assisting hotel managers’ assessment of various tourist segments in making hotel pricing policies, human resource, marketing and competition decision.
32
The positive relationships between the hotel revenue and international customers are significantly influenced by location and nationality difference. Therefore the hotel performance should be measured by different hotel location for employee performance assessment. The hotel customers from different countries with culture difference present different consumer behavior. In Taiwan, European guests have mostly impact on the hotel revenue and hotel managers should pay more attention on rate restriction and pricing policy to European segments in order to stabilize hotel revenue management. Meanwhile, the hotel managers in Scenery location also suffer higher revenue volatility and should control the demand between peak and off-peak periods for profit maximum.
The previous empirical results by (Pan, 2007) support market demand variations significantly affect the difference between high season and low season optimal room rates with the data of tourist hotels in Taipei. This paper further supports the positive relationship between the customer numbers and the room daily rate and evidence that different international guests affect the hotel room rate with location difference. Our results indicate that hotel room rate is strong positive sensitive to European tourists in most locations and the most domestic guests and foreigner guests would increase the hotel room rate in Scenery location. The significant positive relationship between hotel price and European tourist arrivals could be explained by the culture difference that west consumers perceive the hotel room pricing to be fairer than Eastern consumers (Kimes and Wirtz, 2003; Choi and Mattila, 2006) as a cost increase period. The explanation to why most hotel room rate is more sensitive to guests in Scenery could be due to the location factor of destination’s attractiveness which may include the tourism welcomeness, Tourism infrastructure, and crime rate (Assaf, Josiassen, and Agbola, 2015).
33
Our results also show that the relationship between tourist coming and the hotel occupancy rate presents significant positive or negative. The US, Asian, Australian, and European have different degree negative relationship with the hotel occupancy rate. The negative relationship is more important in European tourist with negative coefficients except in Taichung and Scenery and is very different to other foreigner guests and domestic guests. This empirical result could be due to the demand between peak and off-peak period, and offer more customer behavior information to design the hotel rate restrictions to attract more customers.
34
5.2. Chinese tourist effect
Furthermore, we also examine the relationship between Chinese tourist arrivals and the hotel operation variable. Chinese tourists have strong positive relationship in the hotels location of Others area and Taipei area. The positive coefficient of all areas indicates that Chinese tourist arrivals have positive relationship with the occupancy of hotels. The occupancy of hotels in other location which include Tainan, Keelung, Penghu, and Yilan counties are highly sensitive to Chinese tourist arrivals. Chinese tourists prefer choosing the hotels with lower room price especially in Kaohsiung. Finally, the relationship between employee numbers and Chinese tourist arrivals is positive only statistically significant positive in Taichung, Kaohsiung, Scenery, and others locations. The result also shows that Chinese tourist arrivals have little impact on the hotel employee numbers in Taipei.
The Chinese tourists have more influence on Taiwan tourism market due to the progress of a peaceful Taiwan Strait tie. From these results of that Chinese tourist arrivals have different degree impacts on hotel revenue income and occupancy by different locations. The hotels in Taipei with priority location strategy can benefit more economic rewards from Chinese tourists. And the hotels in Others area with higher accessible such as attractions (Jiufen, Yehliu), Night markets (Keelung Miaokou, Tainan Flowers) can attract more Chinese tourists than other locations. Moreover, the hotels in Kaohsiung following by the demand law could use price discount to increase the Chinese tourist accommodations.
Based on our empirical results, manager can acknowledge that the customers origin culture difference and location factor are vital sensitive to revenue management, pricing policies, and employee human resource development, and performance management.
35
5.3. Limitation and opportunities of future research
The paper suffers from vital limitations that could be investigated in future research. First, future studies can be conducted on the additional control variables such as economic conditions in the country of destination or origin. Second, future studies could be expanded to examine the location factors, to test whether the findings of this study can be explained by the location factors such as infrastructure, tourism welcomeness, and crime rate so on. Finally, future studies might consider extending the sample of this study. For example the more detail hotel information might have influenced the findings in this paper and affected the results that were drawn from the data used. We believe that adding more listing hotel to the sample would be important in order to validate and provide further evidence to the meaningful of the present findings and practice application.
36
REFERENCES
Archer, B. (1995). Importance of tourism for the economy of Bermuda. Annals of Tourism Research, 22 (4), 918-930.
Assaf, A.G., Josiassen, A., and Agbola. F.W. (2015) Attracting international hotels: Locational factor that matter most. Tourism Management, 47, 329-340.
Balaguer, L. and Cantavella-Jorda, M. (2002). Tourism as a long-run economic growth factor: the Spanish case. Applied Economics, 34(7), 877-884.
Baltagi, B.H. (2005). Econometric analysis of panel fata (3rd ed.). West Sussex, England: John Wiley & Sons, Ltd.
Barney, J.B. (2002). Gaining and sustaining competitive advantage. Upper Saddle River: NJ Pearson Education, Inc.
Barrows, C.W. and Naka, A. (1994). Use of macroeconomic variables to evaluate selected hospitality stock returns in the US. International Journal of Hospitality Management, 13 (2), 119-128.
Barsky, J. and Labagh, R. (1992). A strategy for customer satisfaction. The Cornell Hotel and Restaurant Administration Quarterly, 35 (5), 32-40.
Choi, S. and Mattila, A.S. (2006). The role of disclosure in variable hotel pricing: a cross-cultural comparison of customers’ fairness perceptions. Cornell Hotel and Restaurant Administration Quarterly, 47 (1), 27-35.
Chang, C. (2009). To Hedge or Not to Hedge: Revenue Management and Exchange Rates Risk. Cornell Hospitality Quarterly, 50(3). 301-313.
Chen, C.M. (2013). Estimating the work time effect on hotel room demand, Tourism Economics, 19 (6), 1461-1466.
Chen, M.H. (2007a). Hotel stock performance and monetary conditions. International Journal of Hospitality Management, 26 (3), 588-602.
37
Chen, M.H. (2007b). Interactions between business conditions and financial performance of tourism firms: evidence from China and Taiwan. Tourism Management, 28 (1), 188-203.
Chen, M.H. (2007c). Macro and non-macro explanatory factors of Chinese hotel stock returns. International Journal of Hospitality Management, 26 (4), 991-1004. Chen, M.H. (2010). The economy, tourism growth and corporate performance in the
Taiwanese hotel industry. Tourism Management, 31 (5), 665-675.
Chen, M.H. (2011). The response of hotel performance to international tourism development and crisis events. International Journal of Hospitality Management, 30, 200-212.
Chen, M.H., Kim, W.G., and Kim, H.J. (2005). The impact of macroeconomic and non-macroeconomic forces on hotel stock returns. International Journal of Hospitality Management, 24 (2), 243-258.
Chen, M.H., Kim, W.G., and Liao, C.N. (2009). The impact of government weekend policy changes and foreign institutional holdings on weekly effect of tourism stock performance. Journal of Hospitality and Tourism Research, 33 (2), 139-160.
Chiou, J.G. (2003). Developing an economic indicator system (a forecasting technique ) for the hotel industry. International Journal of Hospitality Management, 22 (2), 147-159.
Choi, J., Olson, M.D., Kwansa, F.A., and Tse, E. (1999). Forecasting industry turning points: The U.S. hotel industry cycle model. International Journal of Hospitality Financial Management. 18 (2), 159-170.
Chu, R.K.S. and Choi, T. (2000). An importance-performance analysis of hotel selection factors in the Hong Kong hotel industry: a comparison of business and
38
leisure travelers. Tourism Management, 21 (4), 363-377.
Corgel, J., Lane, J., and Walls, A. (2013). How currency exchange rates affect the demand for U.S. hotel rooms. International Journal of Hospitality Management, 35, 78-88.
Crouch, G. (1994). The Study of International Tourism Demand: A Survey of Practice. Journal of Travel Research, 32 (4), 41-55.
Dimitrios, A. (2005). Applied econometrics: A modern approach using EViews and Microfit. New York: Houndmill, Basingstoke, Hampshire, Palgrave Macmillan. Divisekera, S. (2003). A model of demand for international tourism. annals of
Tourism Research, 30, 31-49.
Enz, C.A., Canina, L., and Lomanno, M. (2009). Competitive pricing decisions in uncertain times. Cornell Hospital. Quarterly, 50 (3), 325-341.
Enz, C.A., Peiró-Signes, Á., and Segarra-Oña, M.-D.-V. (2014). How fast do new hotels ramp up performance? Cornell Hospitality Quarterly, 55 (2), 141-151. Goodman, John L., Jr. (1998). Aggregation of Local Housing Markets. Journal of
Real Estate Finance and Economics, 16 (1), 43-53.
Graham, I.C. and Harris, P.J. (1999). Development of a profit planning framework in an international hotel chain: a case study. International Journal of Contemporary Hospitality Management, 11 (5),198-204.
Gray, H.P. (1966). The Demand for International Travel by the United States and Canada. International Economic Review, 7 (1), 83-92.
Guerrier, Y. and Deery, M. (1998). Research in hospitality human resource management & organisational behavior. International Journal of Hospitality Management, 17, 145-160.
39
Turkey? Applied Economics Letters, 12 (8), 499-504.
Harris, P.J. and Brown J.B. (1998). Research and development in hospitality accounting and financial management. Hospitality Management, 17, 161-181. Hausman, A. (1978). Specification tests in econometrics. Econometrica, 46 (5),
1251-1271.
Hsiao, C. (1986). Analysis of panel data. Cambridge. New York: Cambridge University Press.
Hung, W.T., Shang, J.K., and Wang, F.C. (2010). Pricing determinants in the hotel industry: quantile regression analysis. International Journal of Hospitality Management, 29 (3), 378-384.
Hsieh, A. T. and Chang, J. (2006) Shopping and Tourist Night Markets in Taiwan. Tourism Management. 27 (1), 138-145.
Ip, C., Leung, R., and Law, R. (2011). Progress and development of information and communication technologies in hospitality. International Journal of Contemp Hospital Management, 23 (4), 533-551.
Jang, S.C. and Chen, M.H., (2008). Financial portfolio approach to optimal tourist market mixes. Tourism Management, 29 (4), 761-770.
Jang, S.S. and Park, K. (2011). Hospitality finance research during recent two decades: subjects, methodologies, and citations. International Journal of Contemp. Hospital. Management, 23 (4), 479-497.
Jeffrey, D. and Barden, R.R.D. (2000). An analysis of daily occupancy performance: a basis for effective hotel marketing? International Journal of Contemporary Hospitality Management, 12 (3), 179-189.
Jeffrey, D. and Barden, R.R.D. (2001). Multivariate models of hotel occupancy performance and their implications for hotel marketing. International Journal of
40
Tourism Research, 3 (1), 33-44.
Johns, N., Howcroft, B., and Drake, L., (1997). The use of data envelopment analysis to monitor hotel productivity. Progress in Tourism and Hospitality Research, 3 (2), 119-127.
Kim, H.Y., Chen, M.H., and Jang, S.C. (2006). Tourism expansion and economic development: the case of Taiwan. Tourism Management, 27 (5), 925-933.
Kimes, S.E. and Wirtz, J. (2003). Has revenue management become acceptable? Findings from an international study on the perceived fairness of rate fences. Journal of Service Research, 6 (2), 125-135.
Kimes, S.E. and Singh, S. (2009). Spa revenue management. Cornell Hospitality Quarterly, 50 (1), 82-95.
Law, R., Leung, R., and Buhalis, D. (2009). Information technology applications in hospitality and tourism: a review of publications from 2005 to 2007. Journal of Travel Tourism Market, 26 (5–6), 599-623.
Lee C.G. (2010). The dynamic interactions between hotel room rates and international inbound tourists: Evidence from Singapore. International Journal of Hospitality, 29, 758-760.
Lee, C.C. and Chang, C.P. (2008). Tourism development and economic growth: a closer look at panels. Tourism Management, 29 (1), 180-192.
Lee, C.G. (2008). Tourism and economic growth: the case of Singapore. Regional and Sectoral Economic Studies, 8, 89-98.
Lee, S.K. and Jang, S. (2010). Internationalization and Exposure to Foreign Currency Risk: An Examination of Lodging Firms. International Journal of Hospitality Management, 29, 701-710.